


方案详情
文
1. **分子掺杂工艺:** 研究人员引入了一种使用二甲基胺基掺杂剂的分子掺杂工艺,该工艺能够创建一个与p-钙钛矿/ITO接触良好且能够完全钝化晶界的结构。这种创新工艺提高了钙钛矿太阳能电池的功率转换效率(PCE),实现了经认证的25.39%的PCE,这是对钙钛矿太阳能电池现有标准的改进。
2. **分子挤压技术:** 该工艺采用了一种独特的“分子挤压”方法,在甲苯淬灭结晶过程中将分子从前驱体溶液排出到晶界和薄膜底部。这种独特的技术导致了钙钛矿薄膜的p-掺杂,有助于提高器件的效率。
3. **长寿命和高效率:** 器件在逆向扫描时实现了25.86%的效率,并表现出卓越的稳定性,即使经过1000小时的光老化,仍能保持96.6%的初始效率。这表明钙钛矿太阳能电池在性能和可靠性方面取得了显著的进步。
方案详情

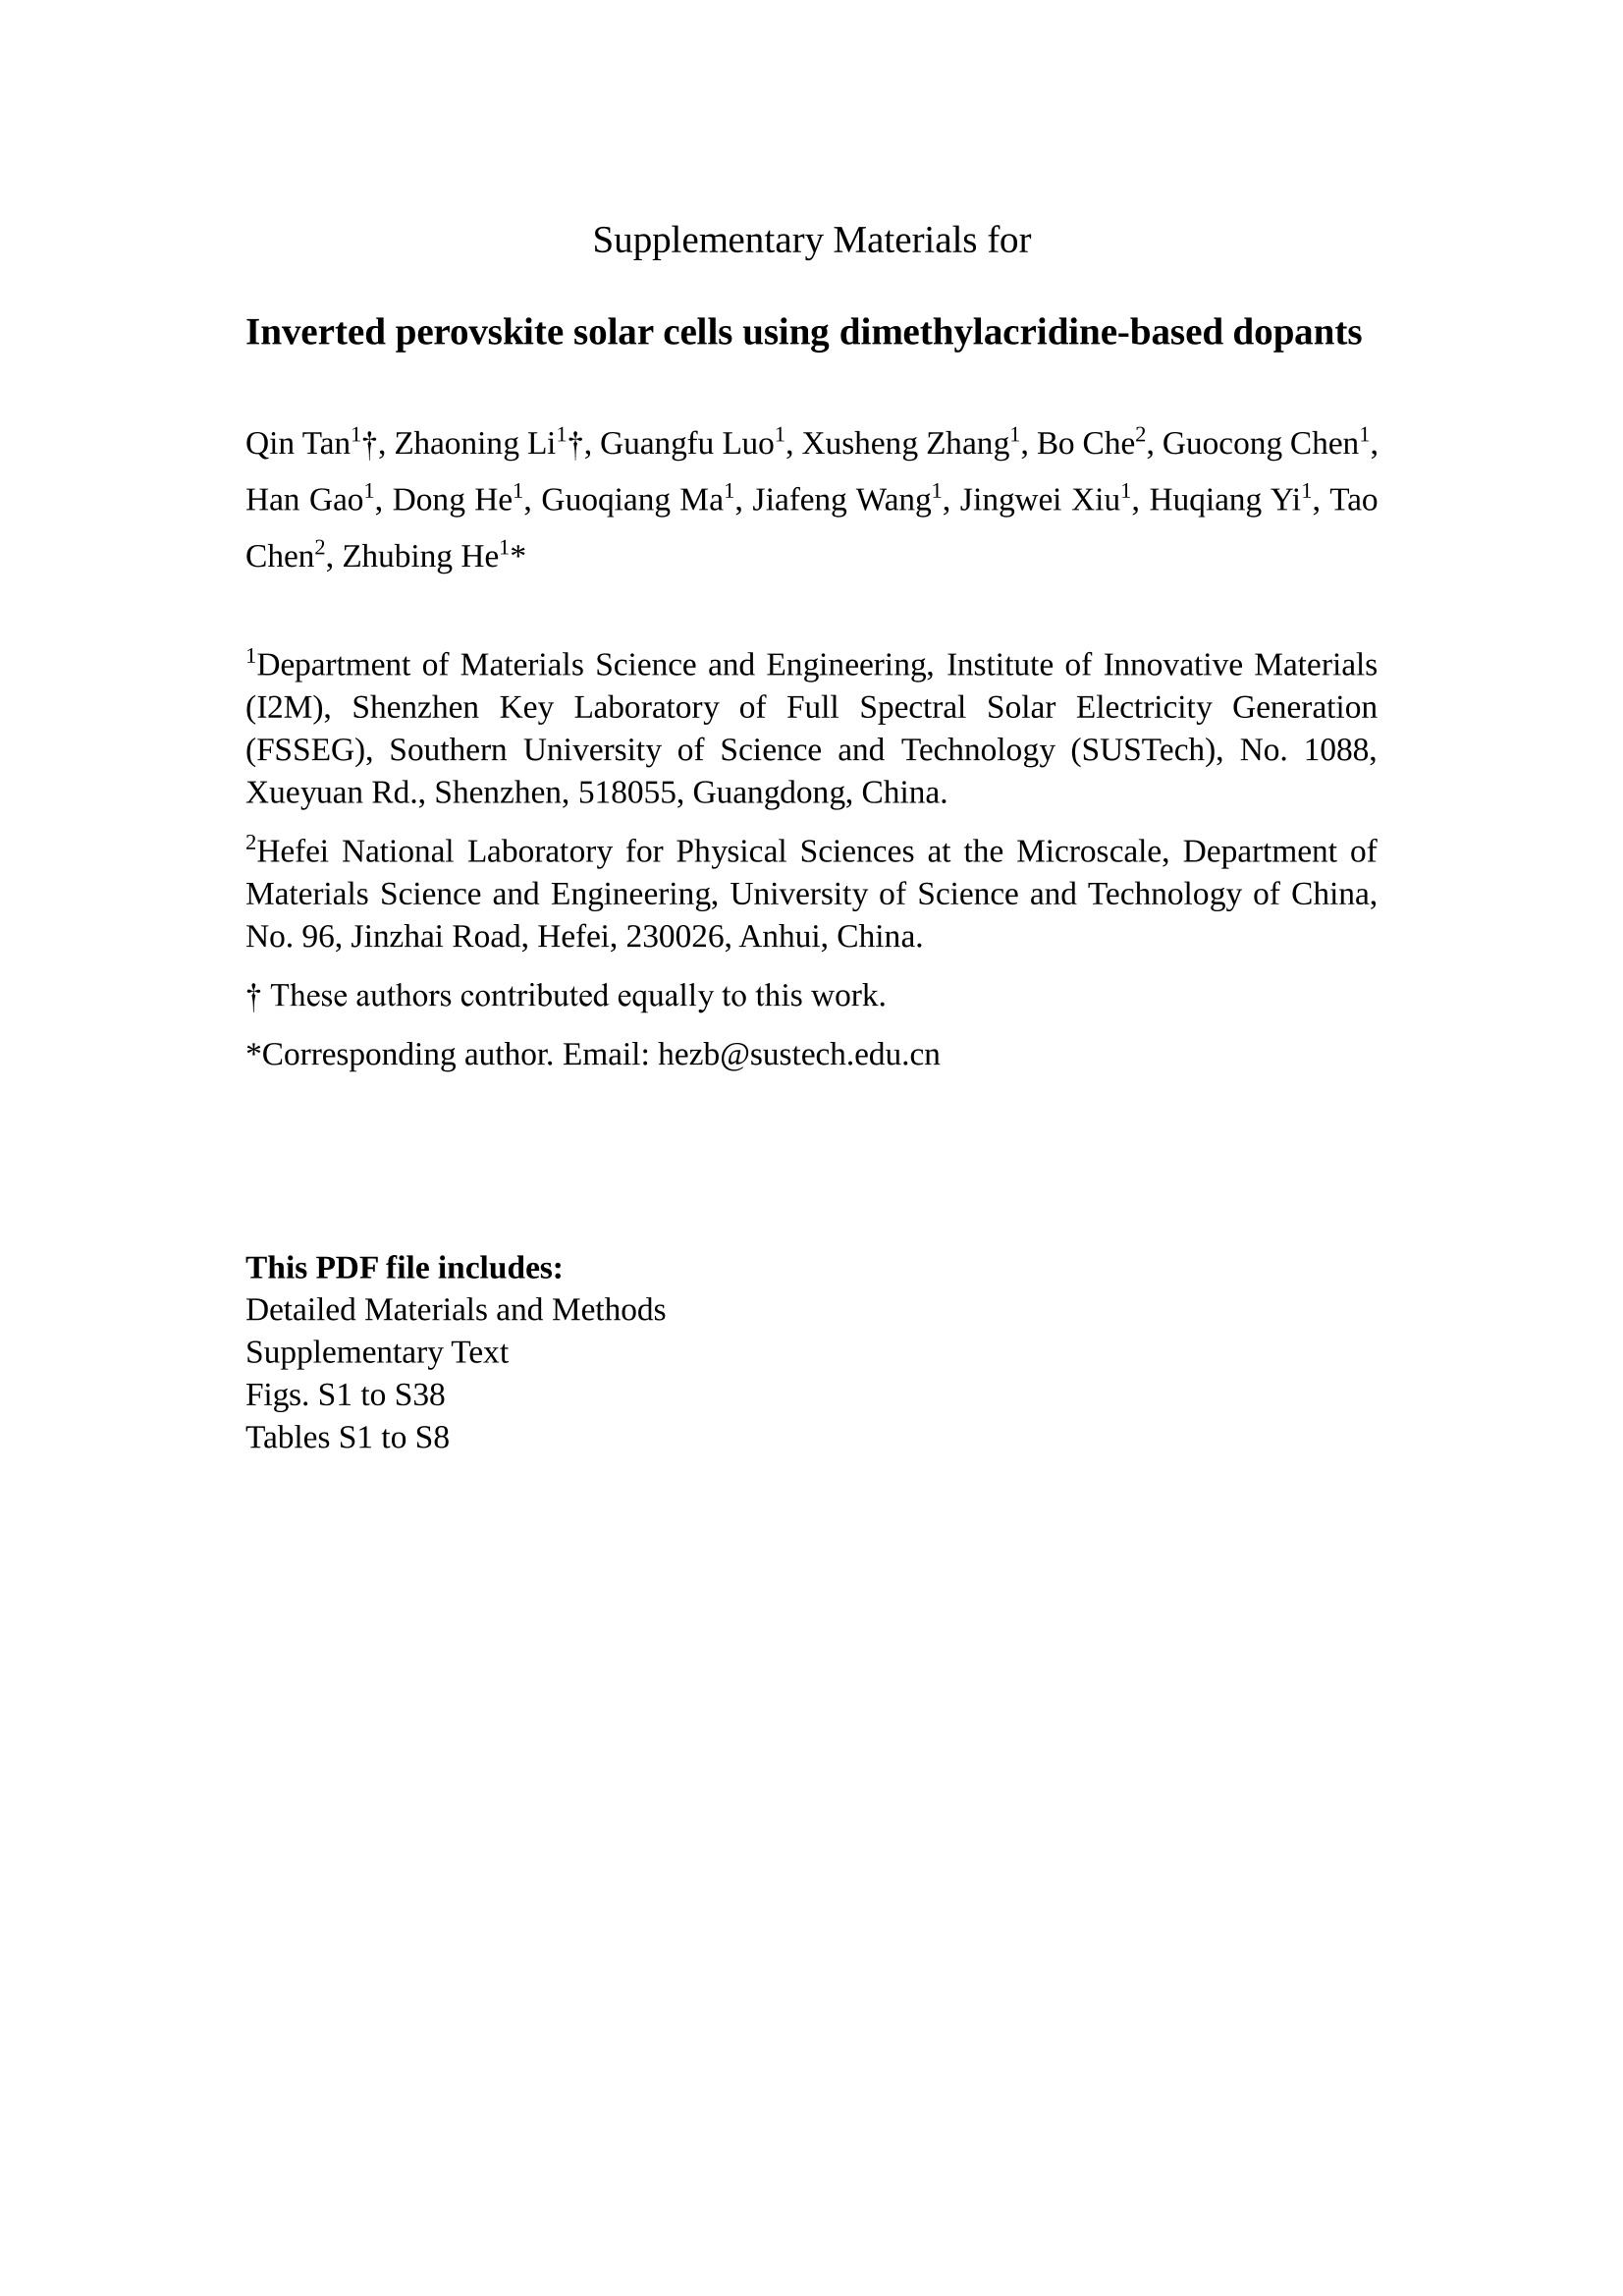
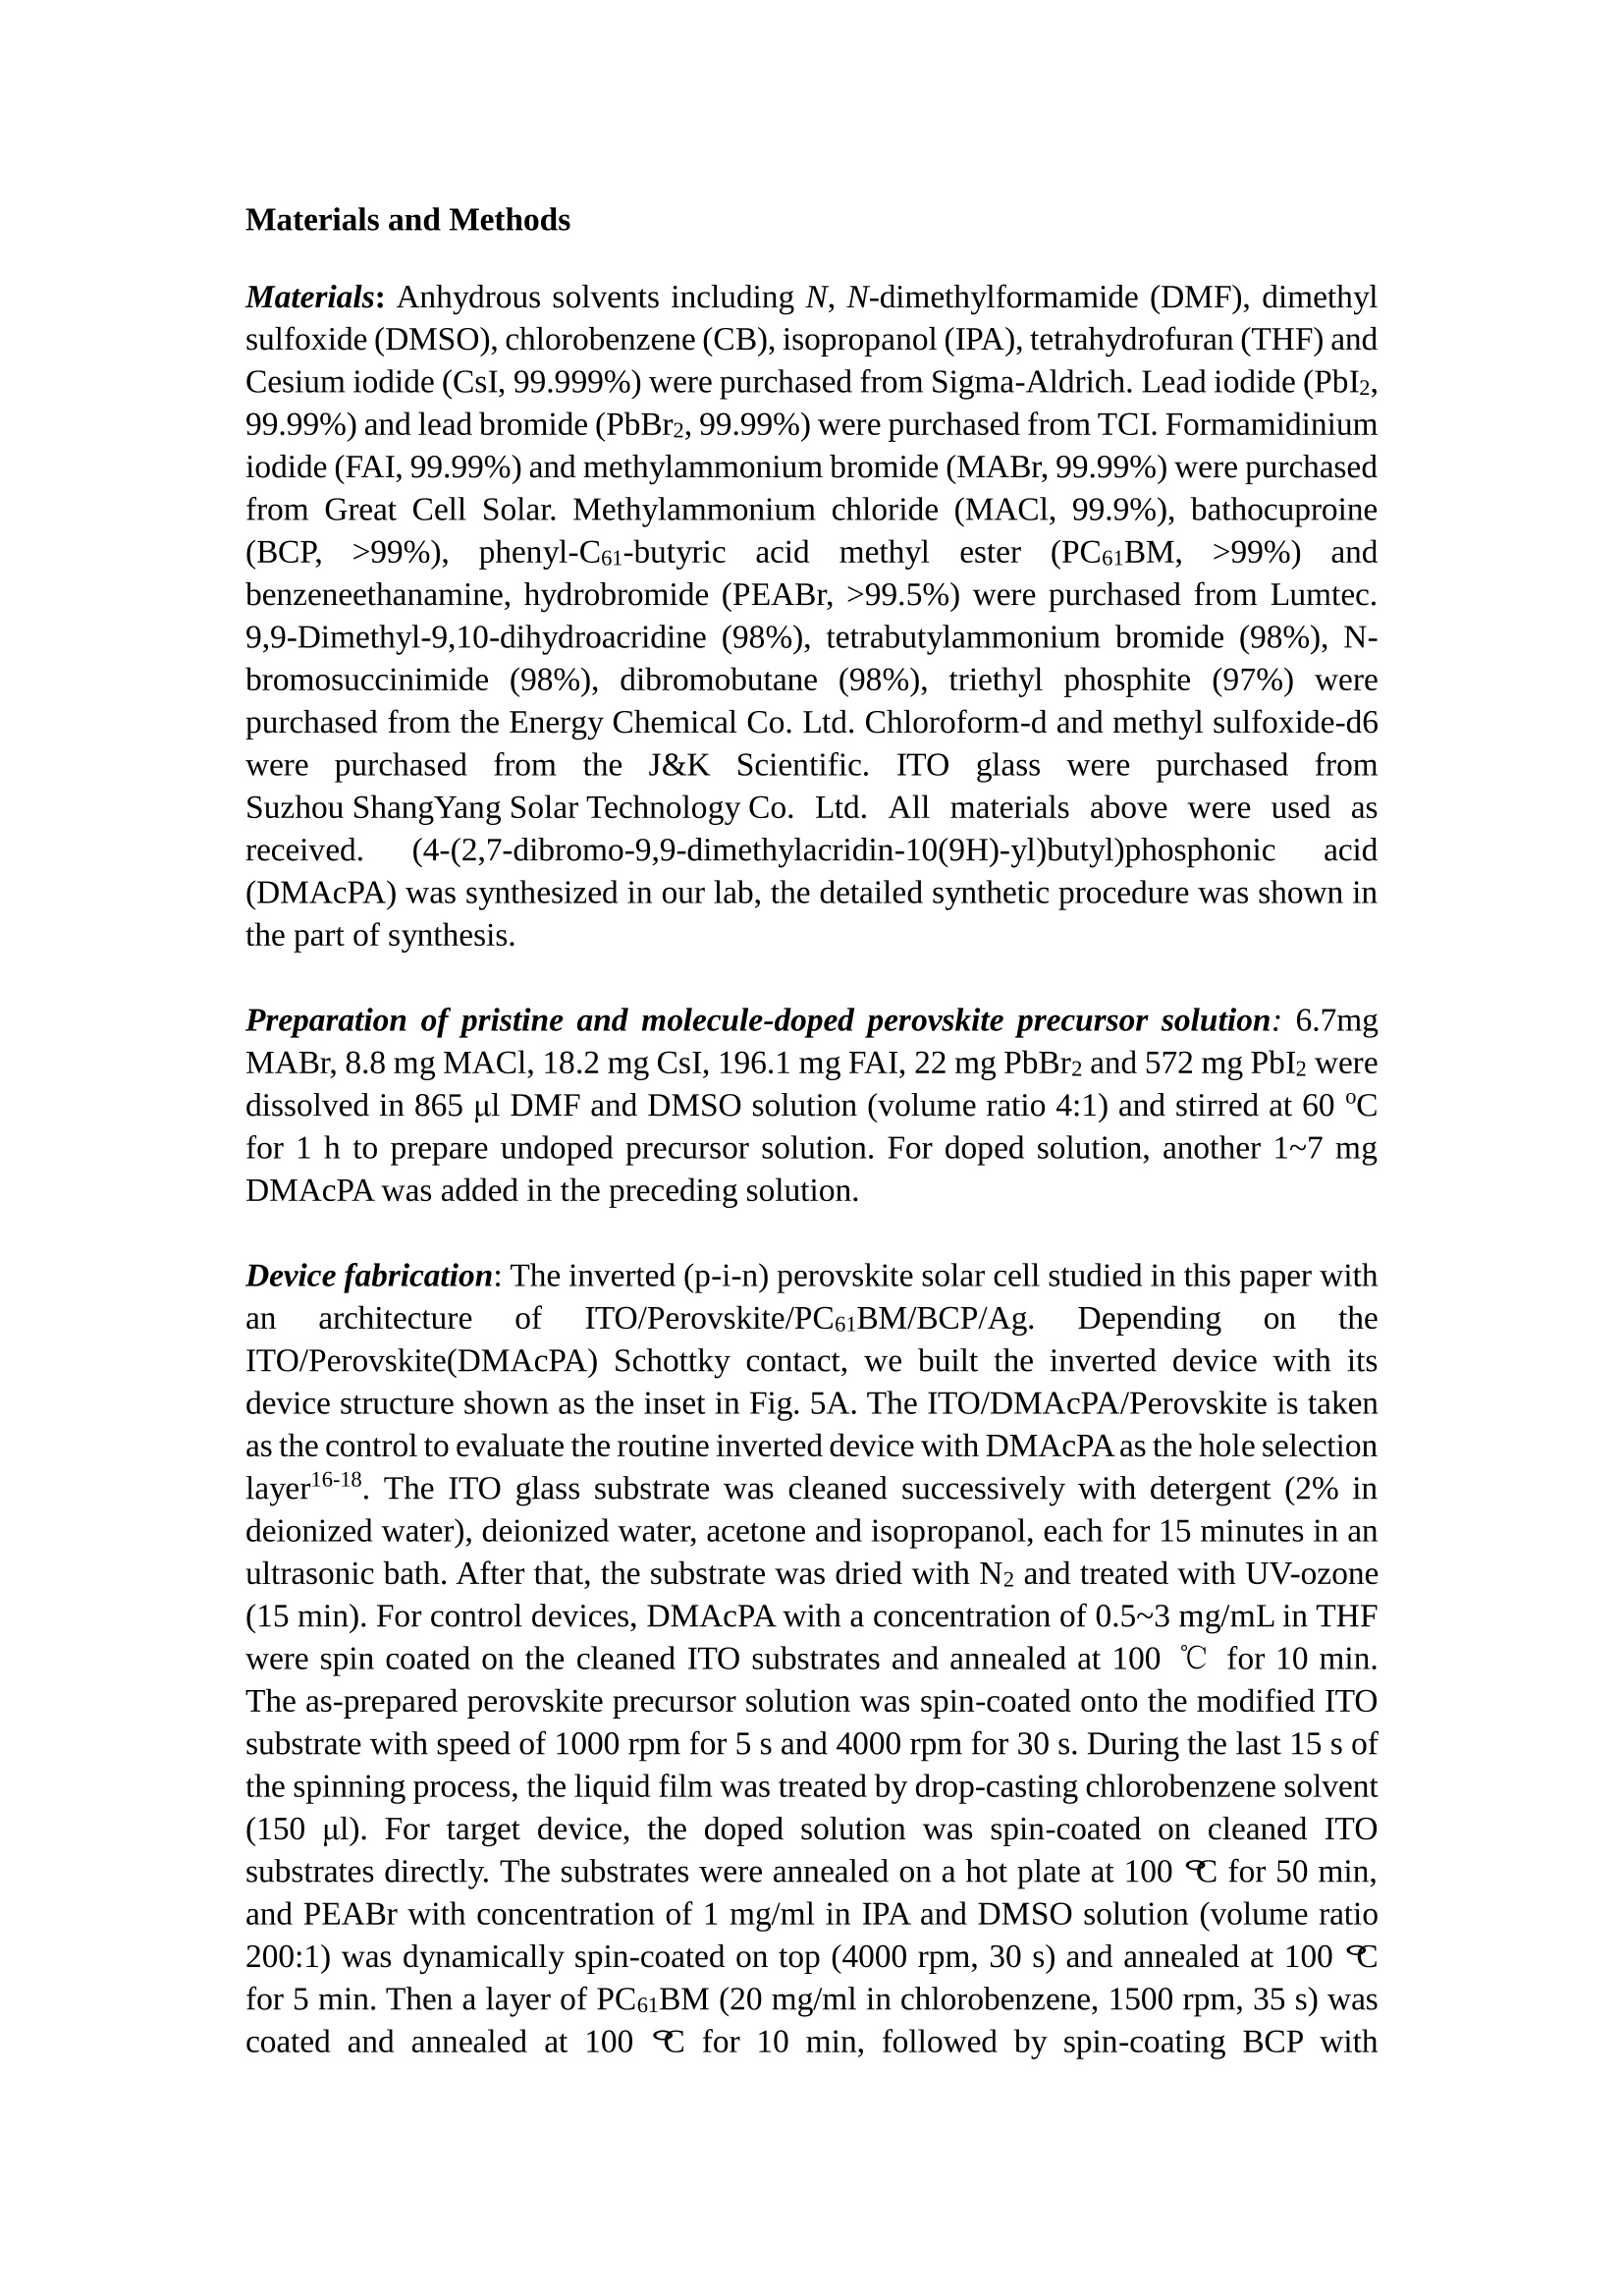
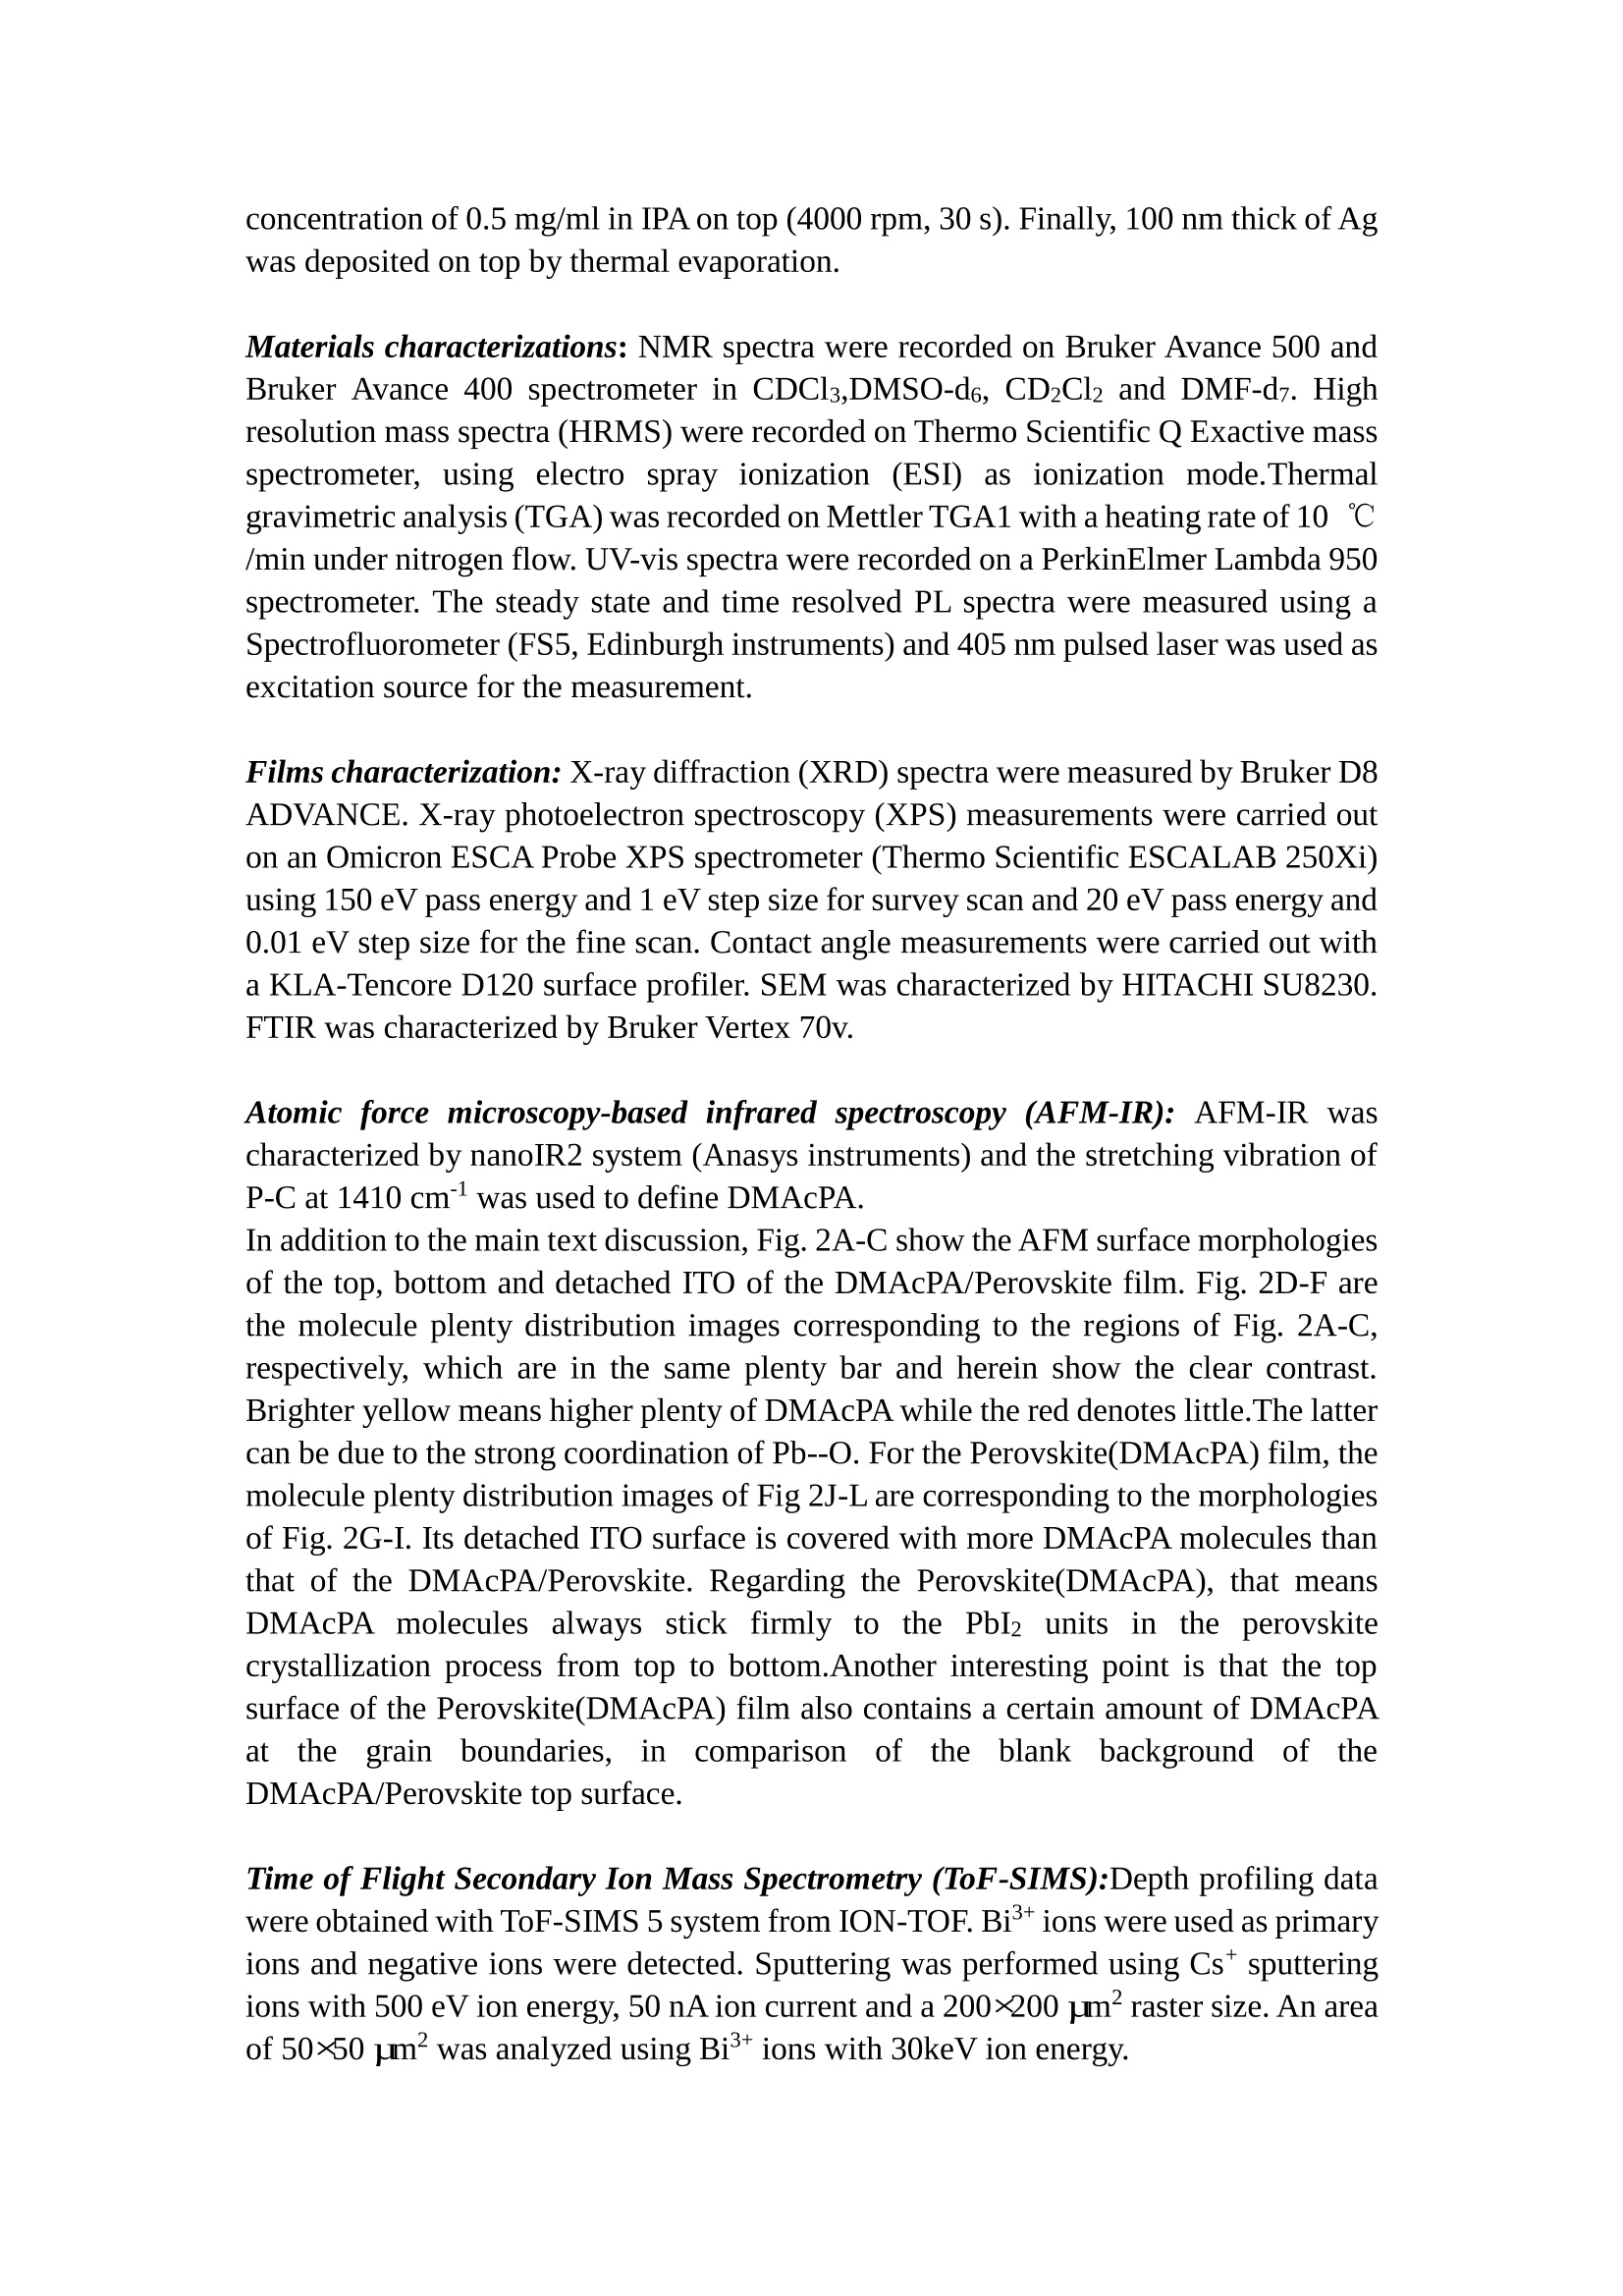
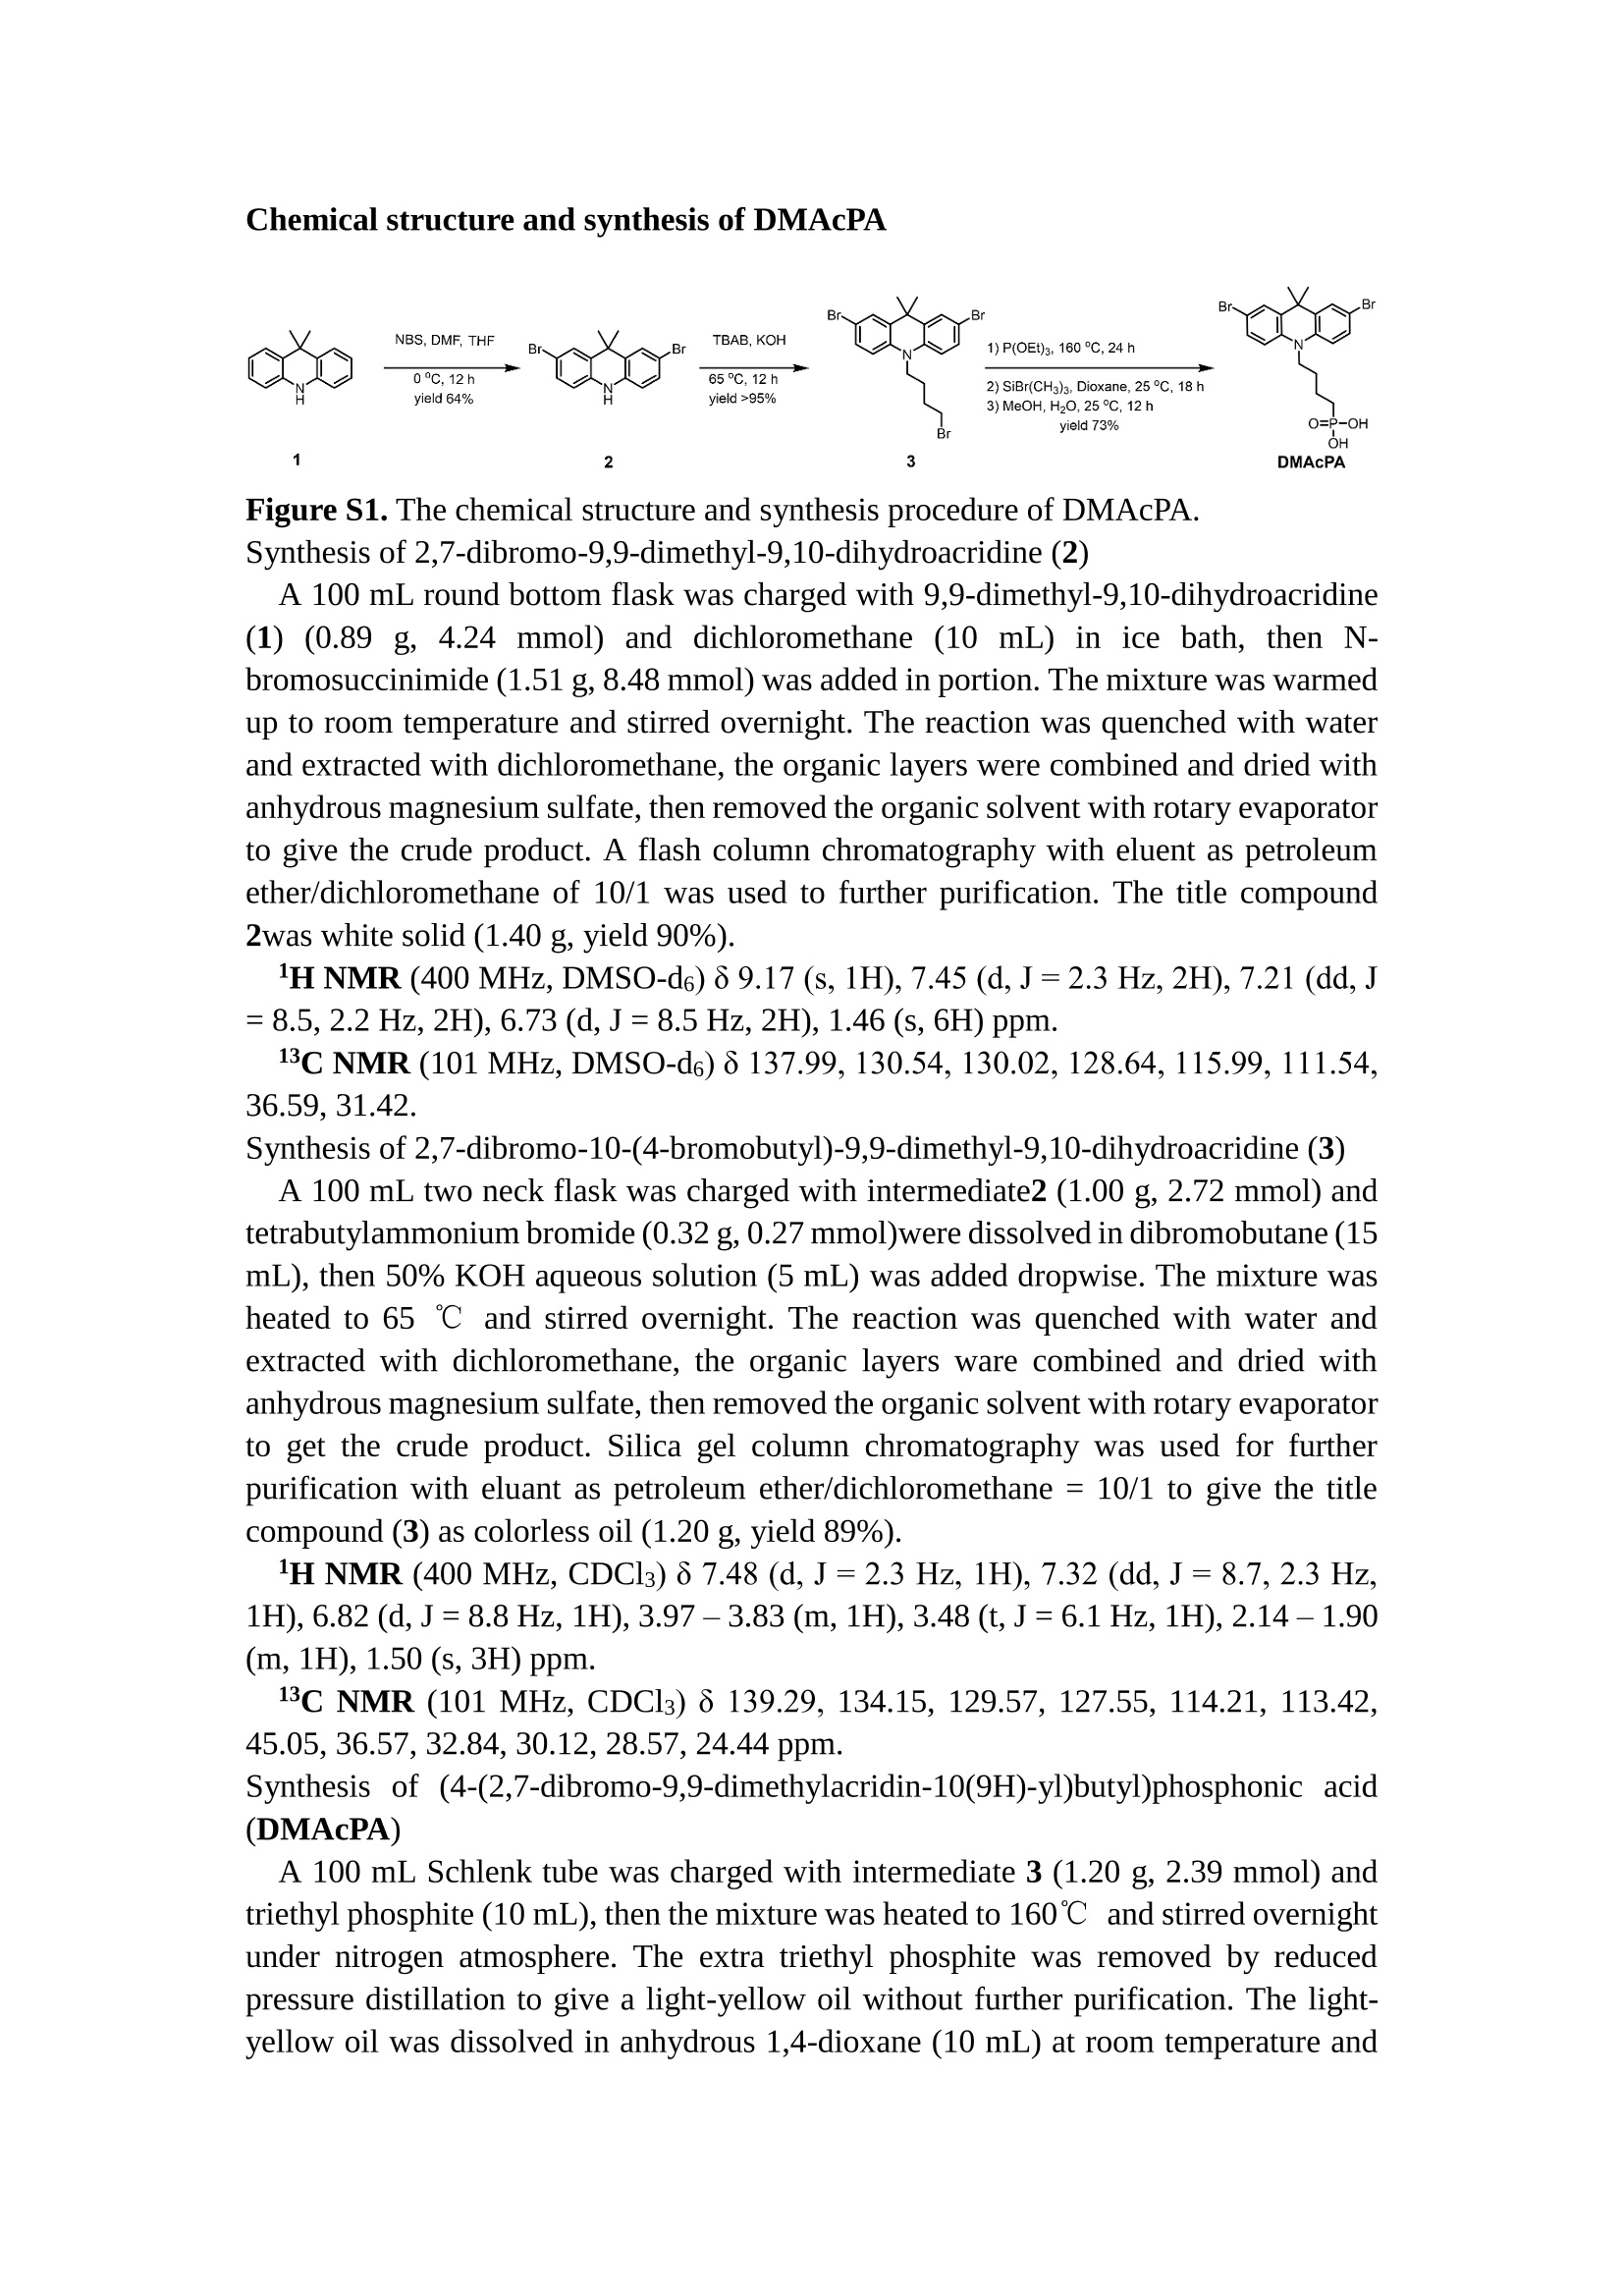
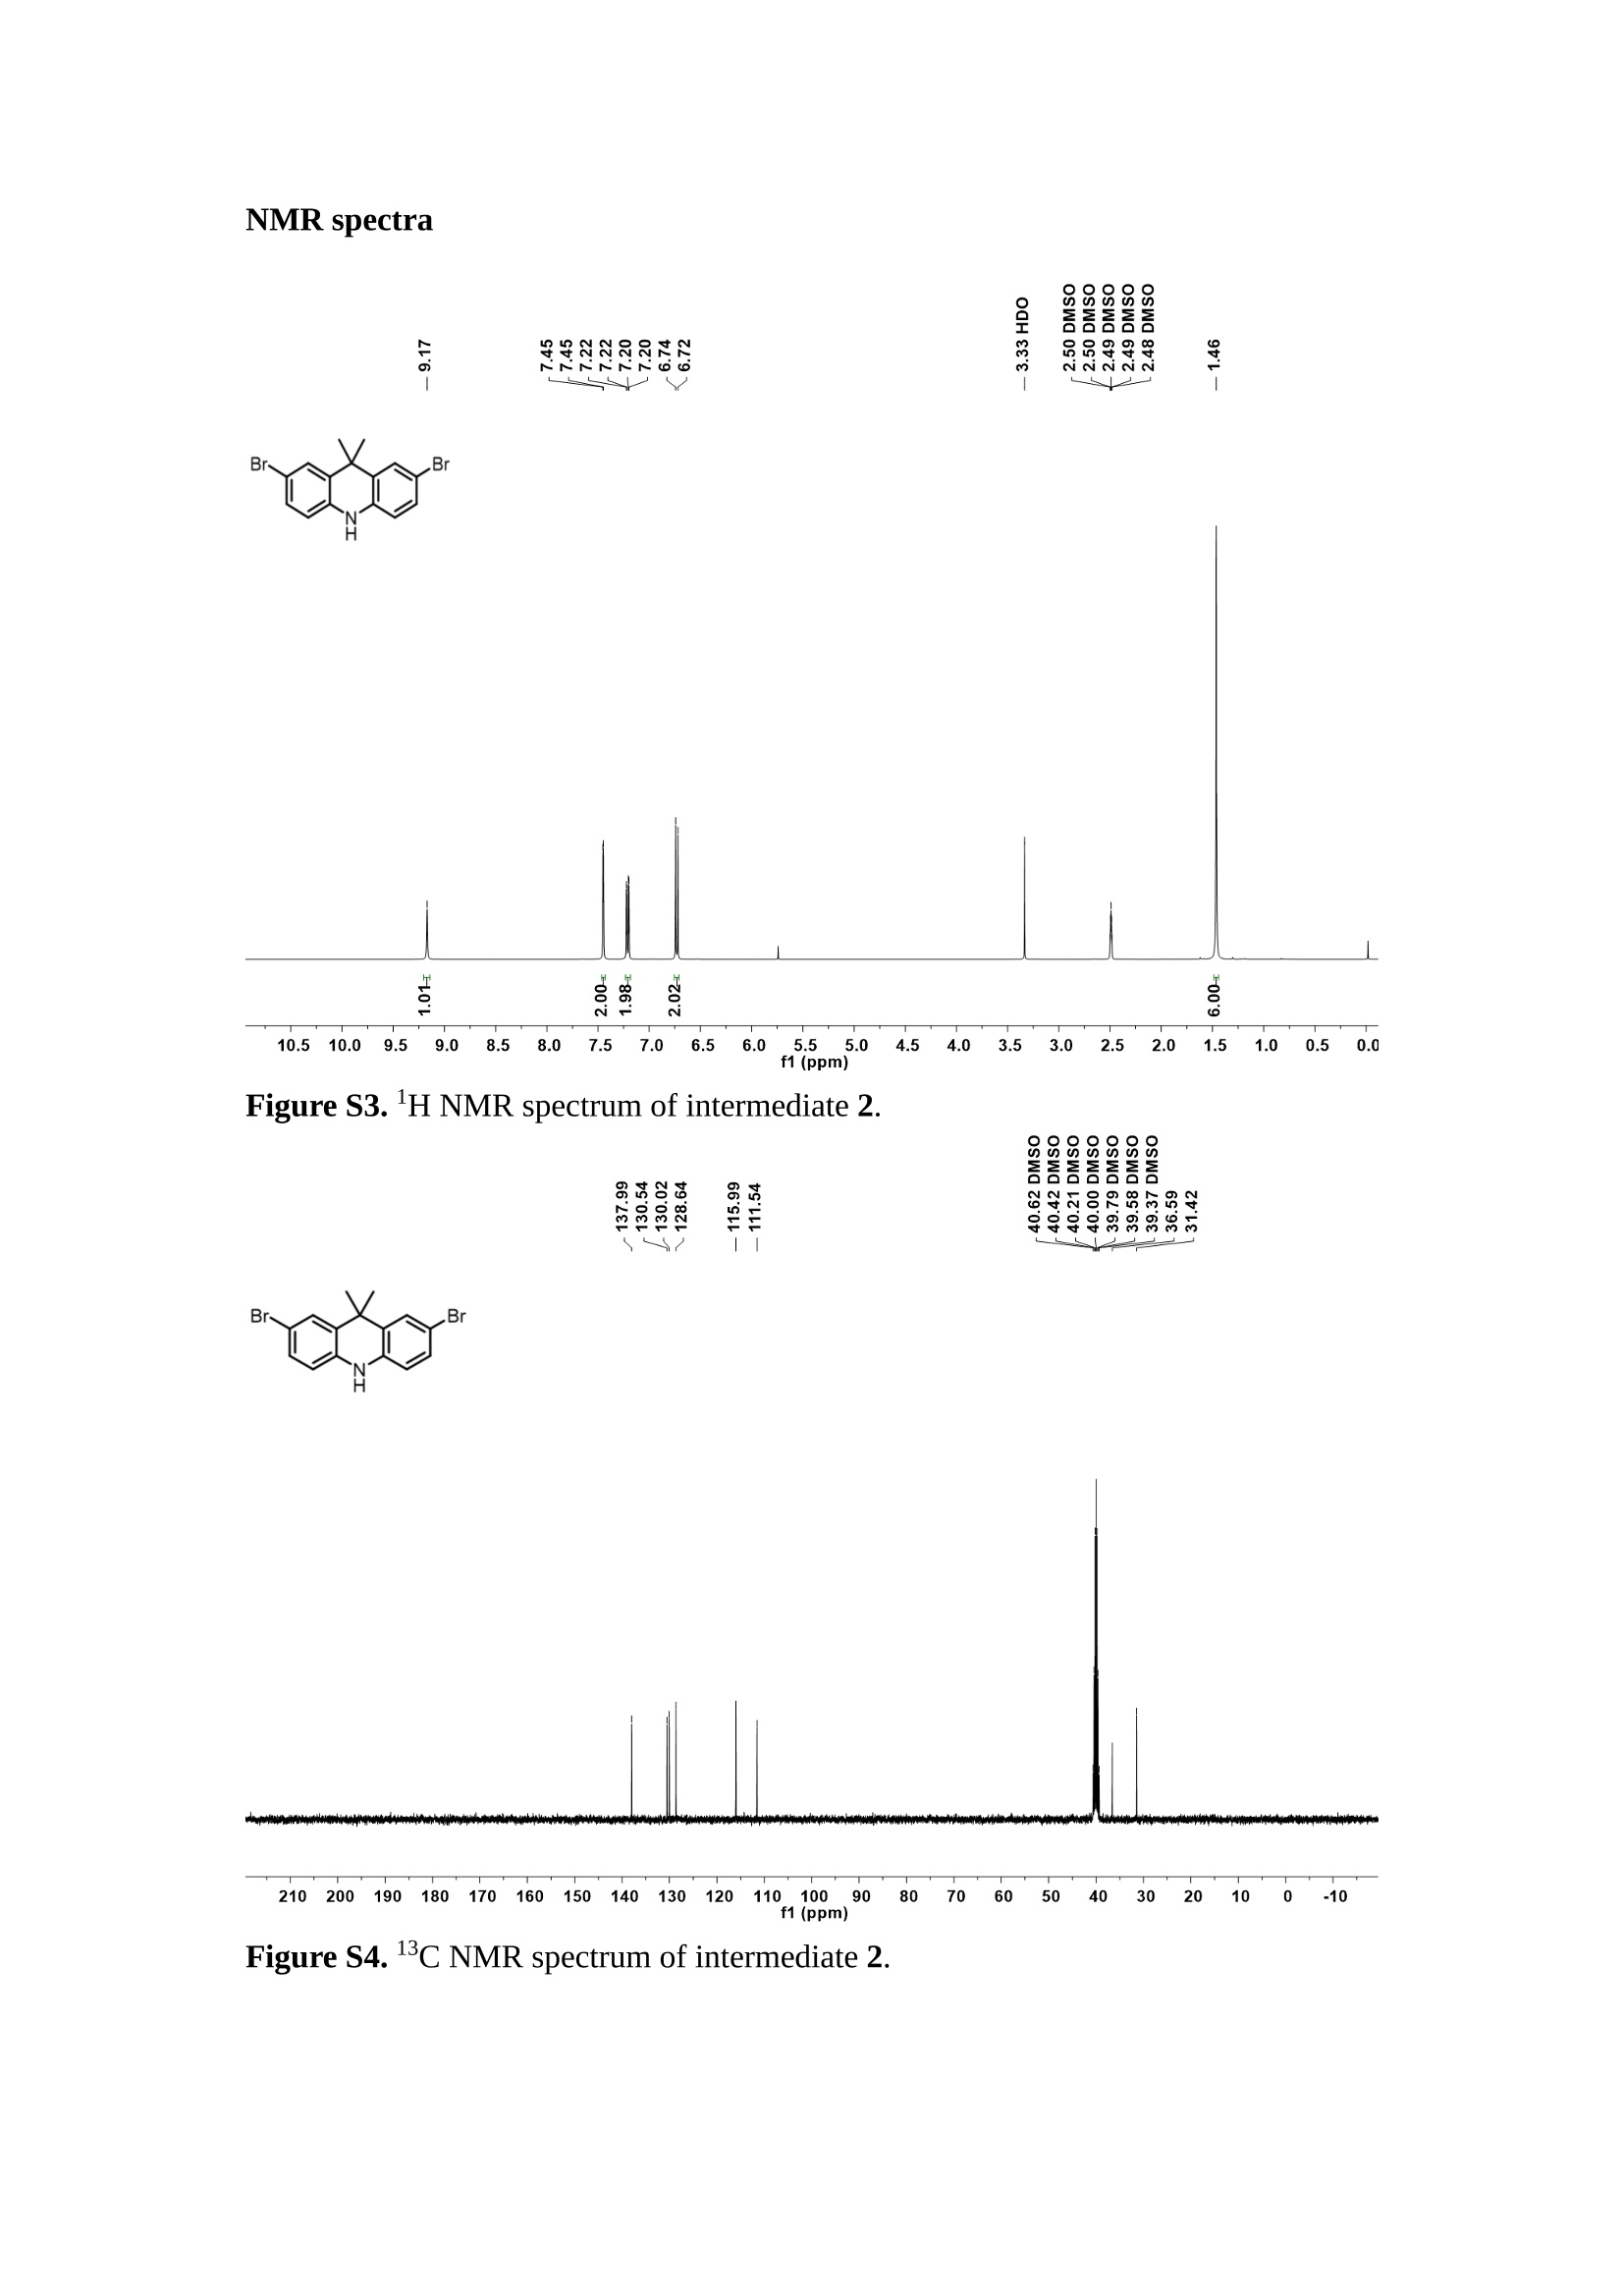
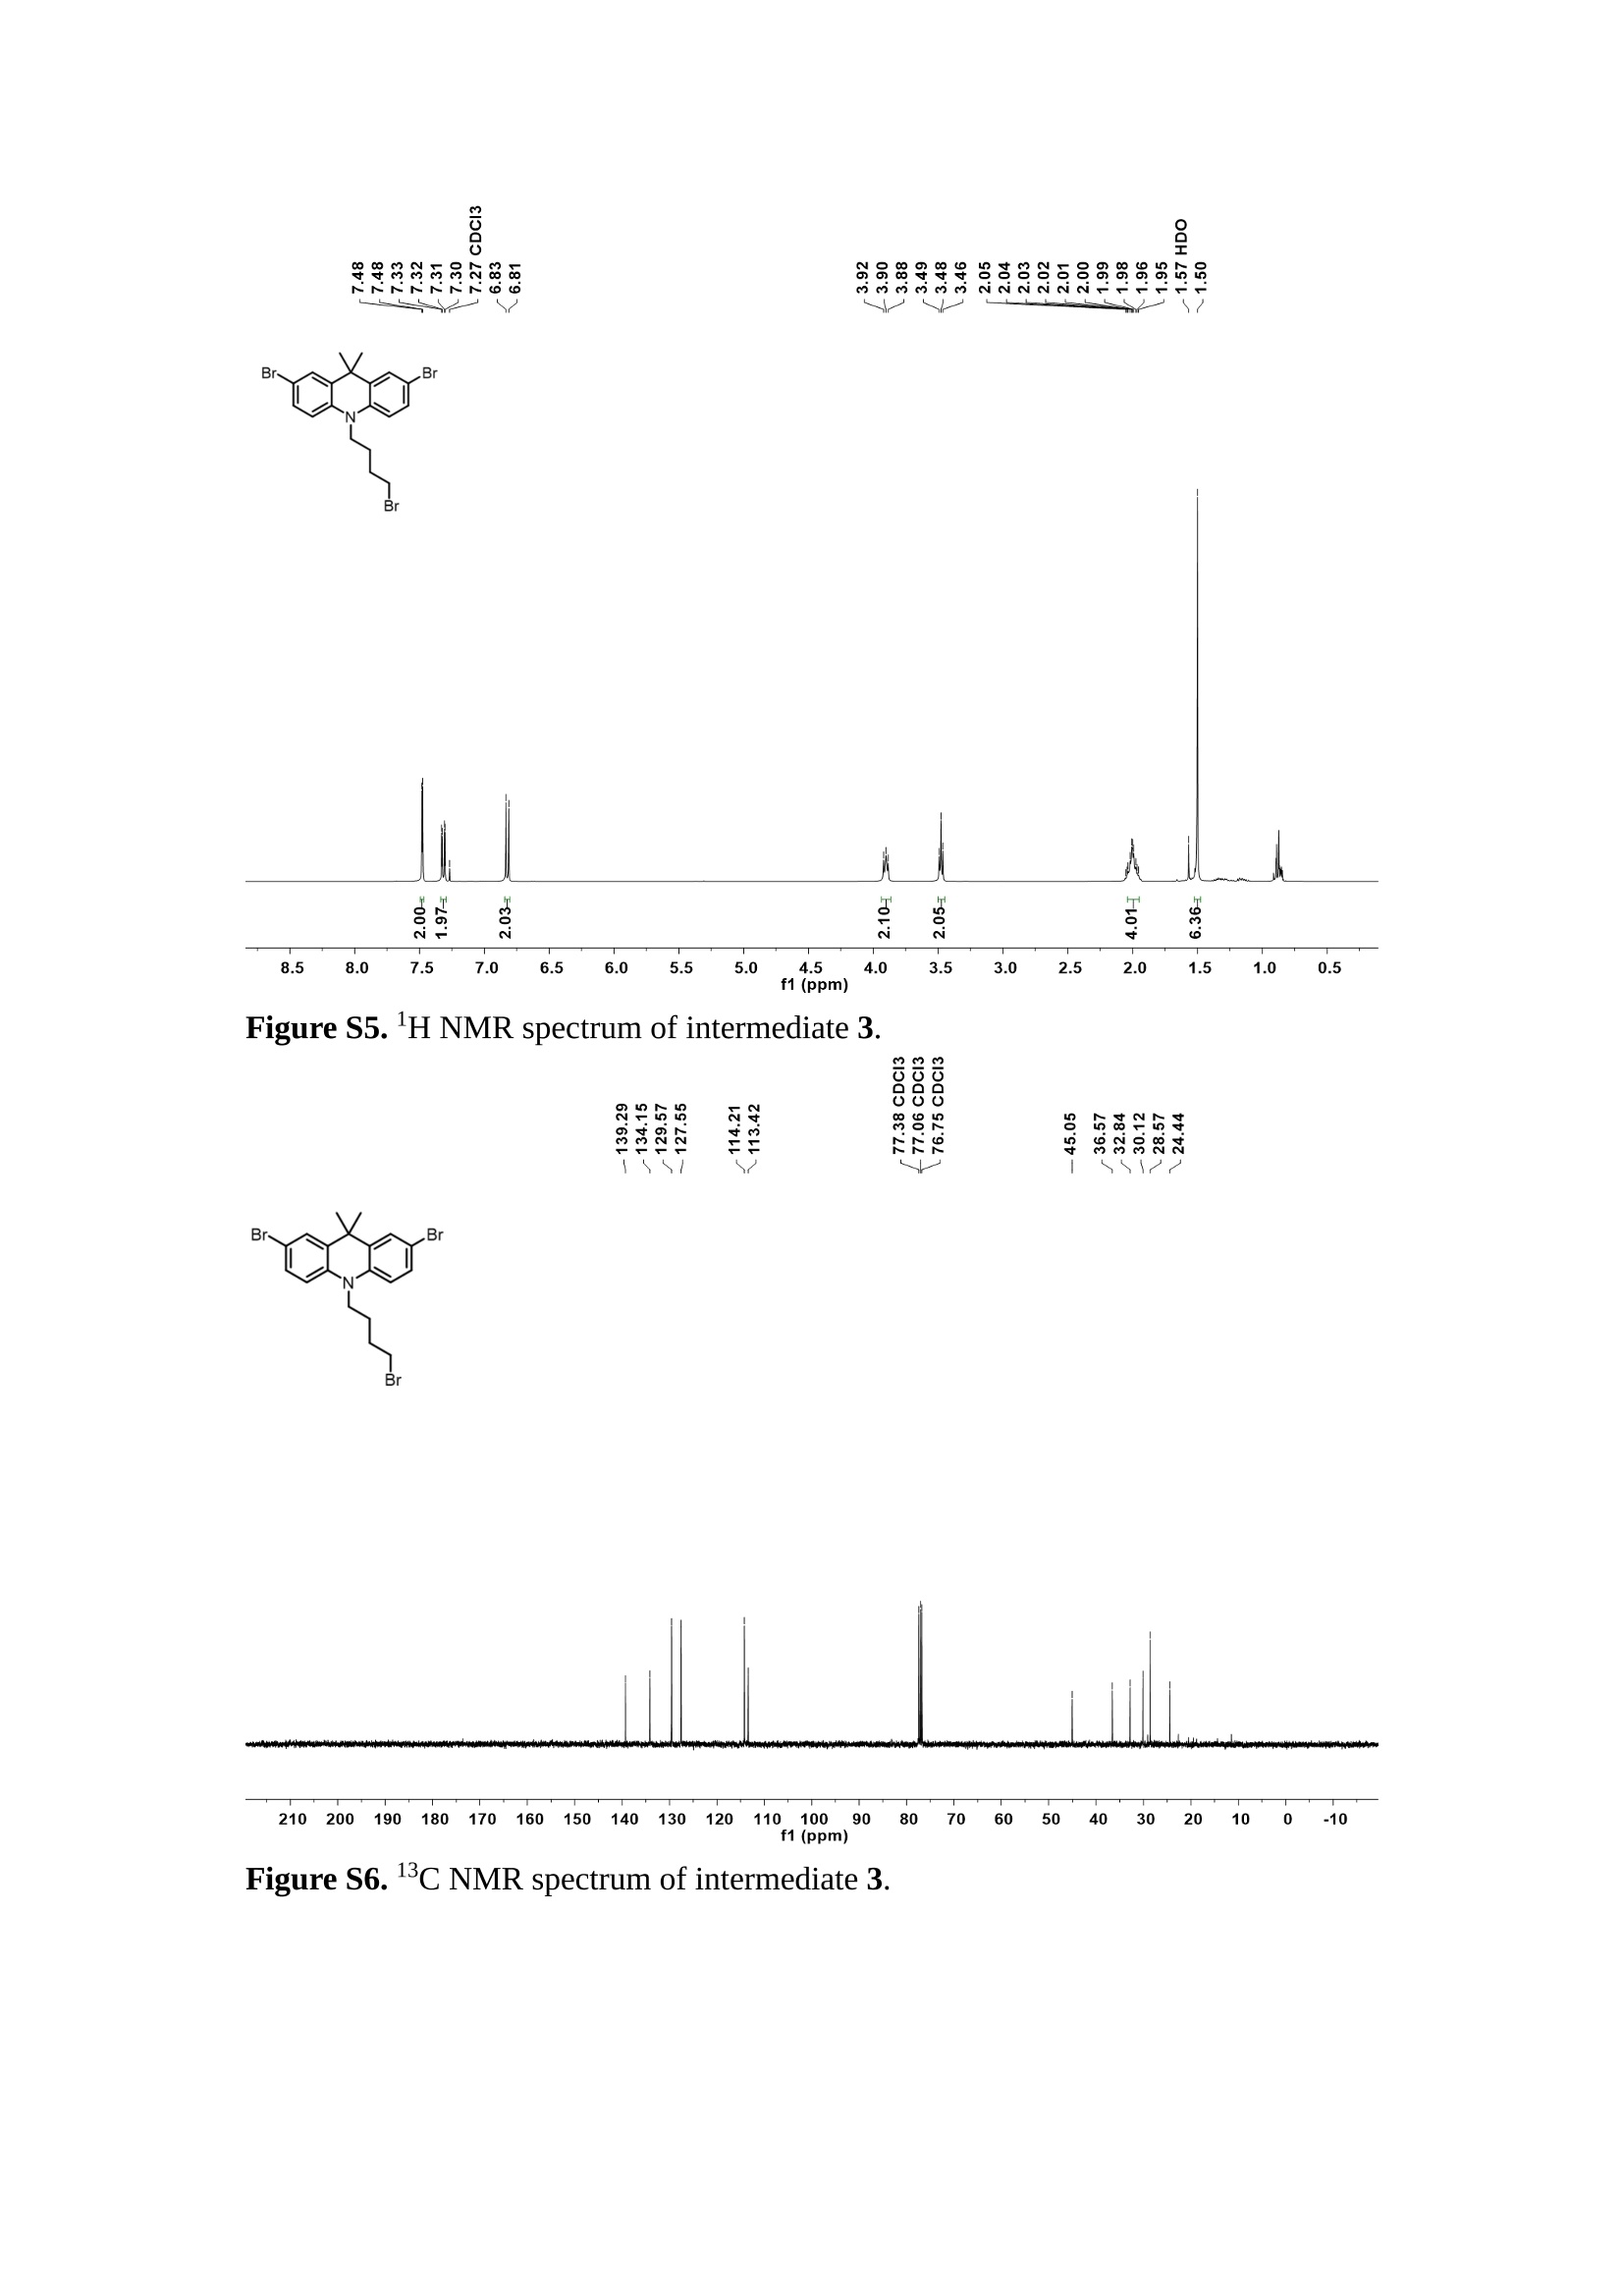
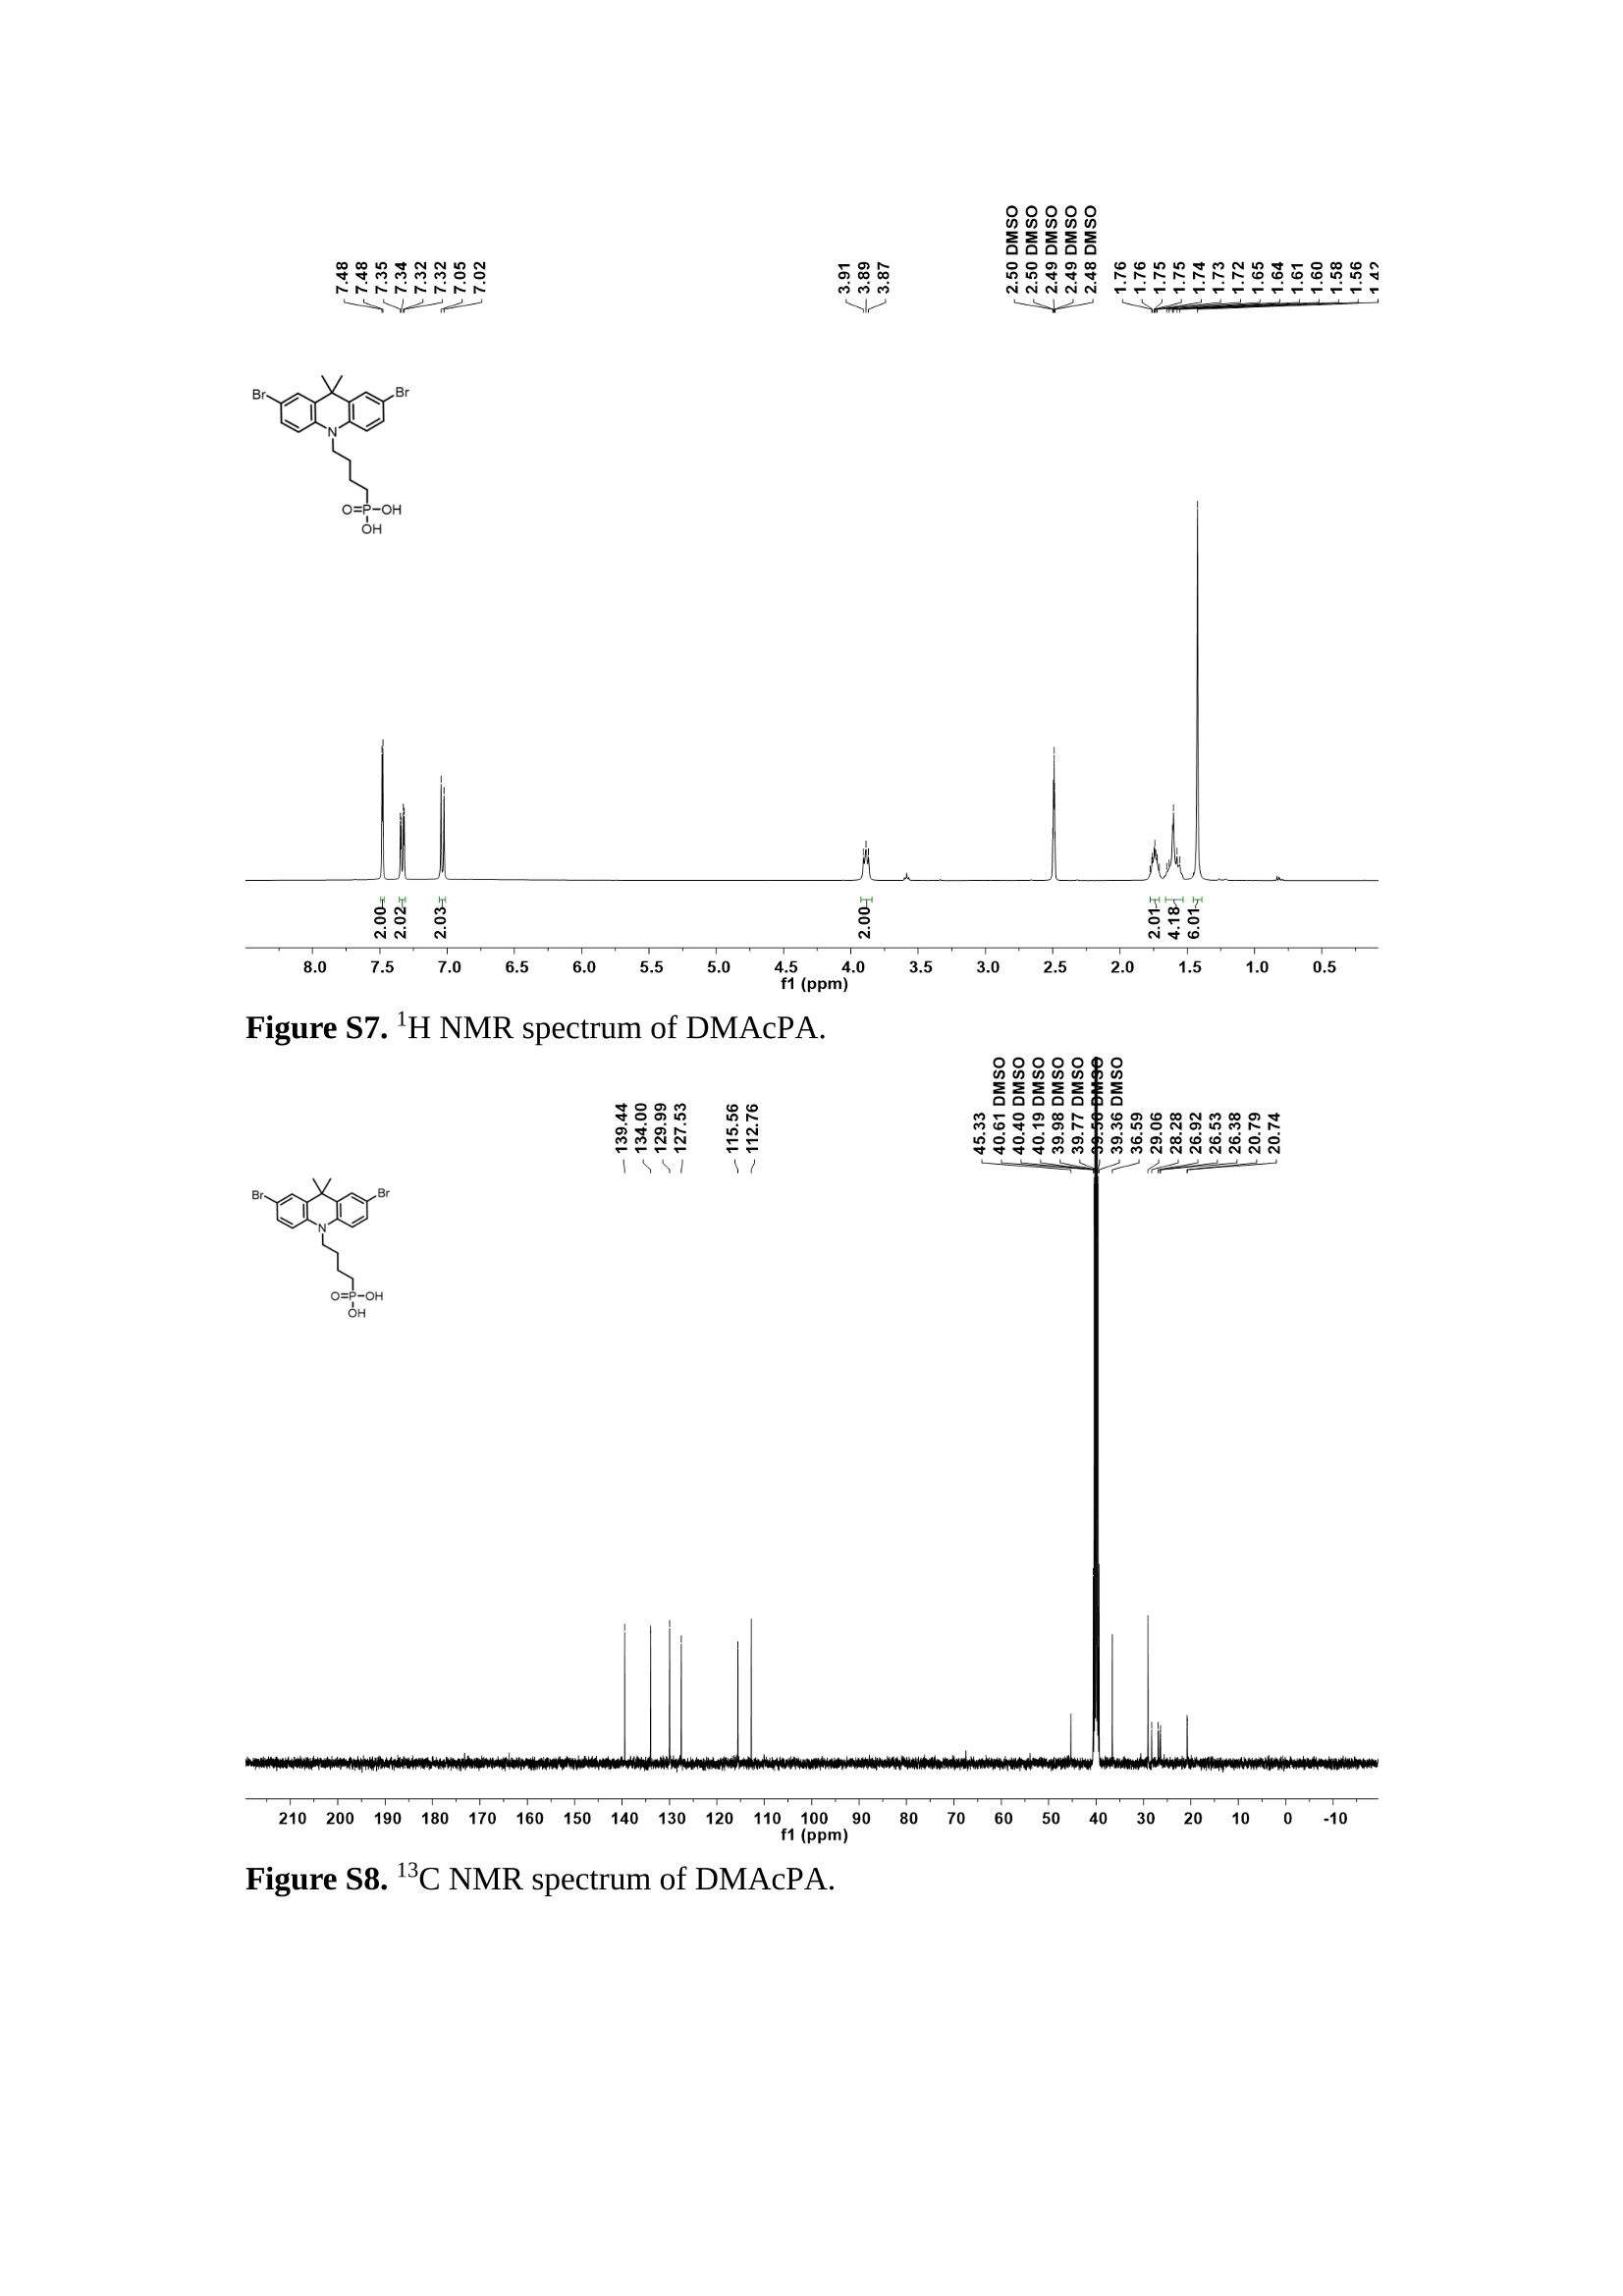
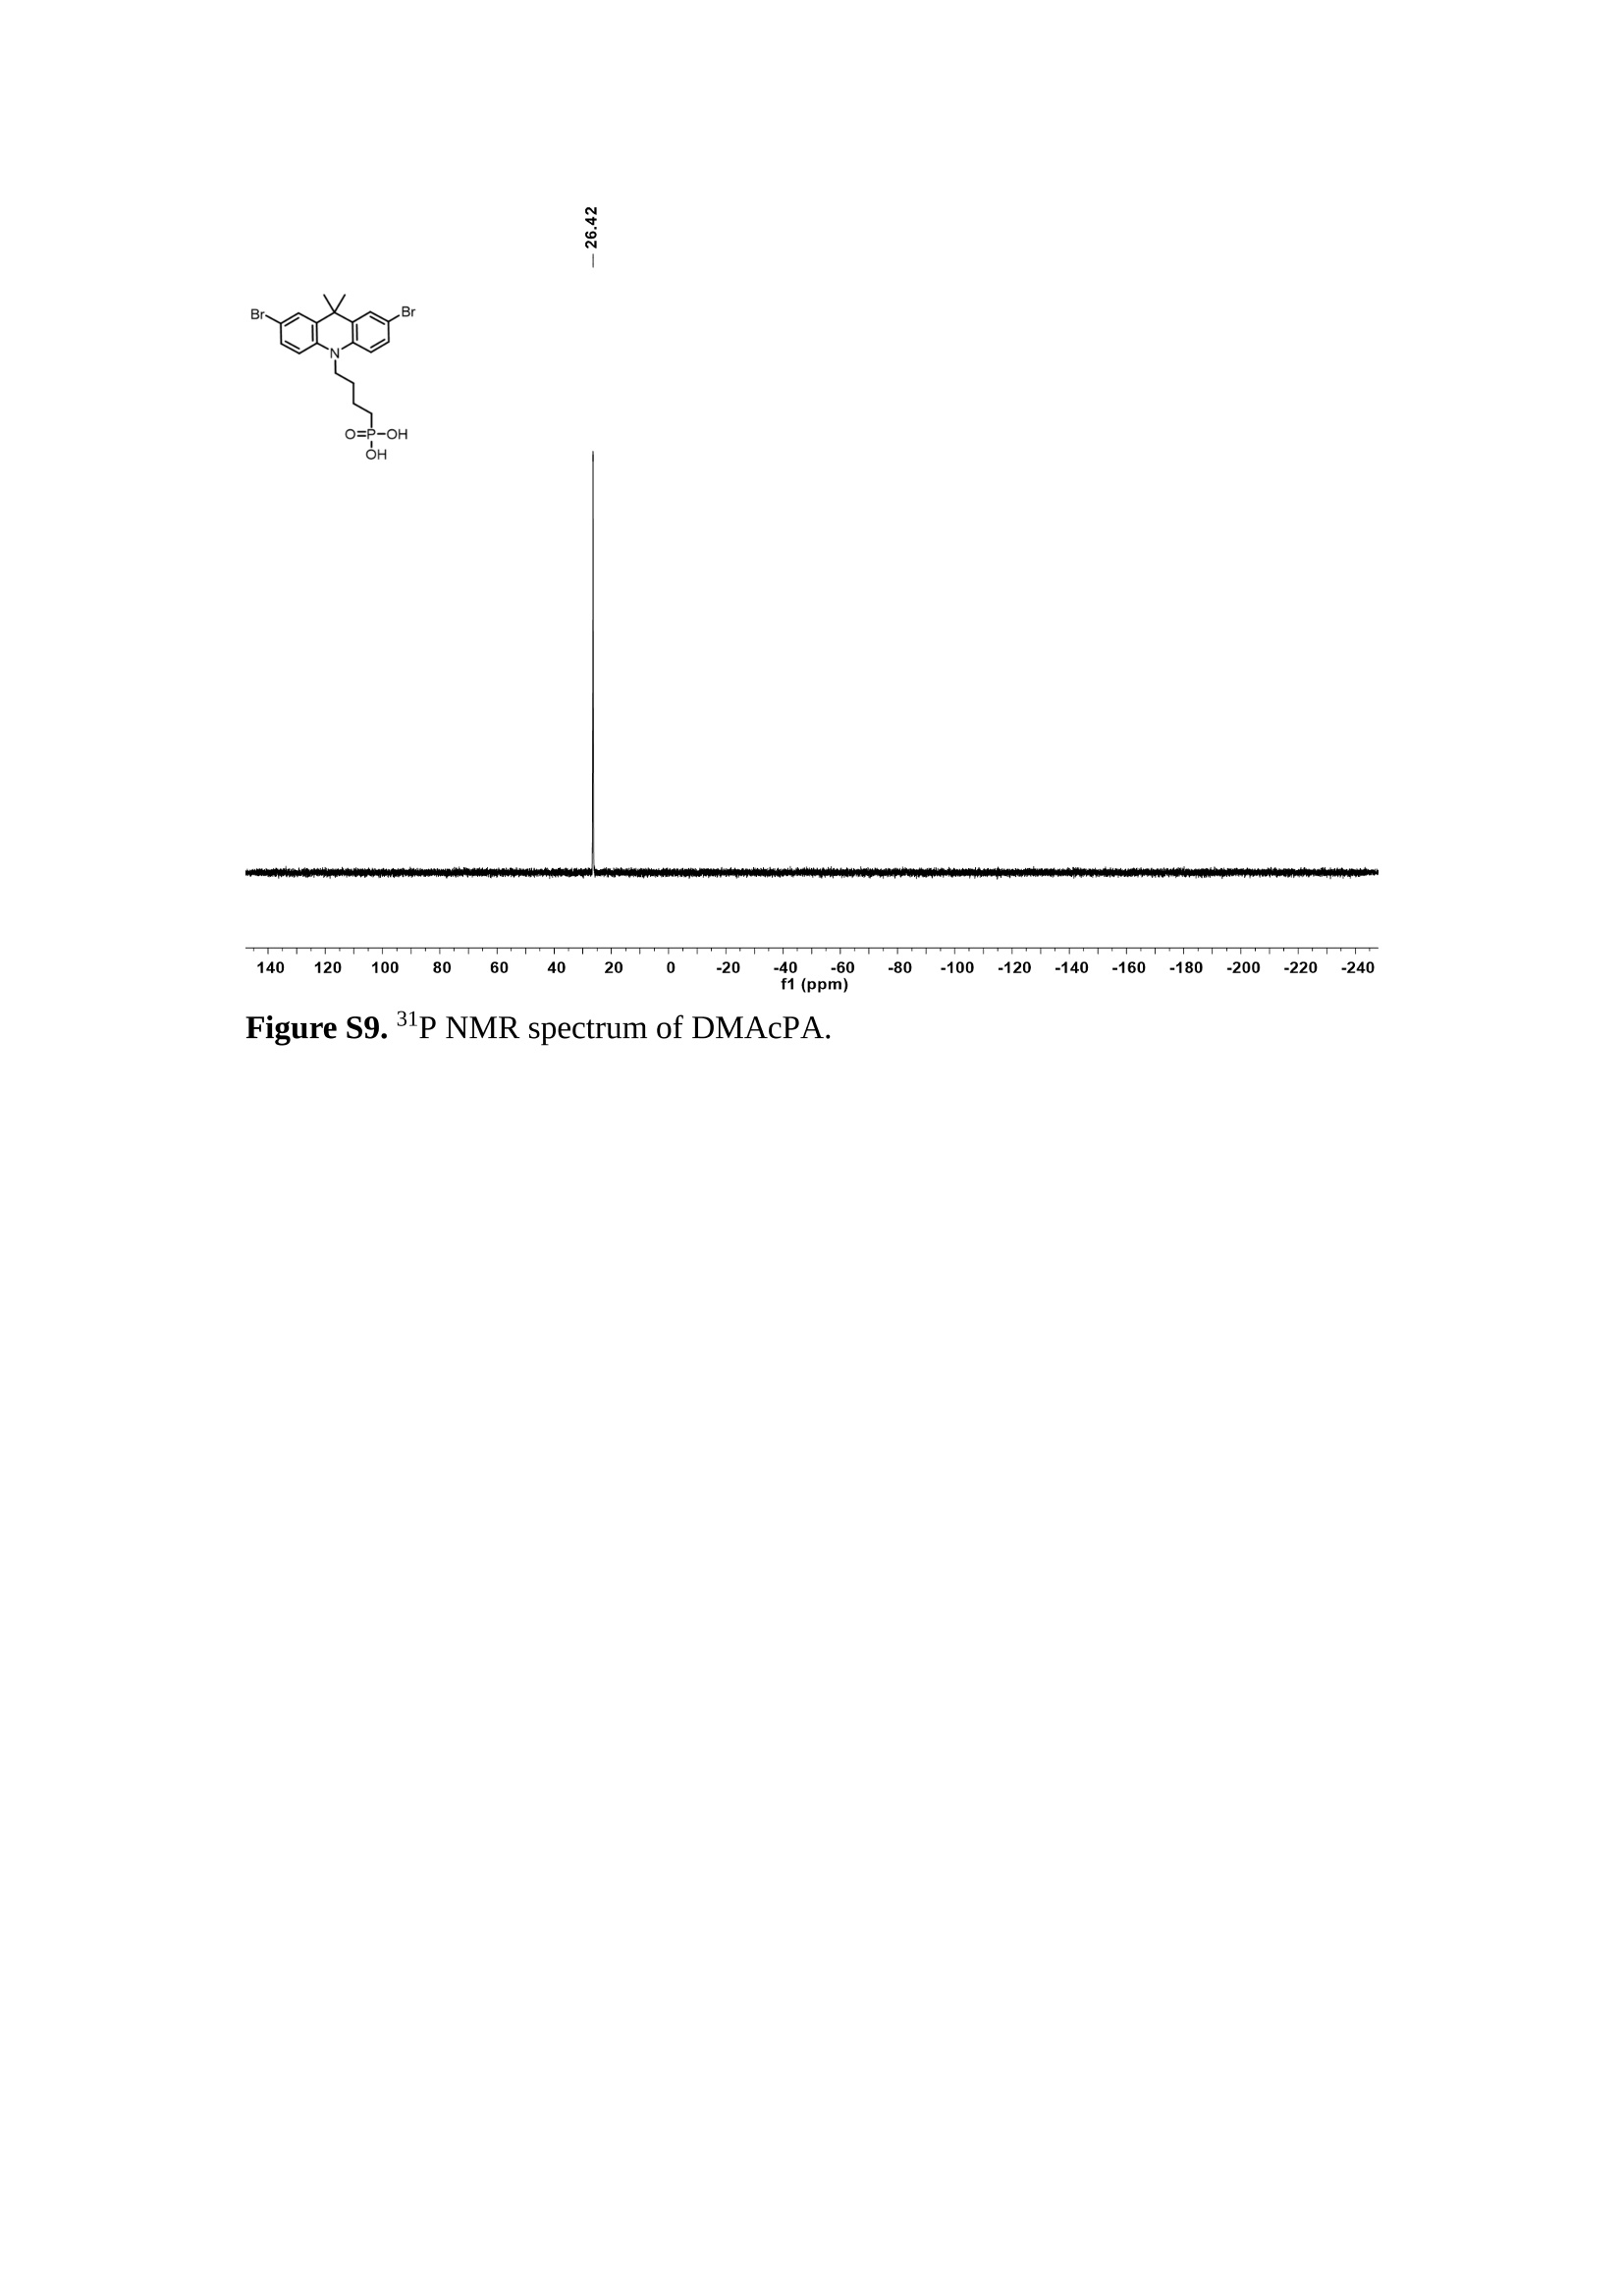
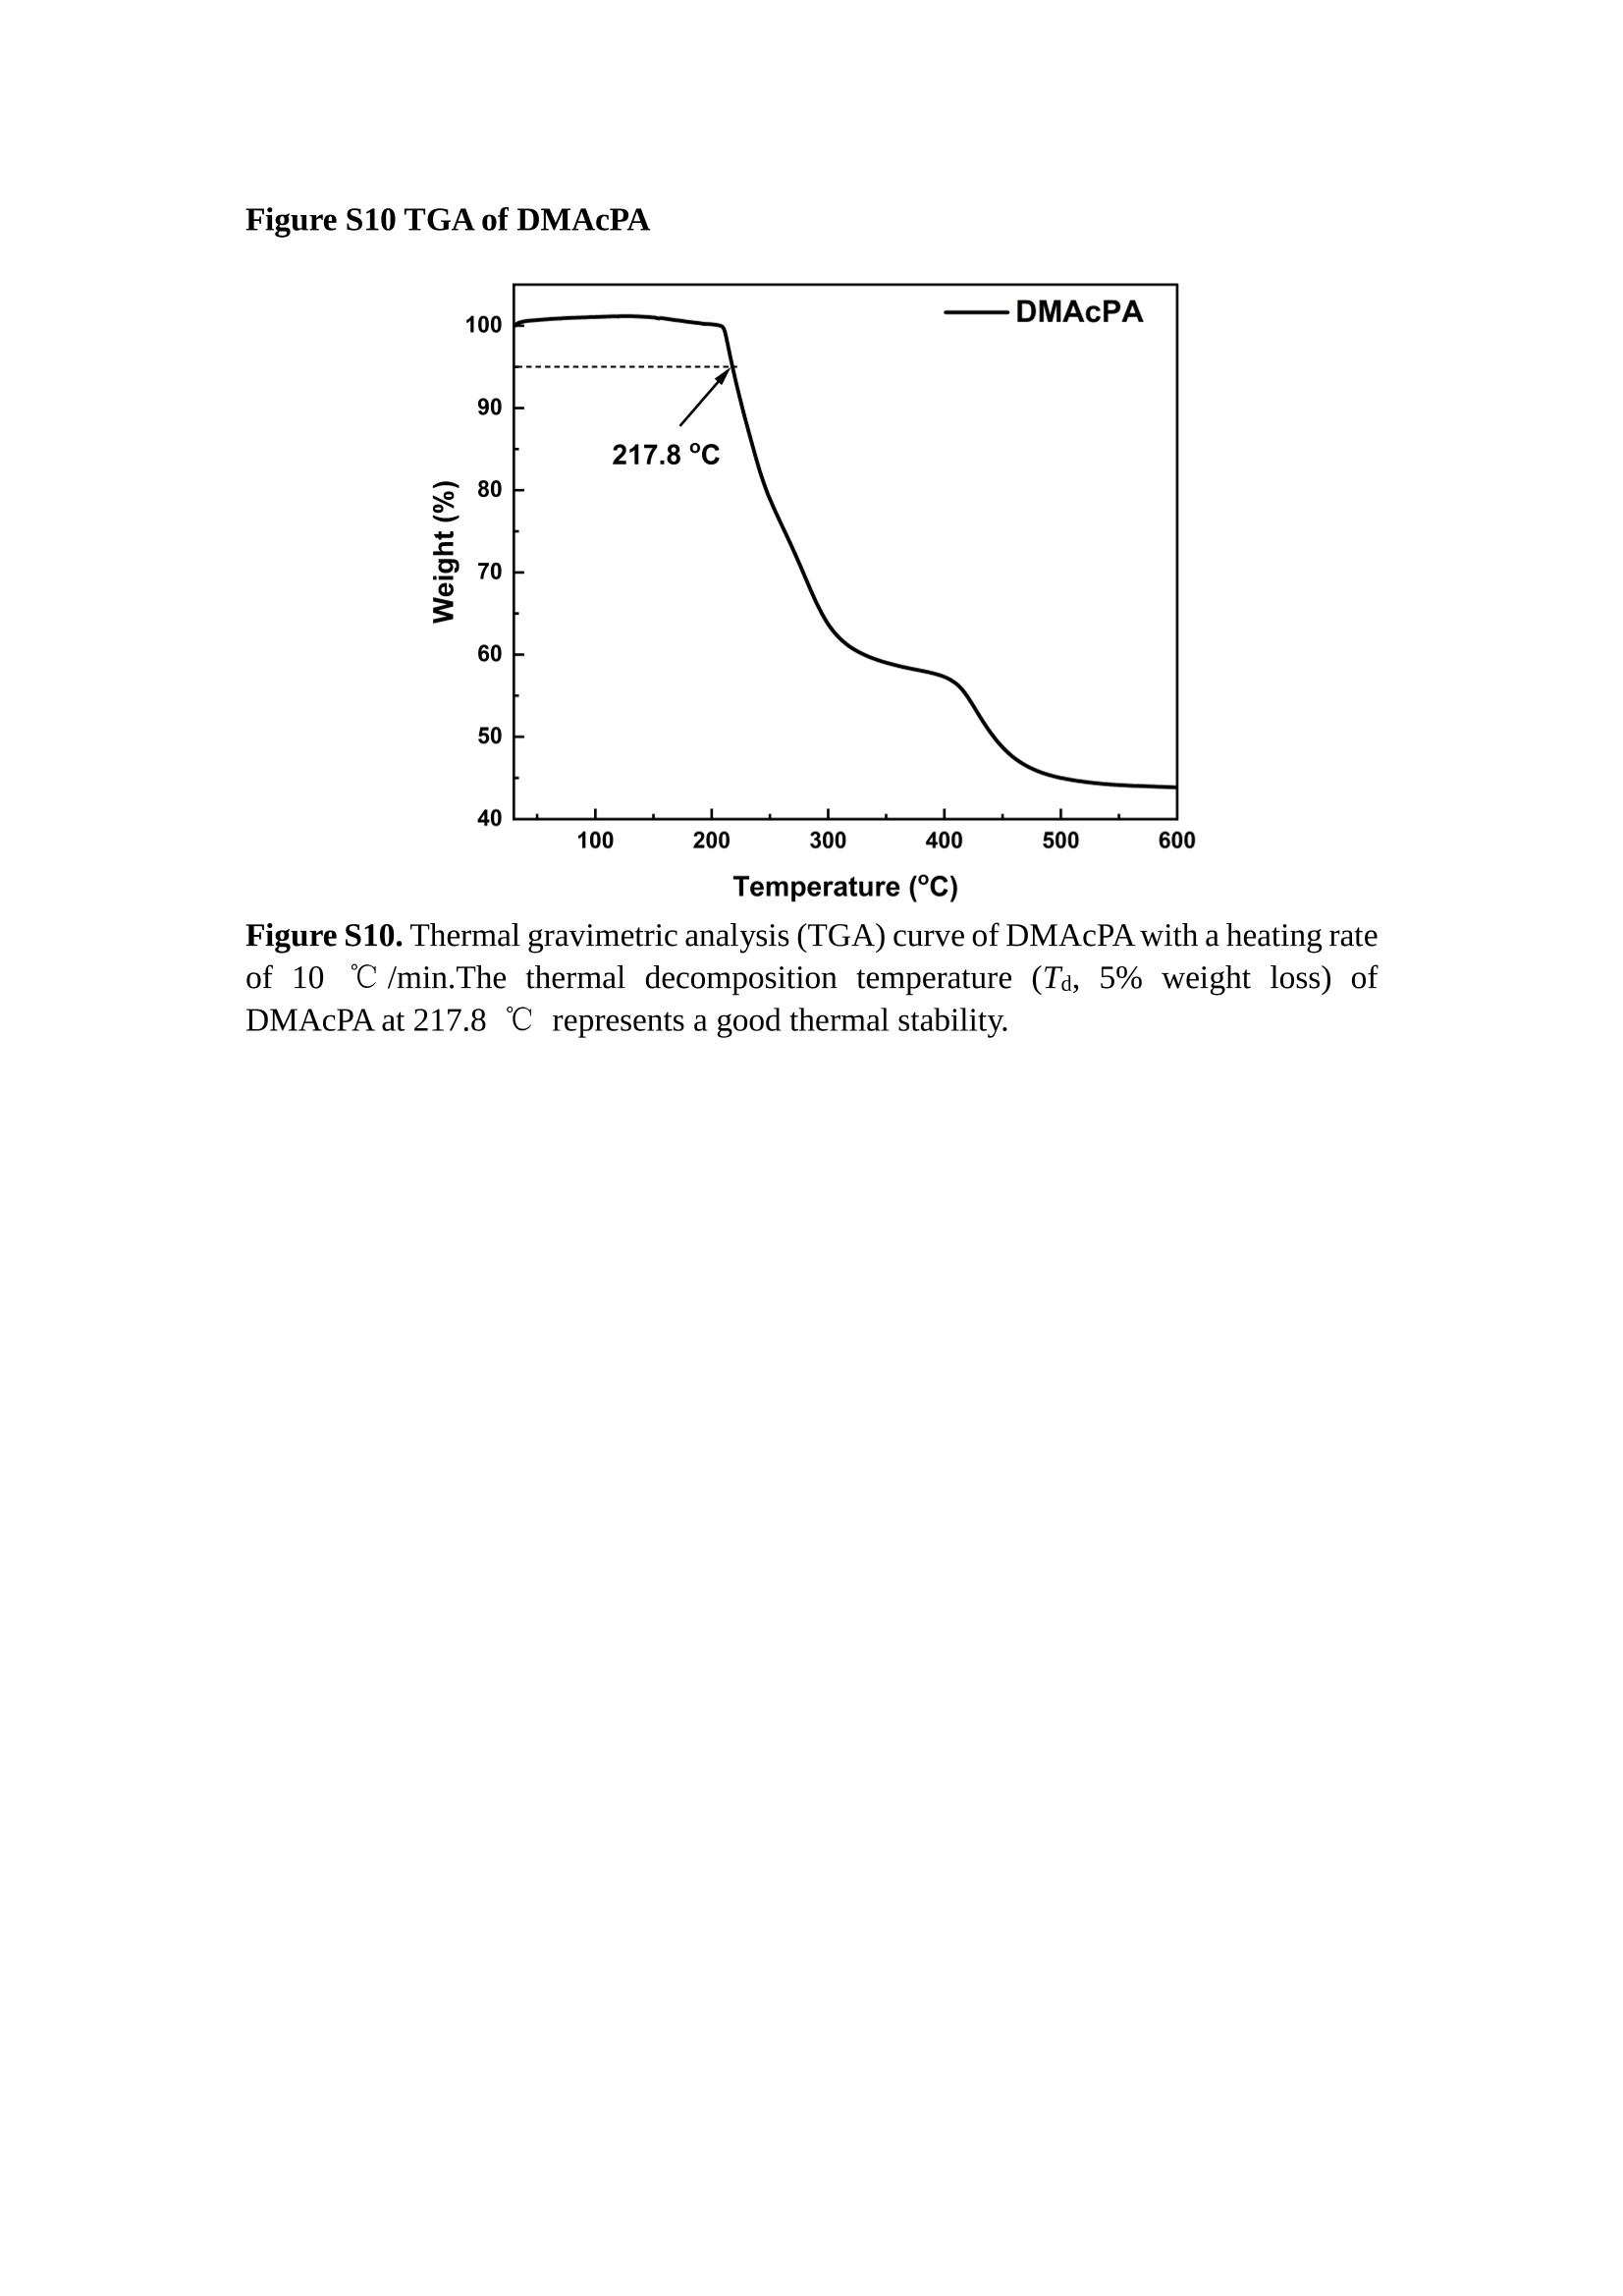
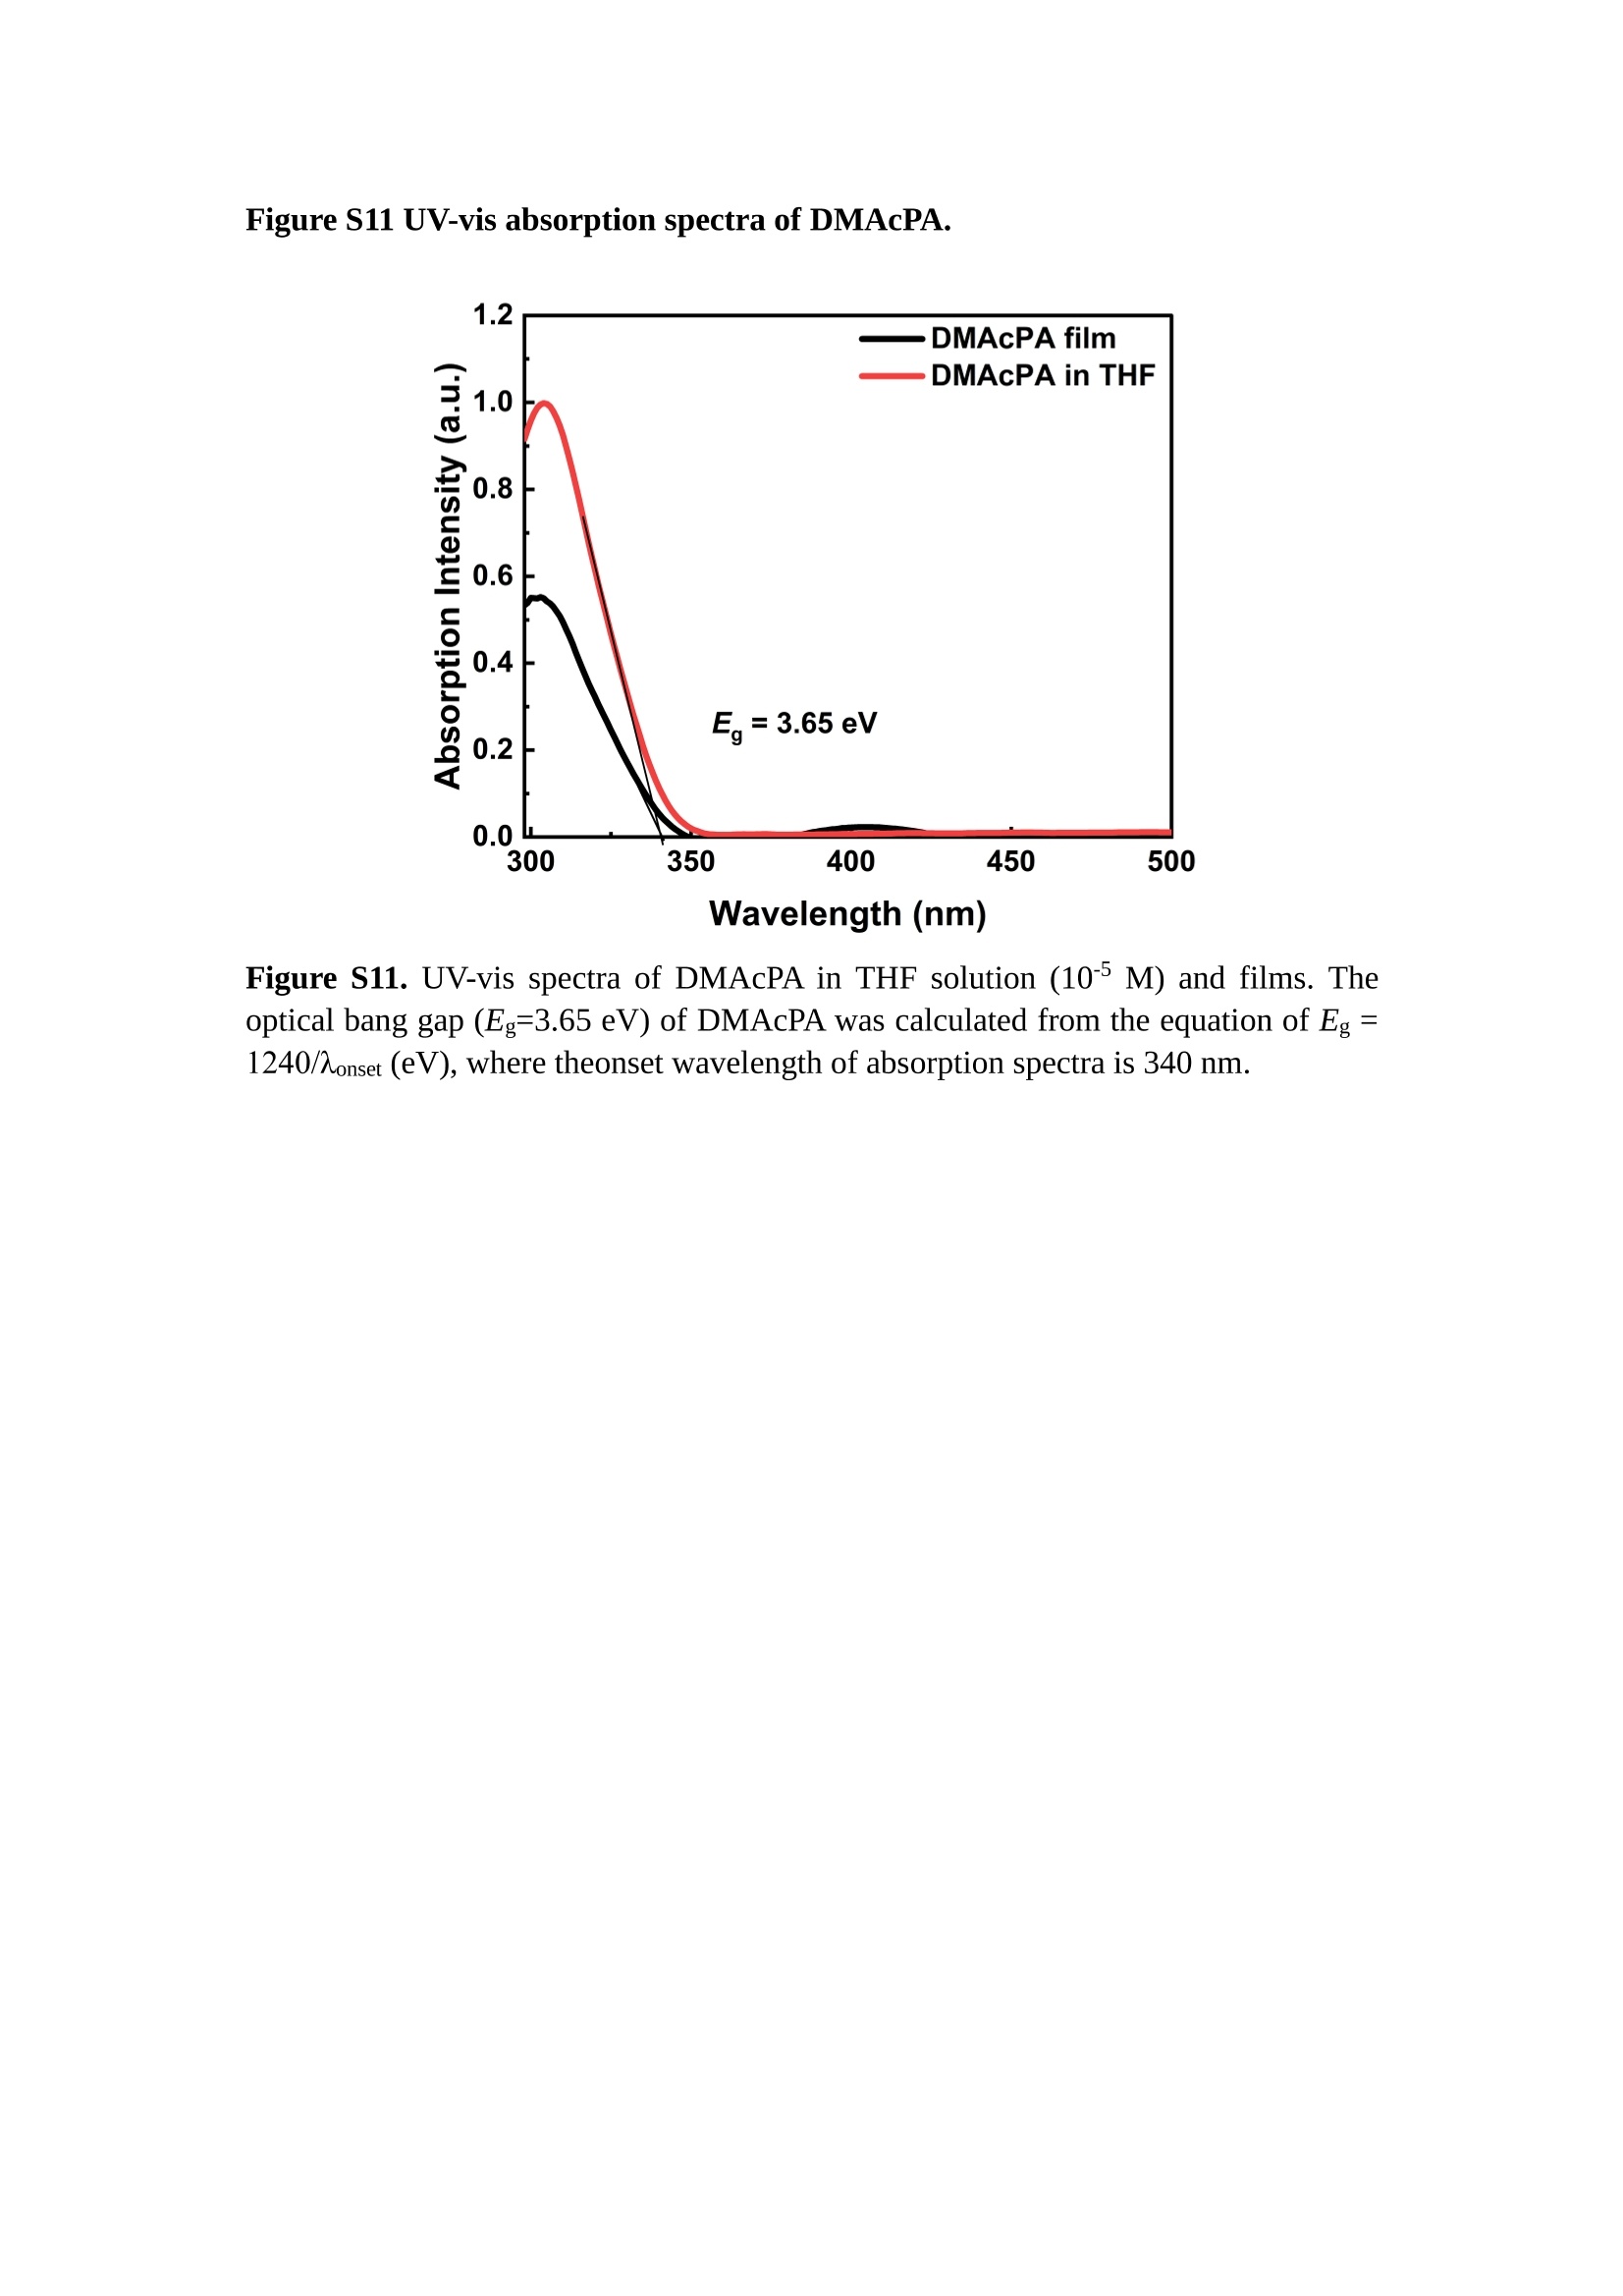
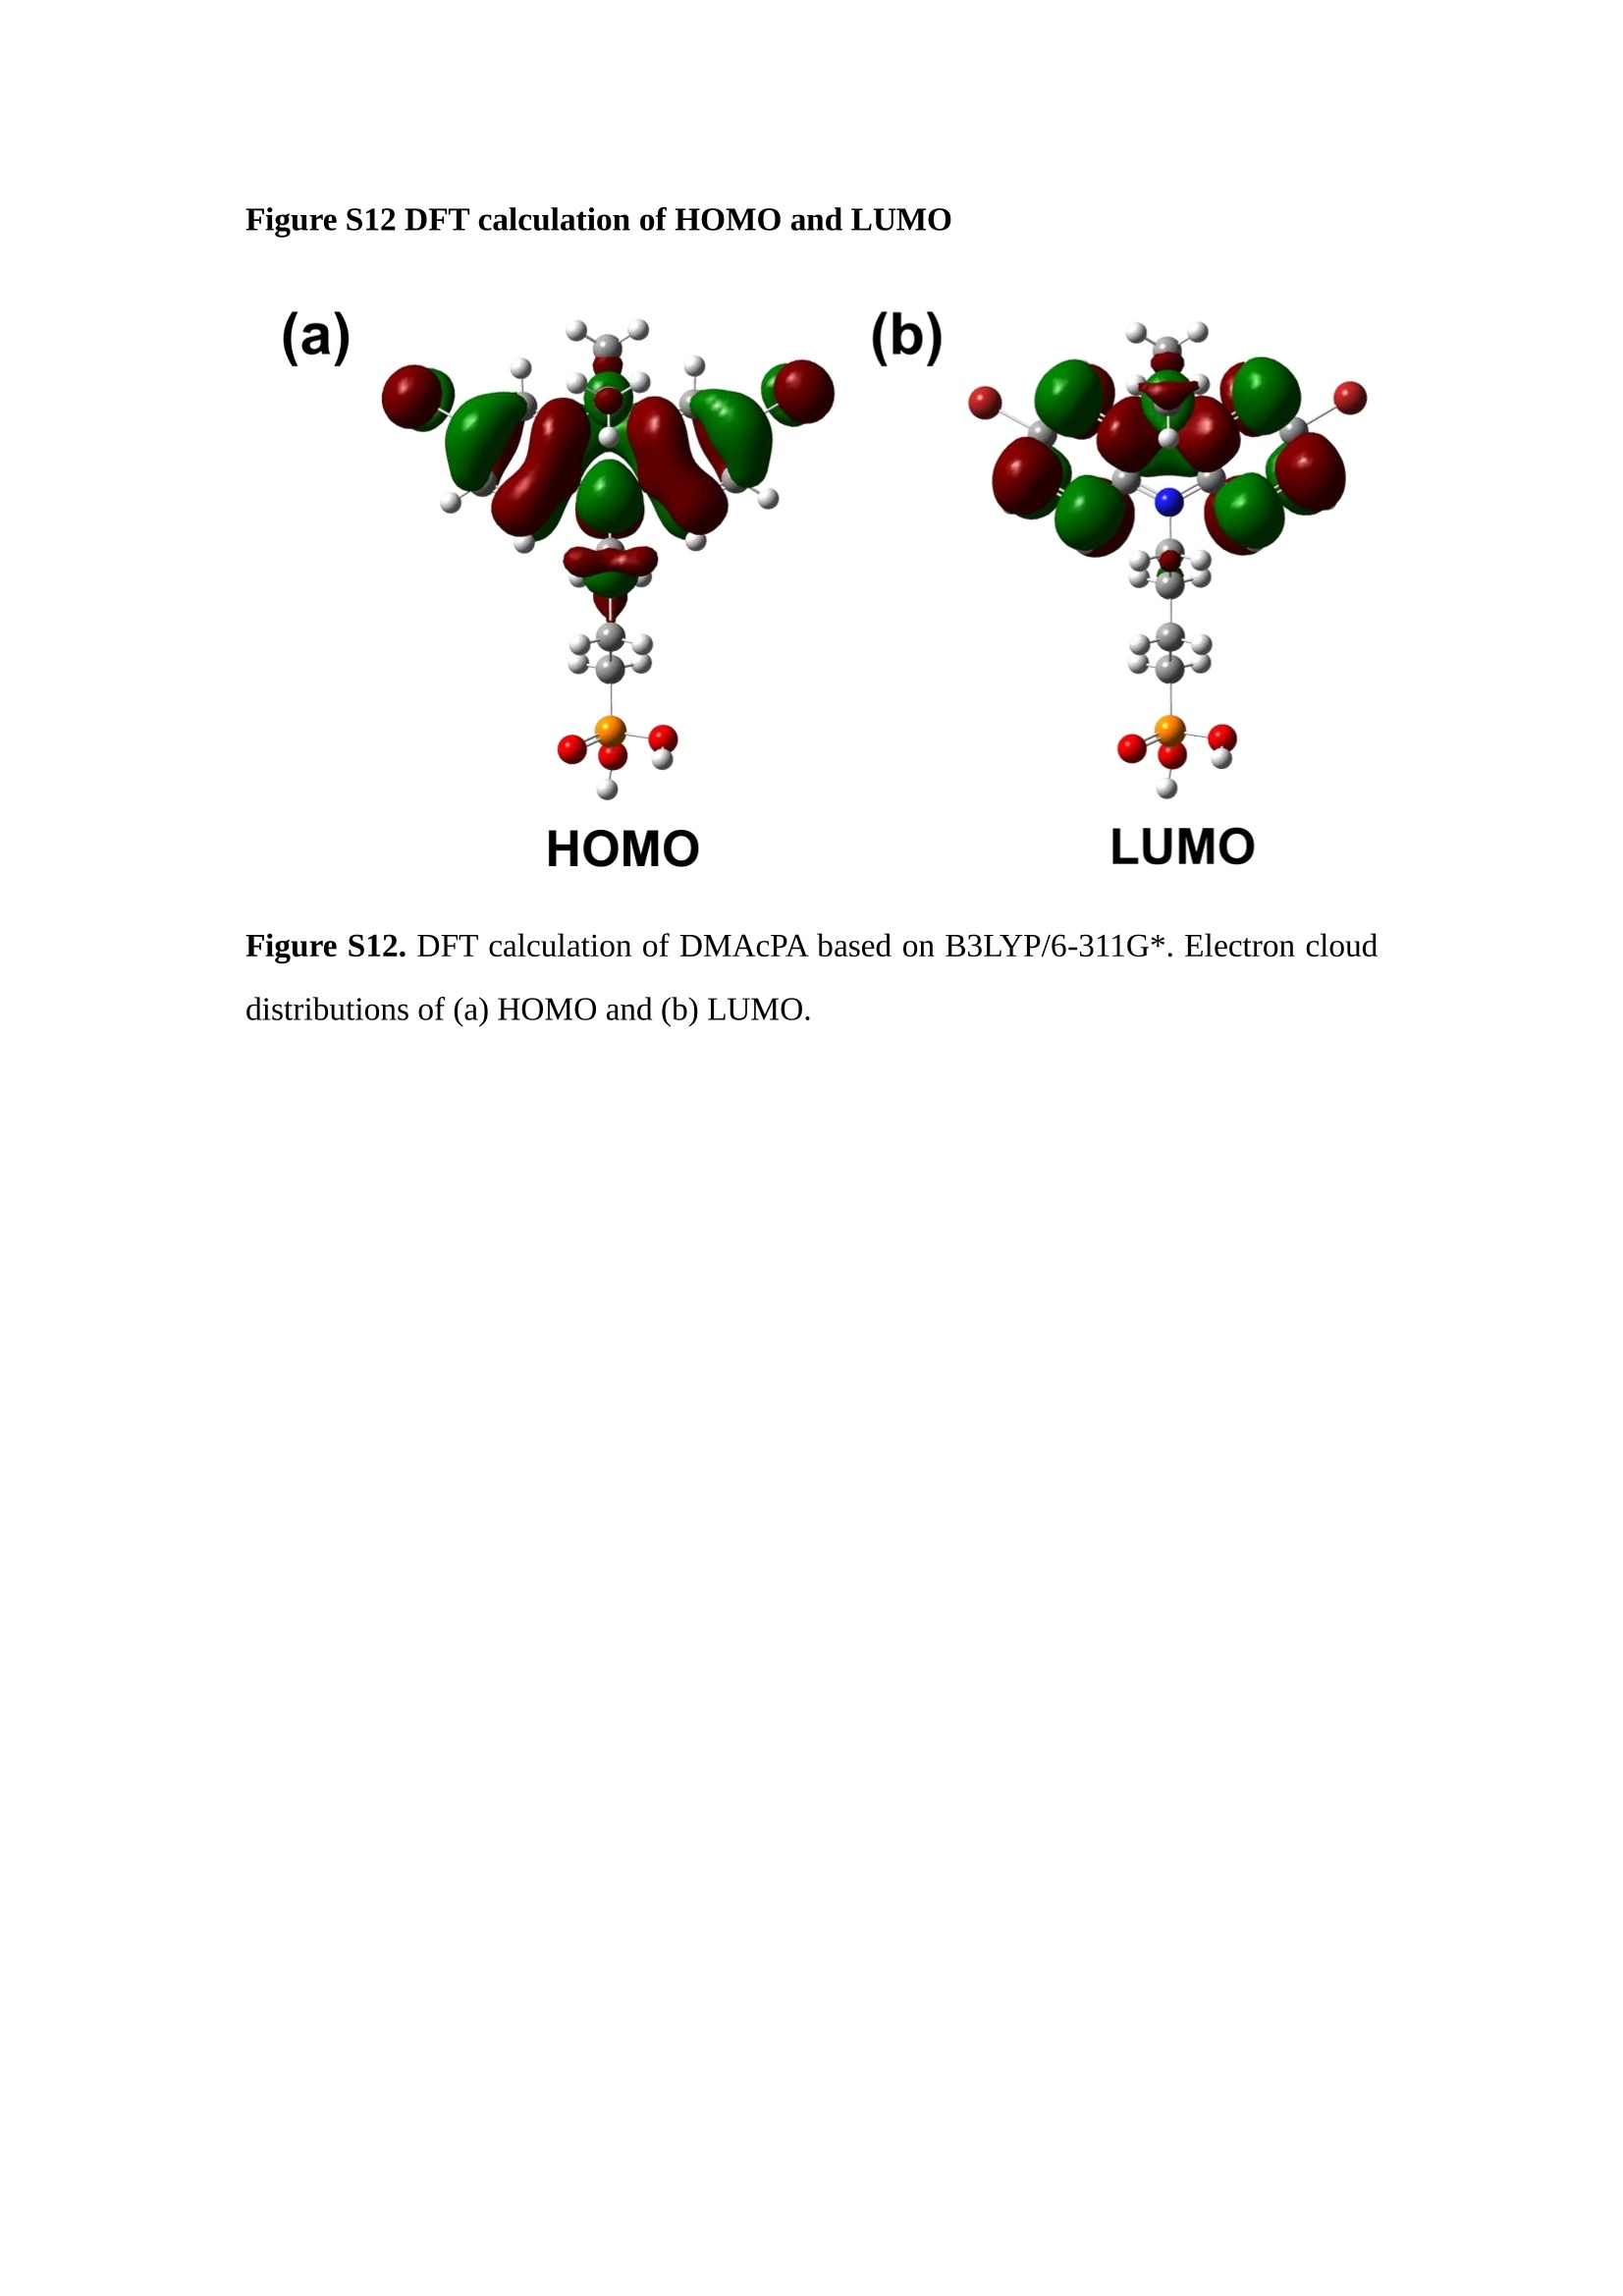
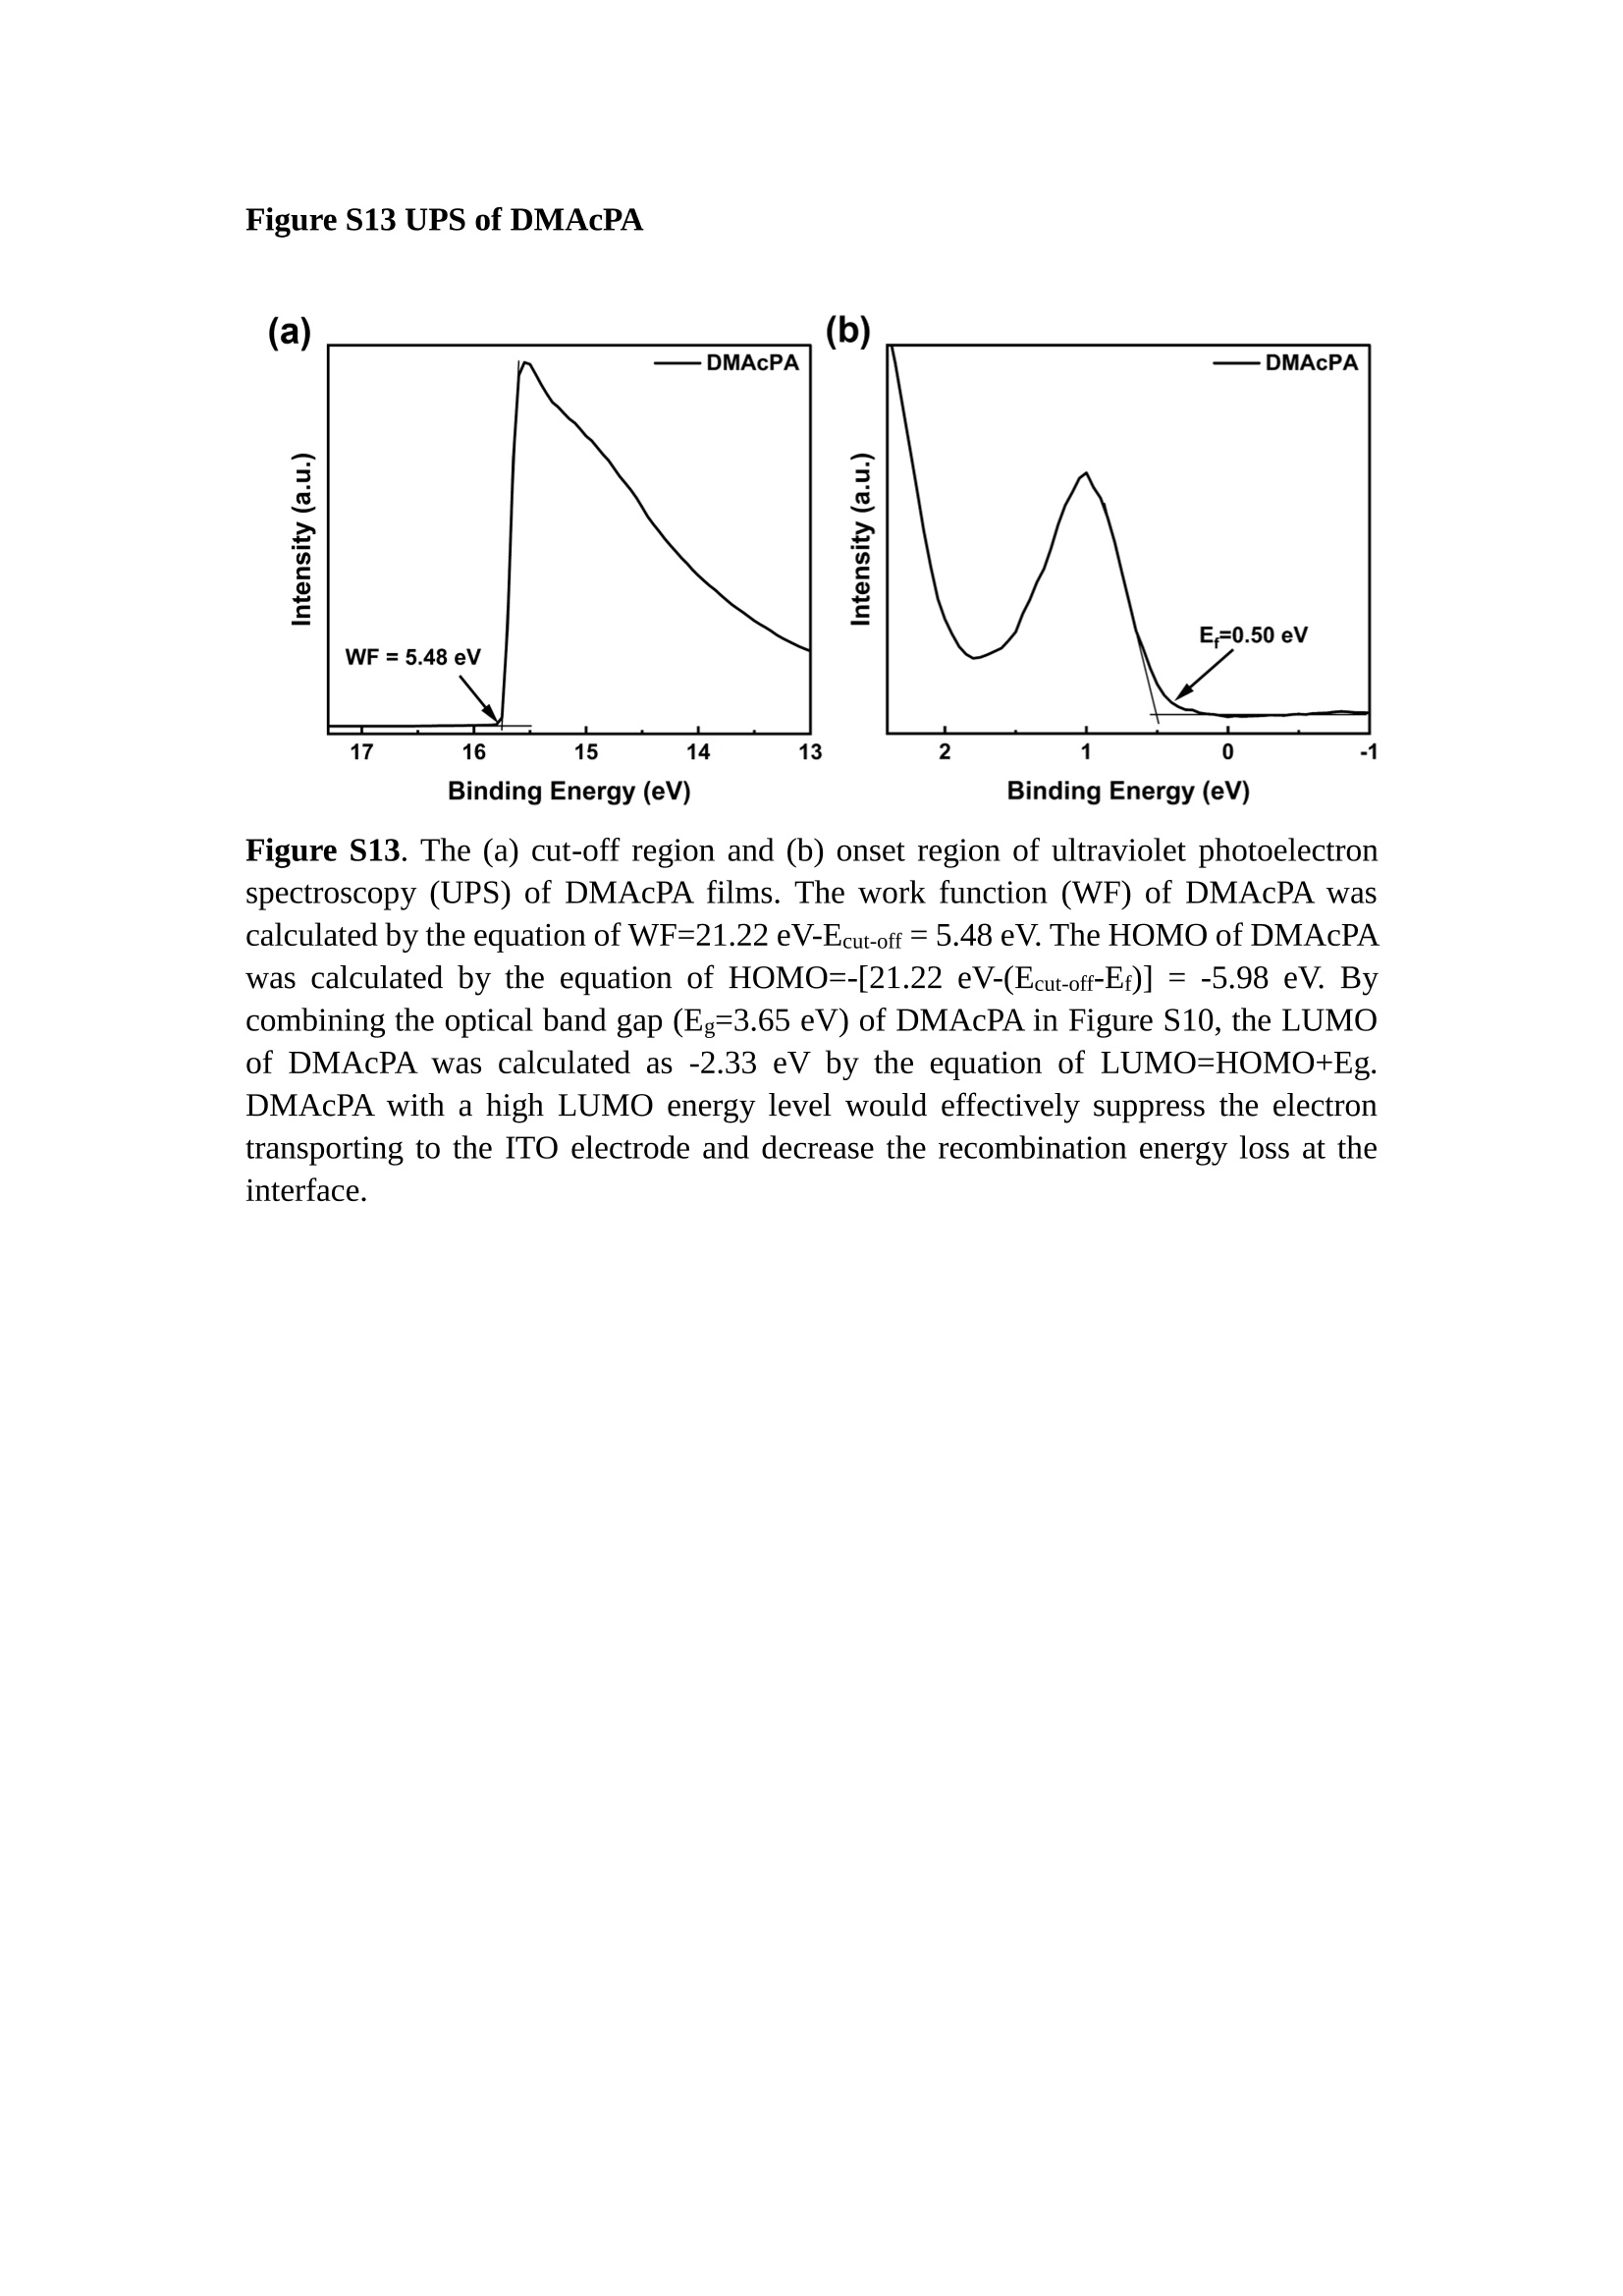
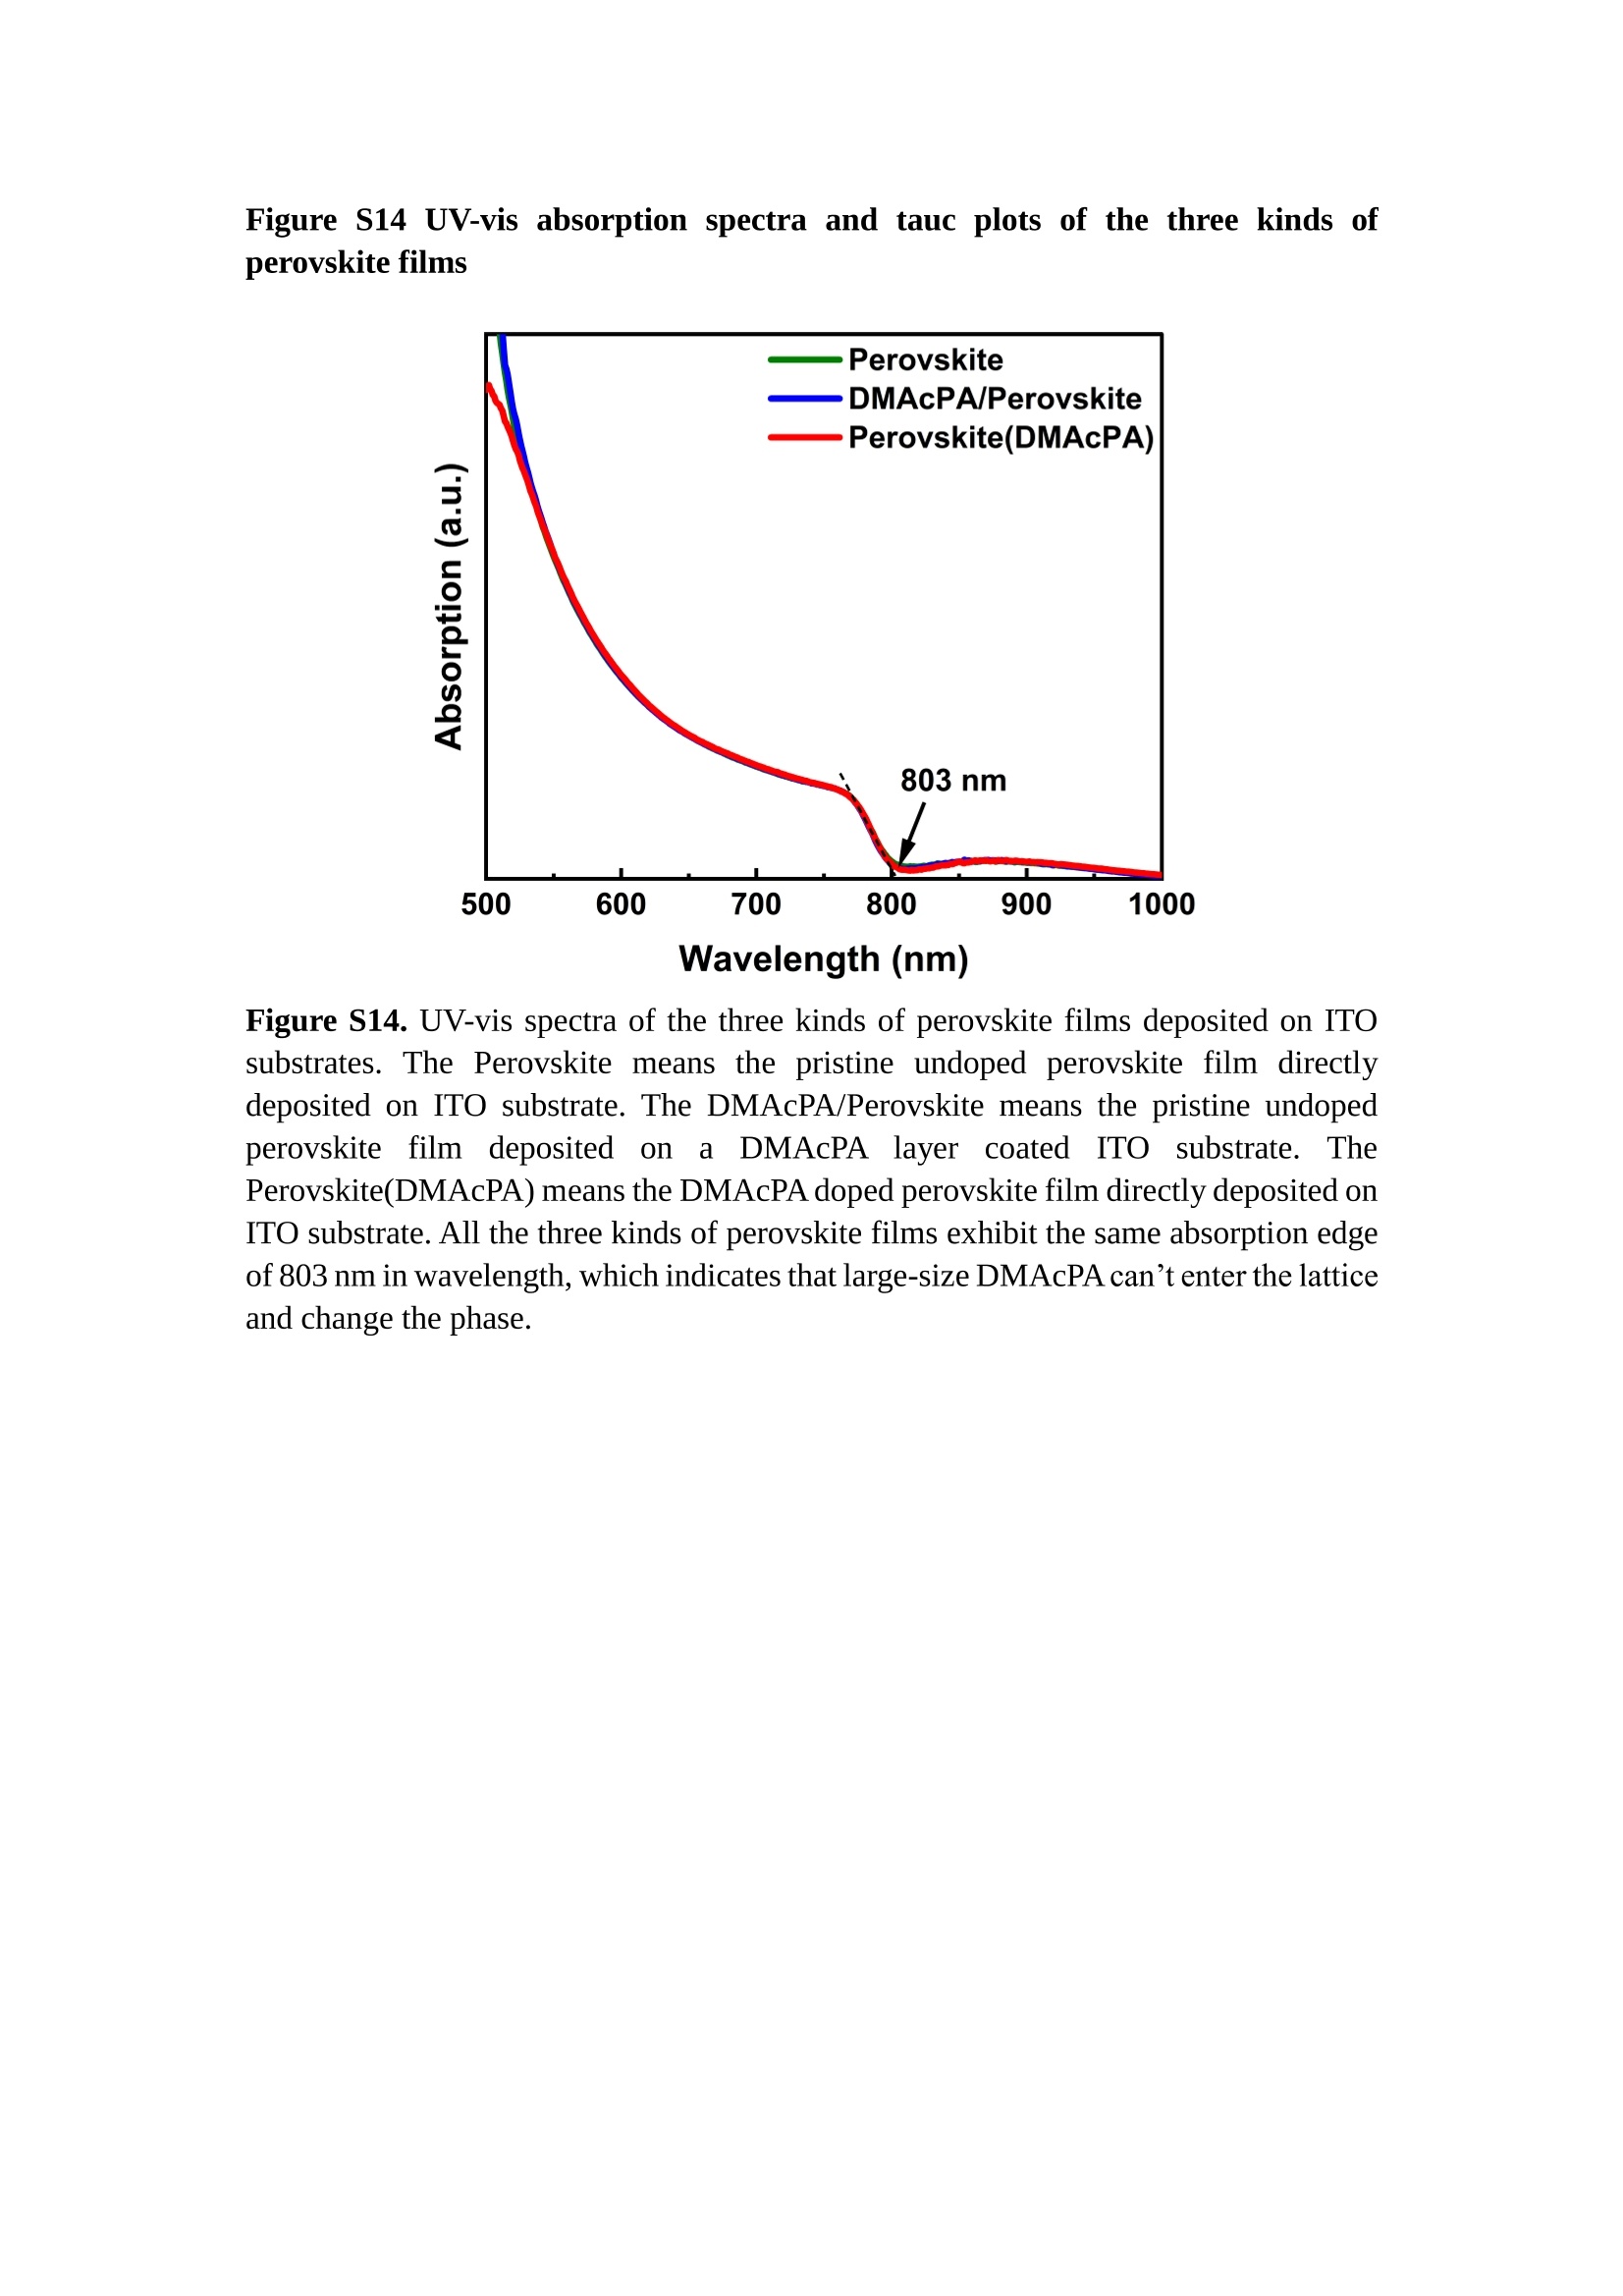
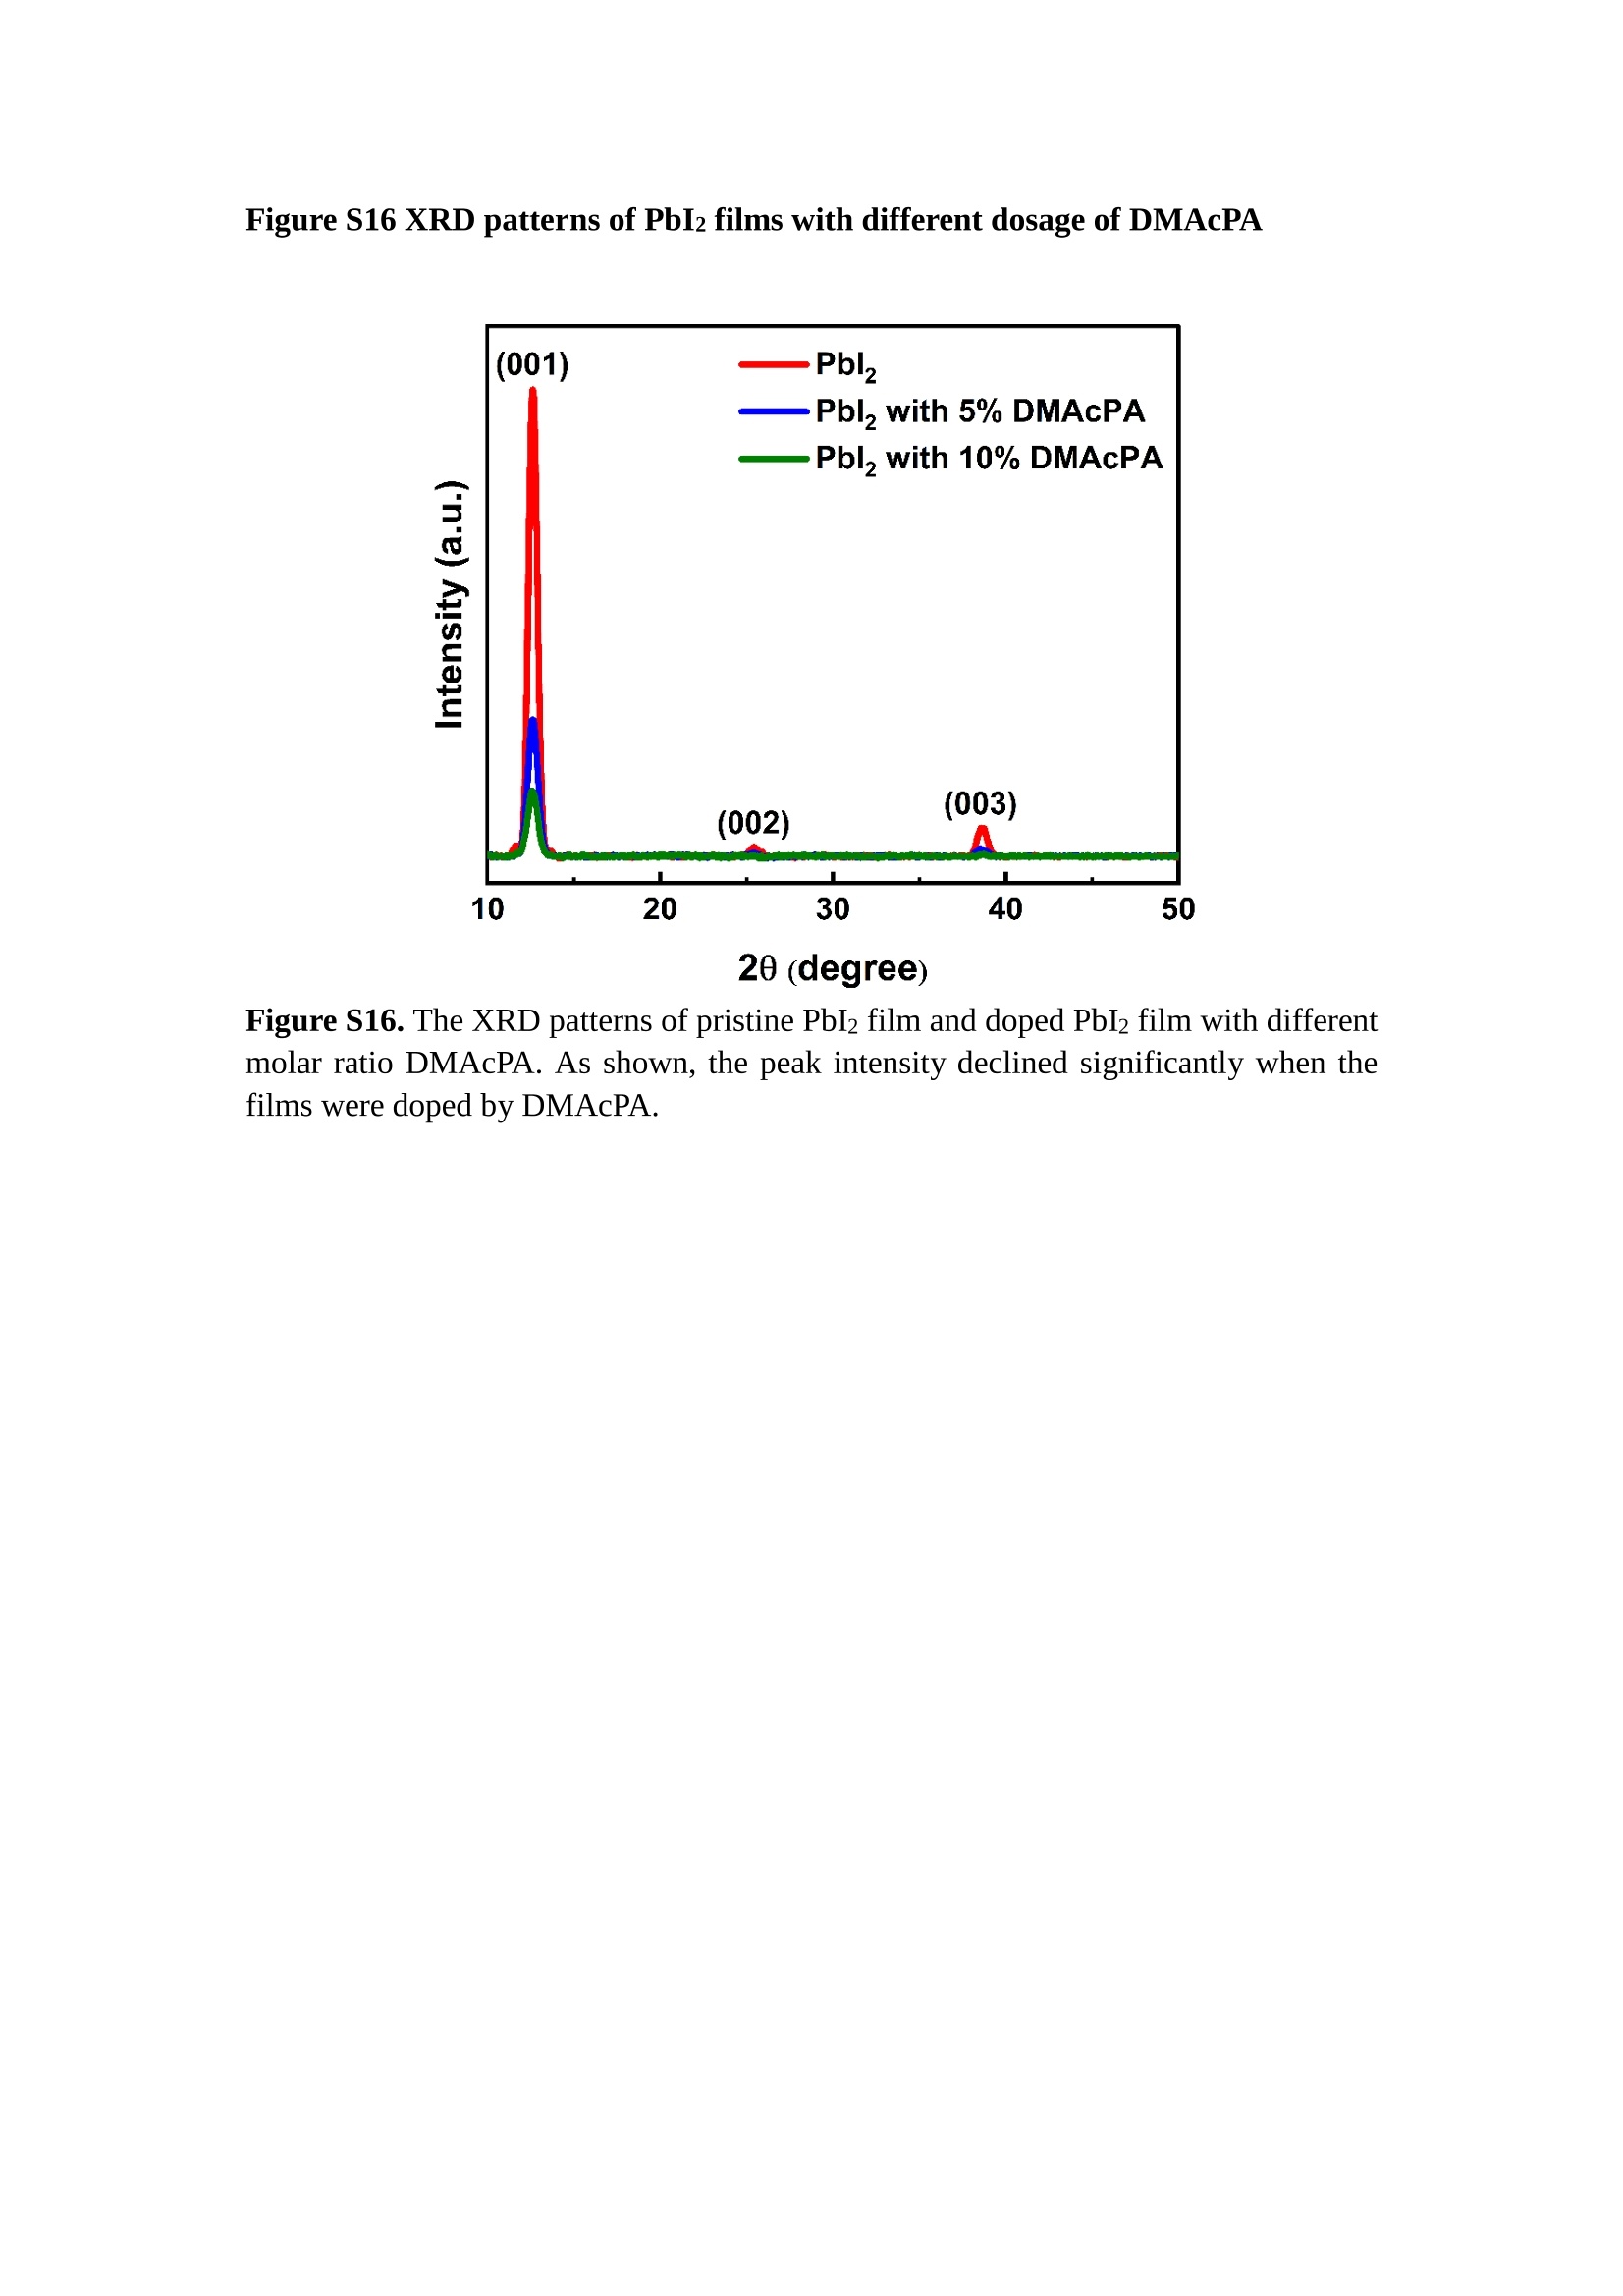
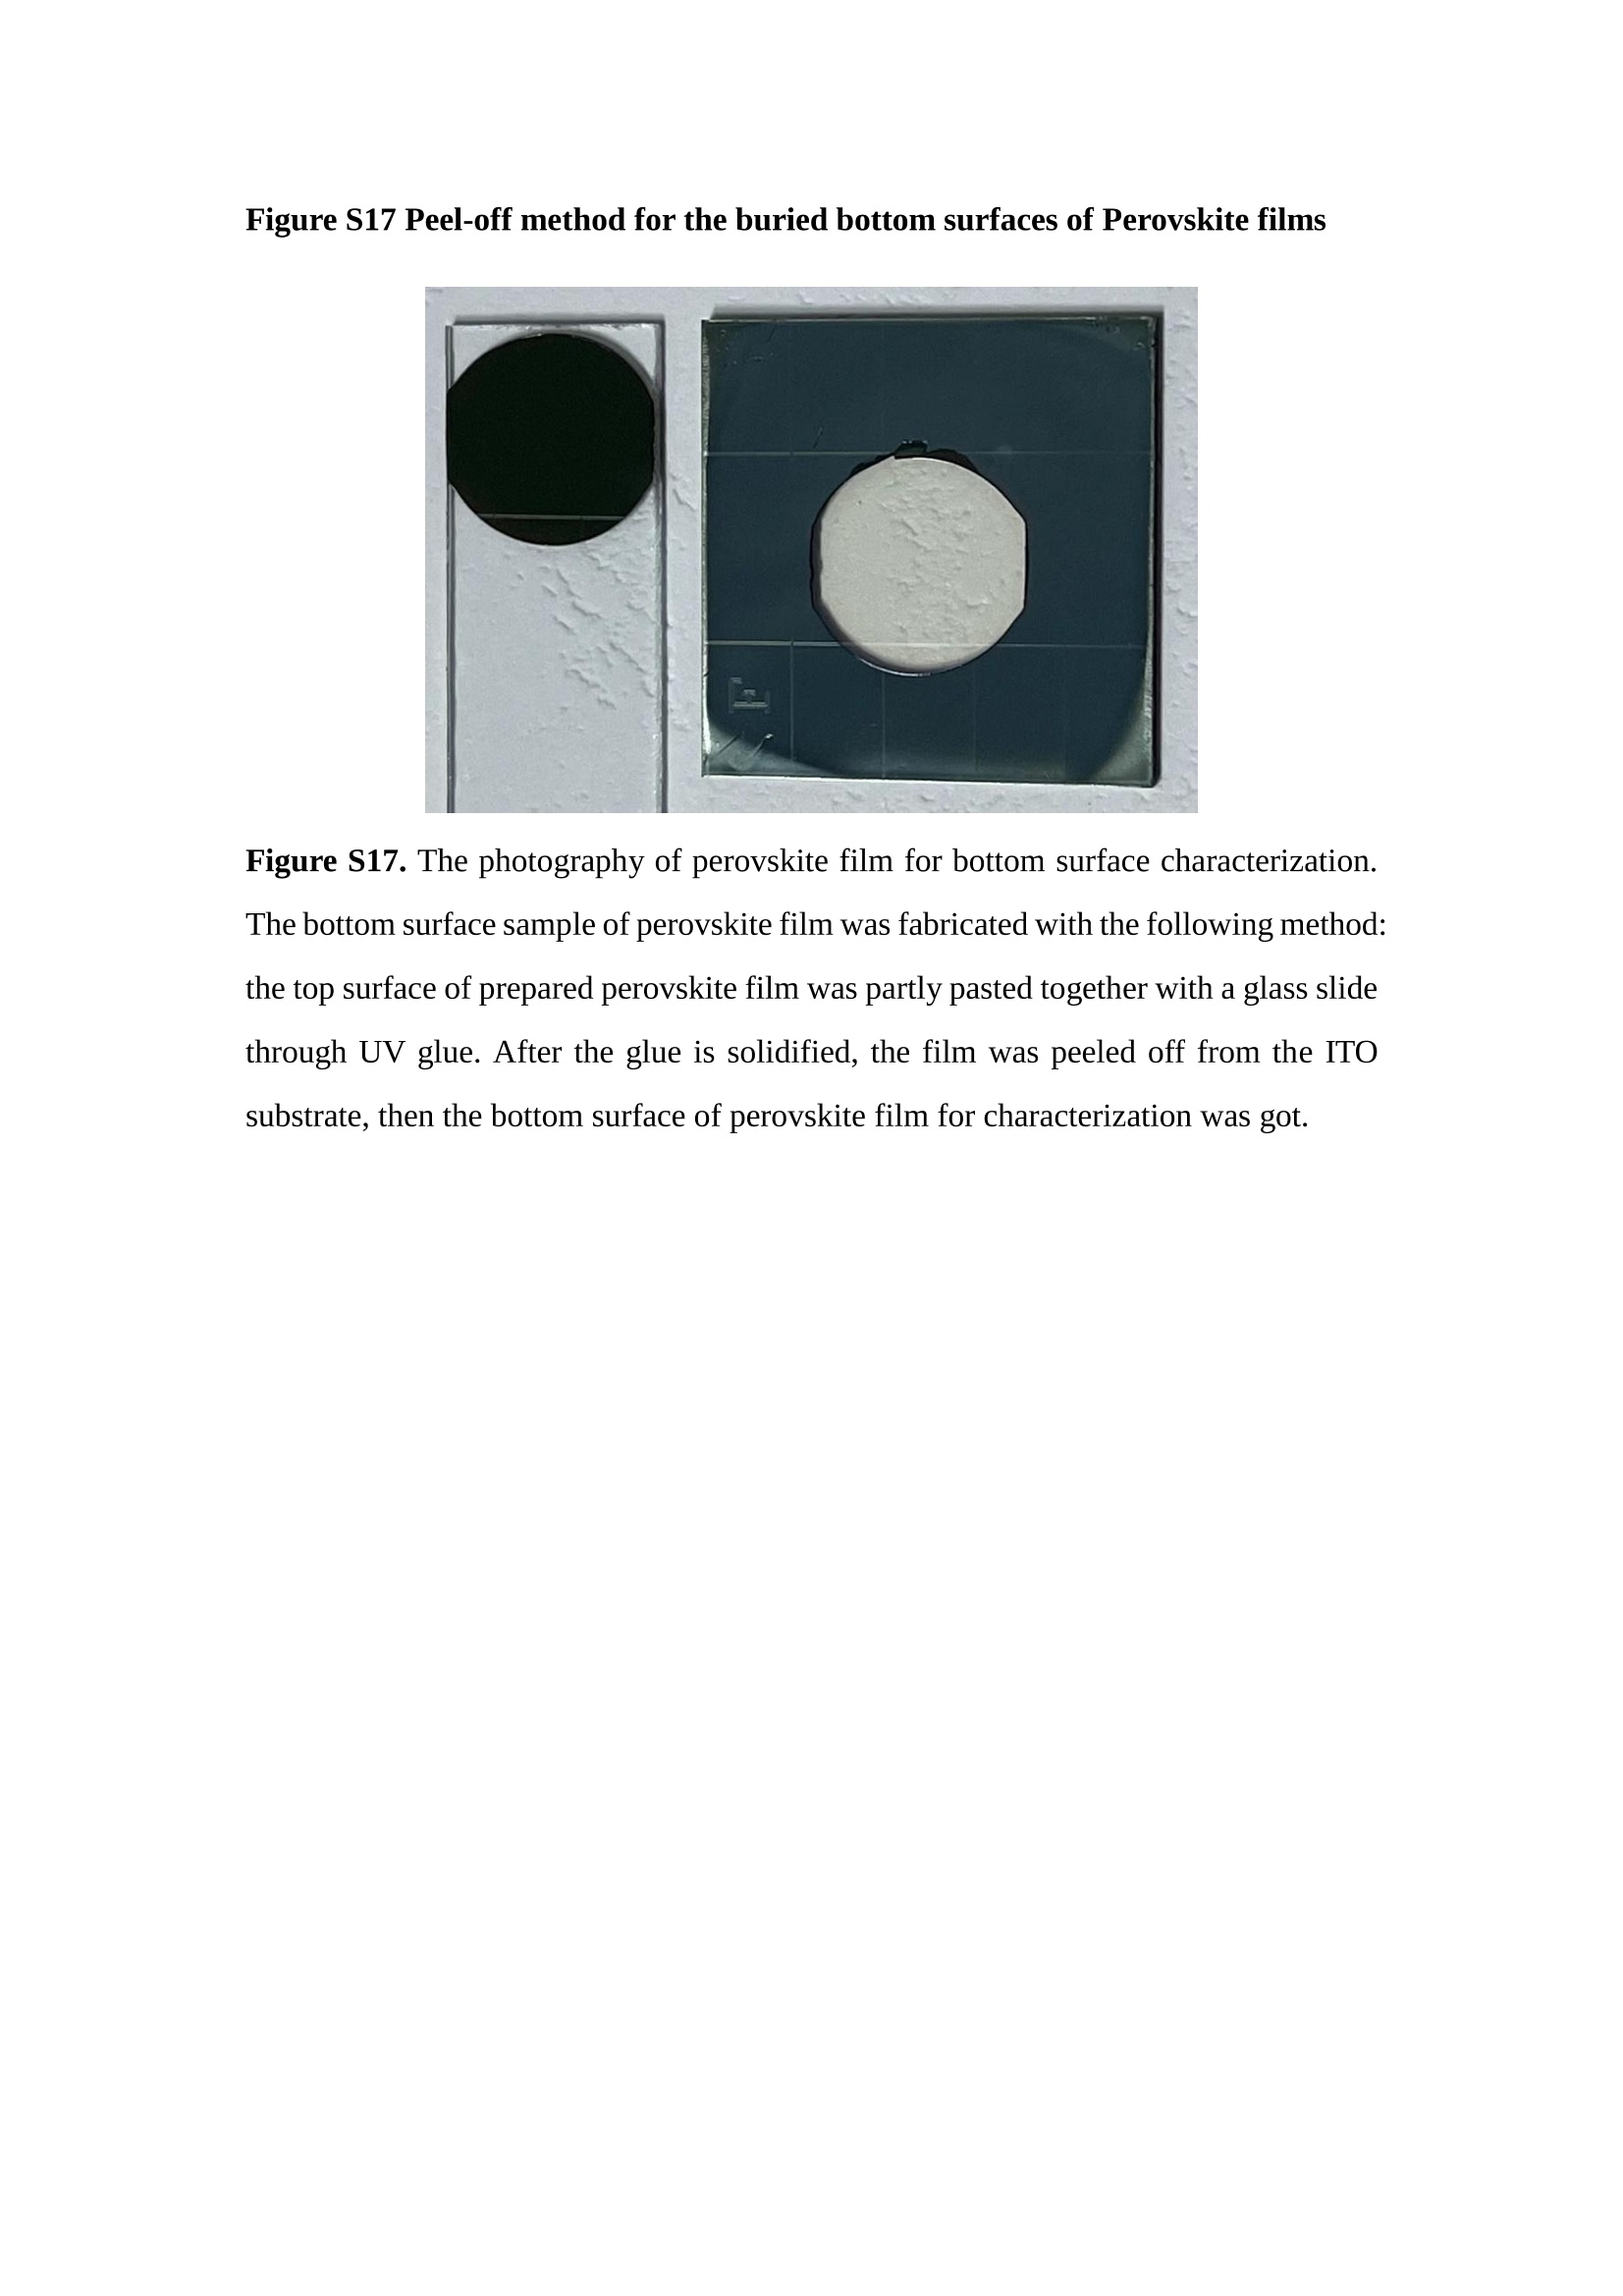
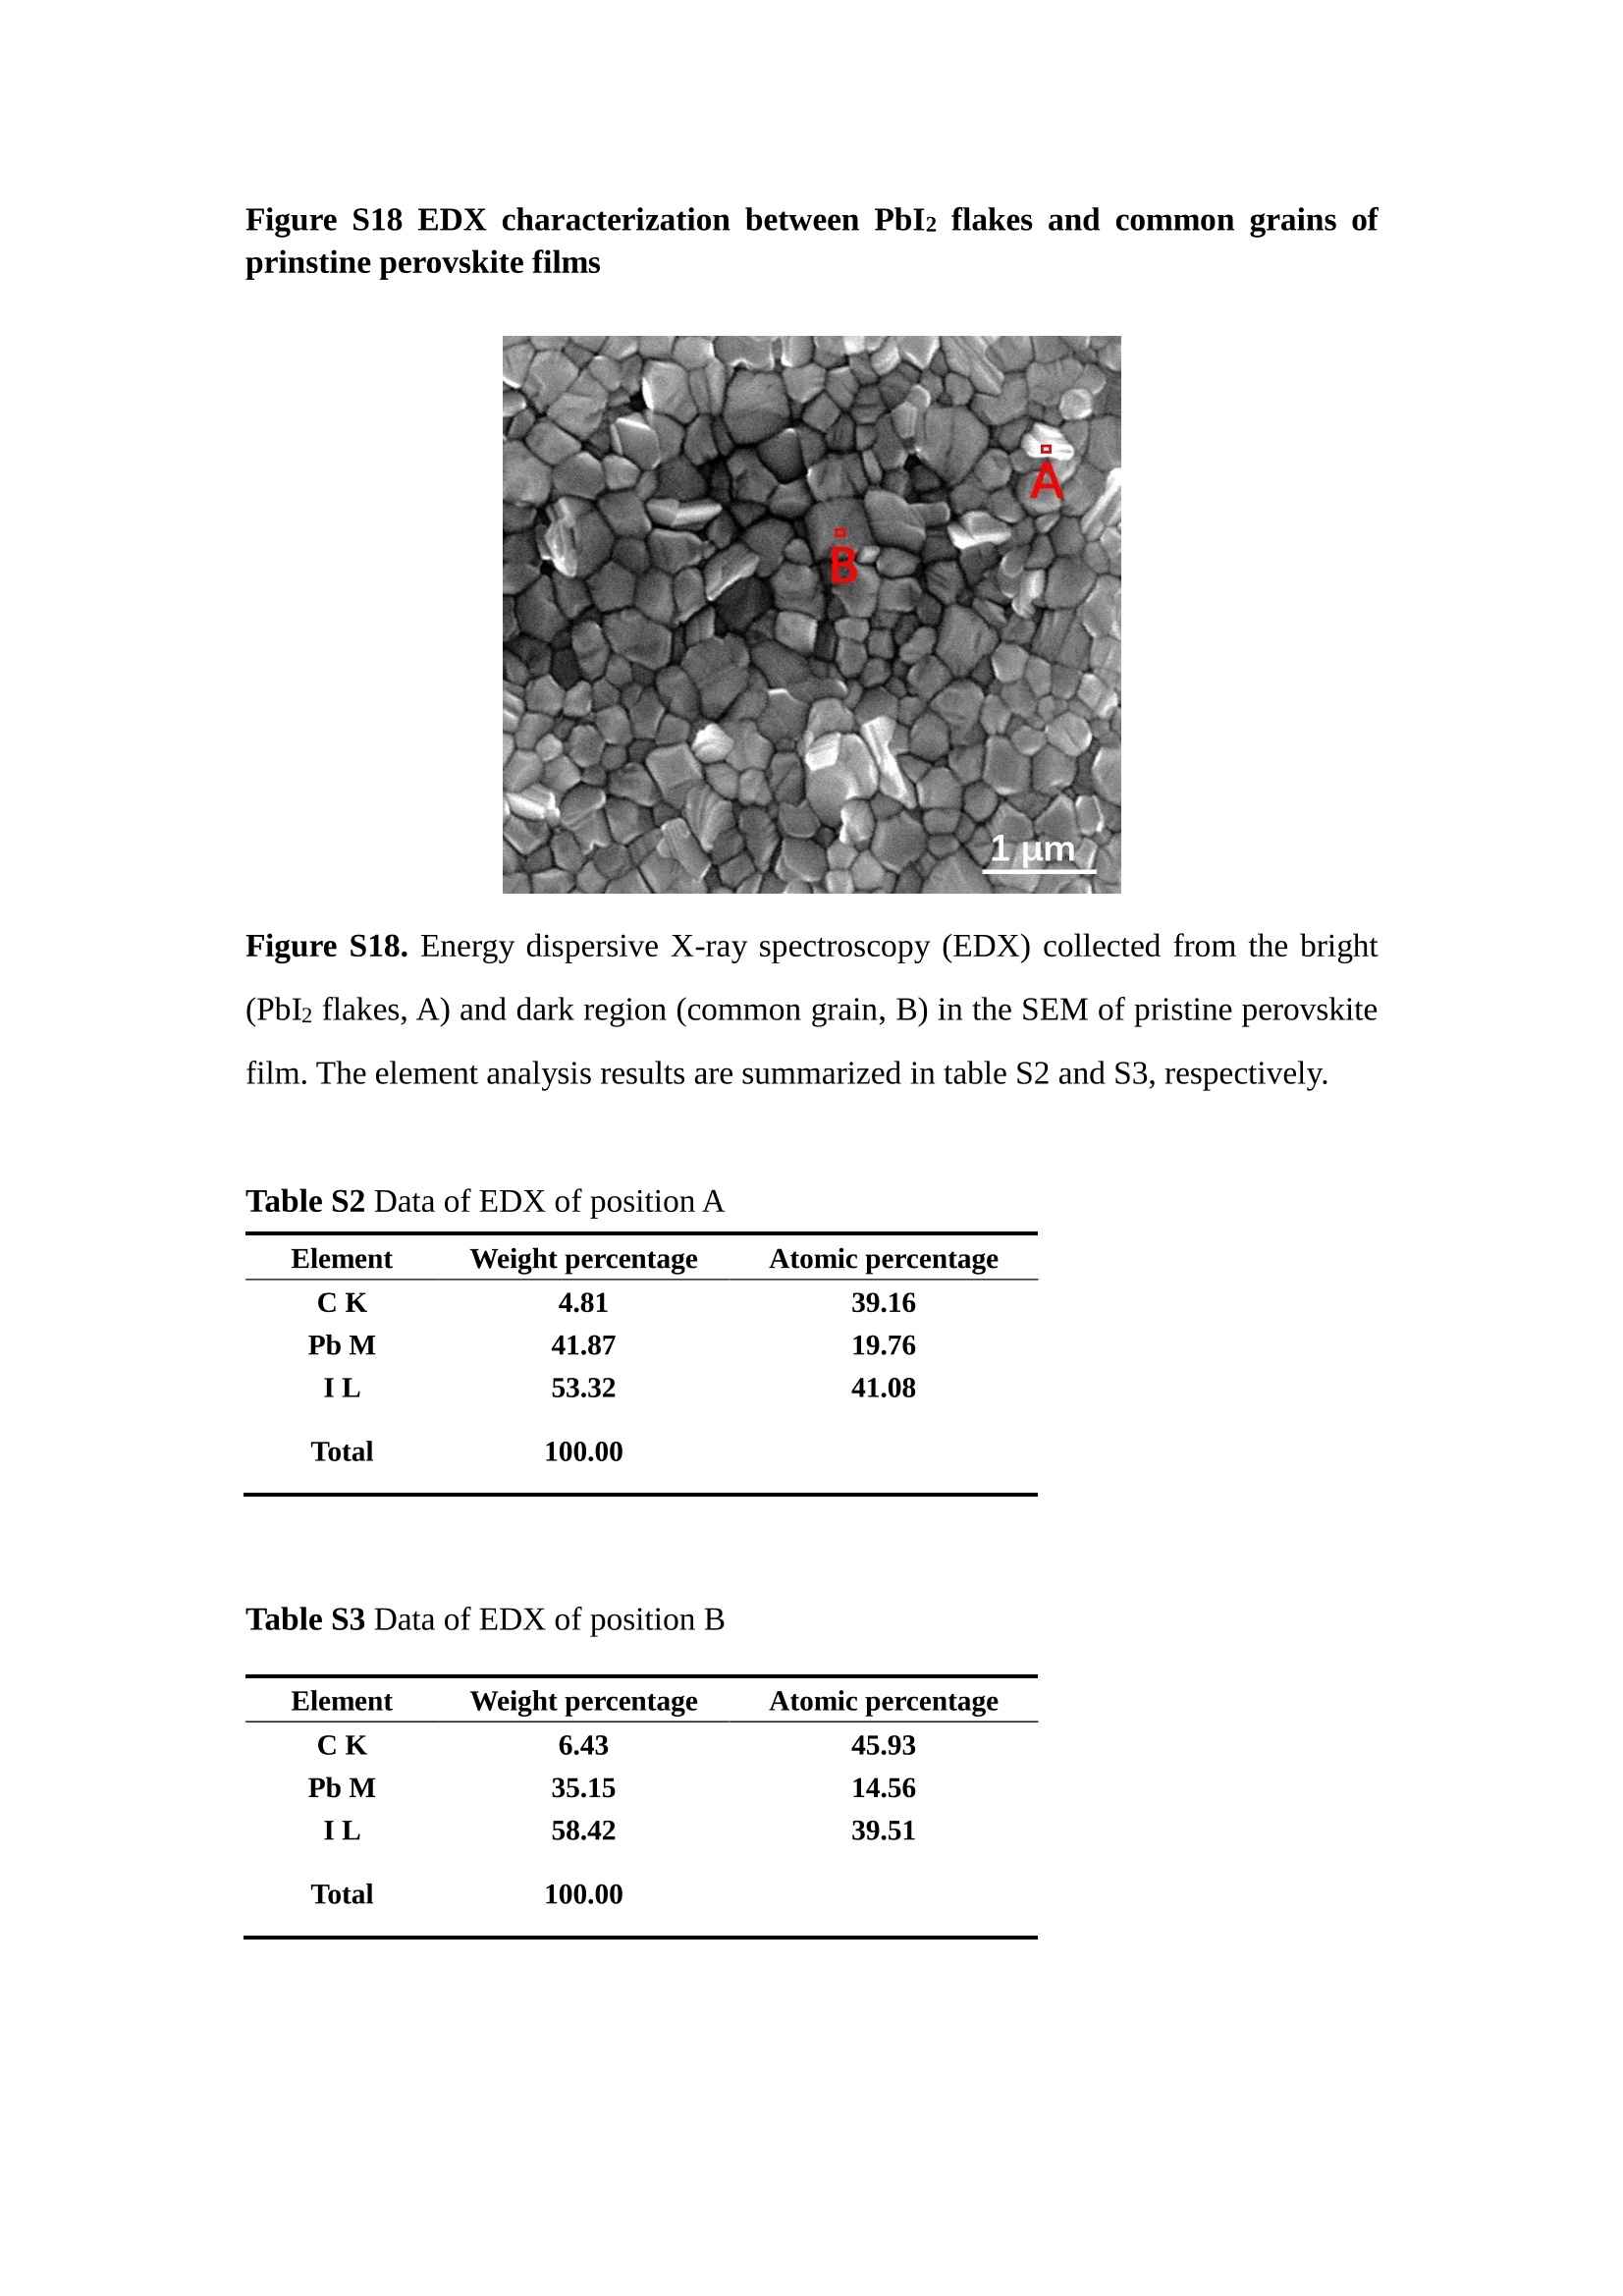
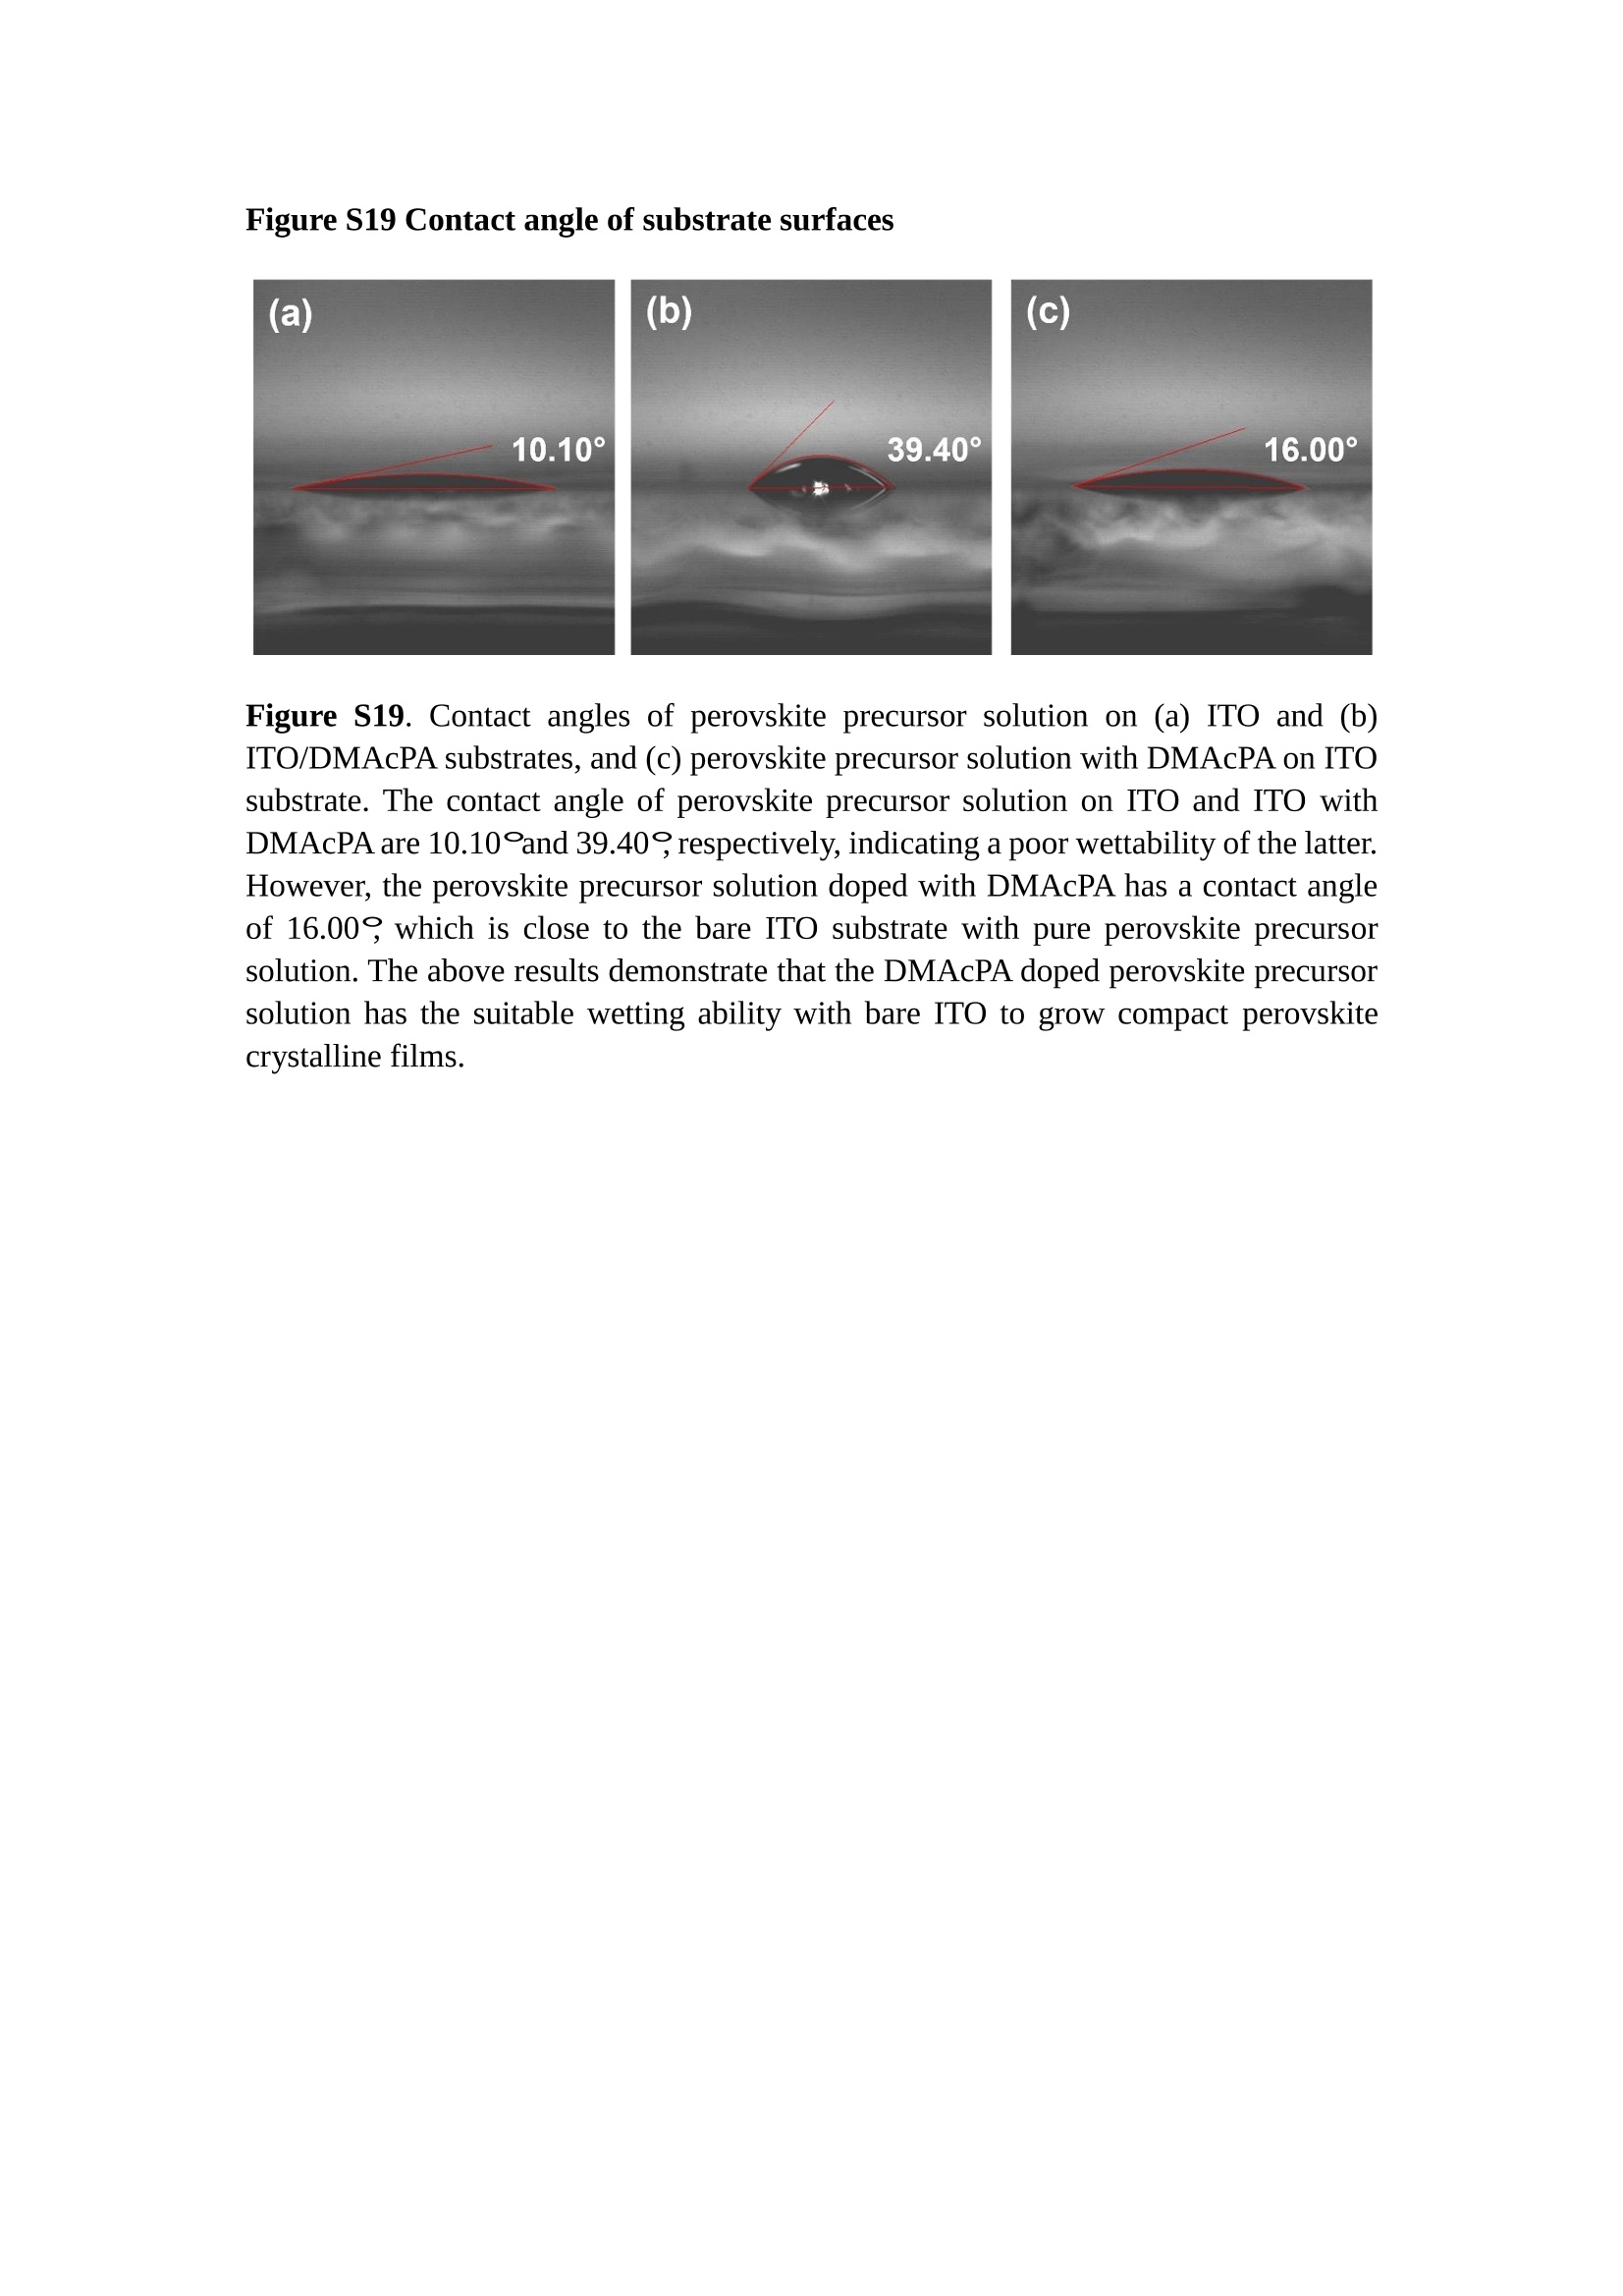
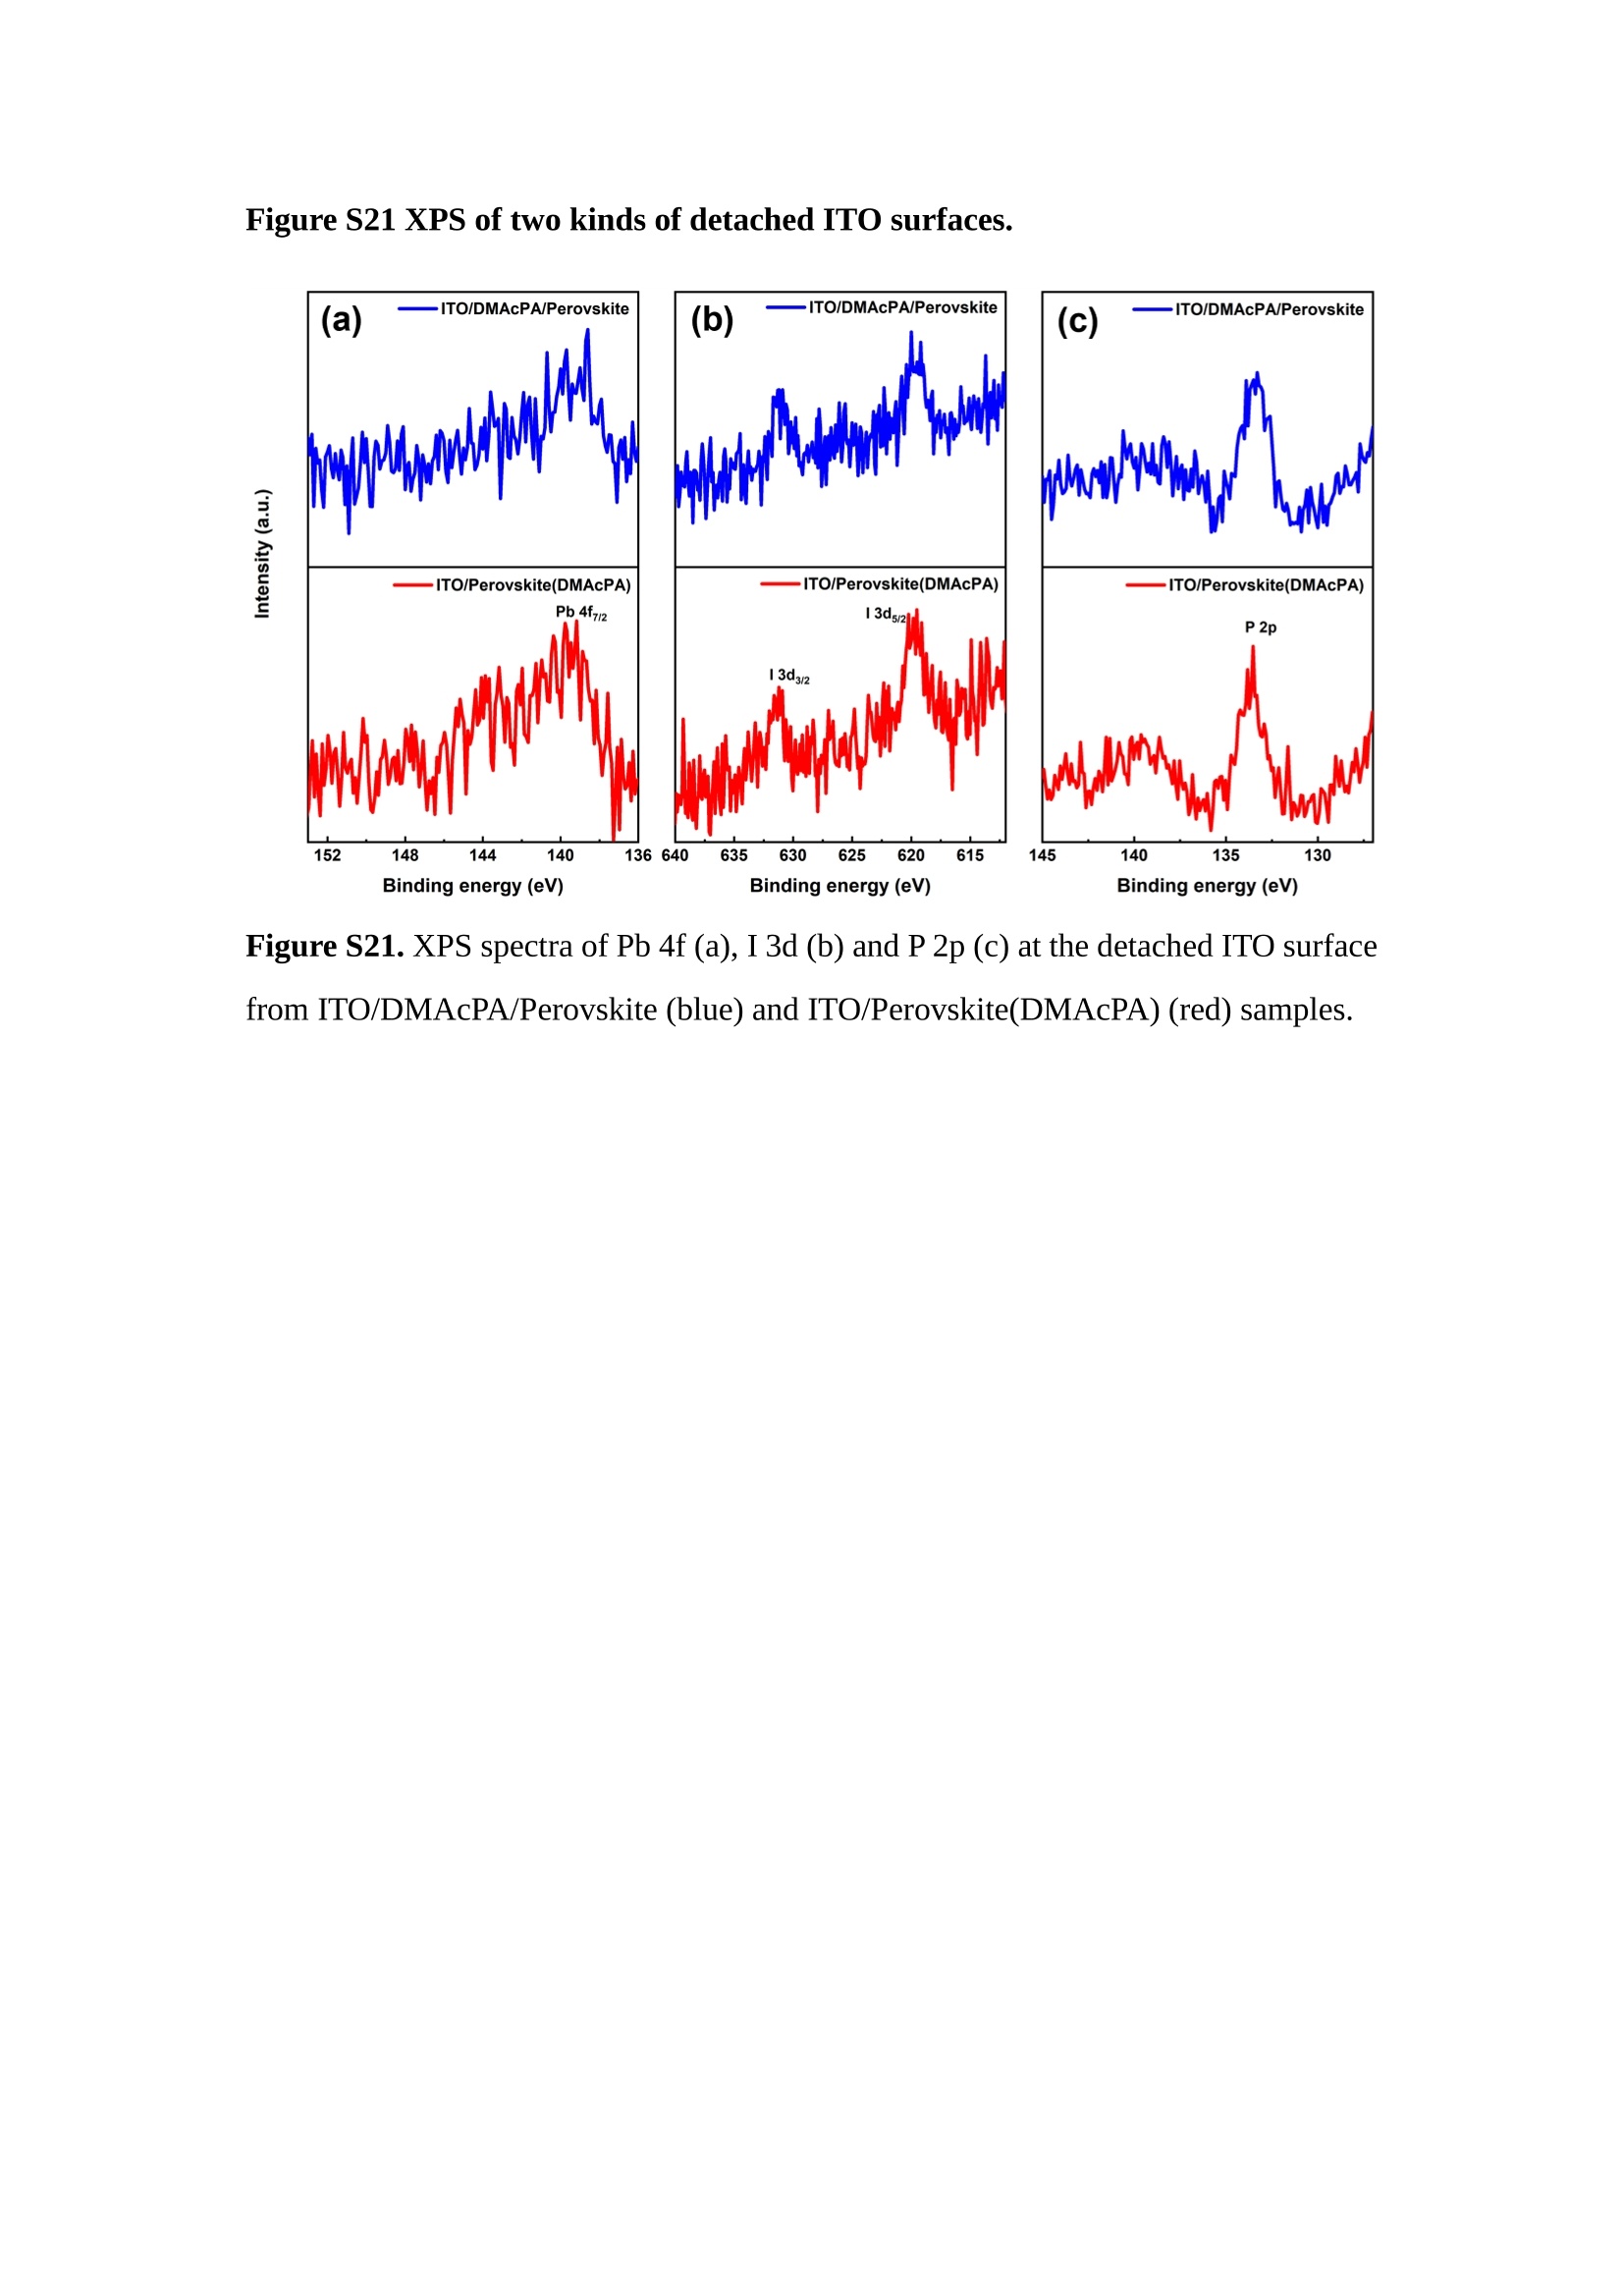
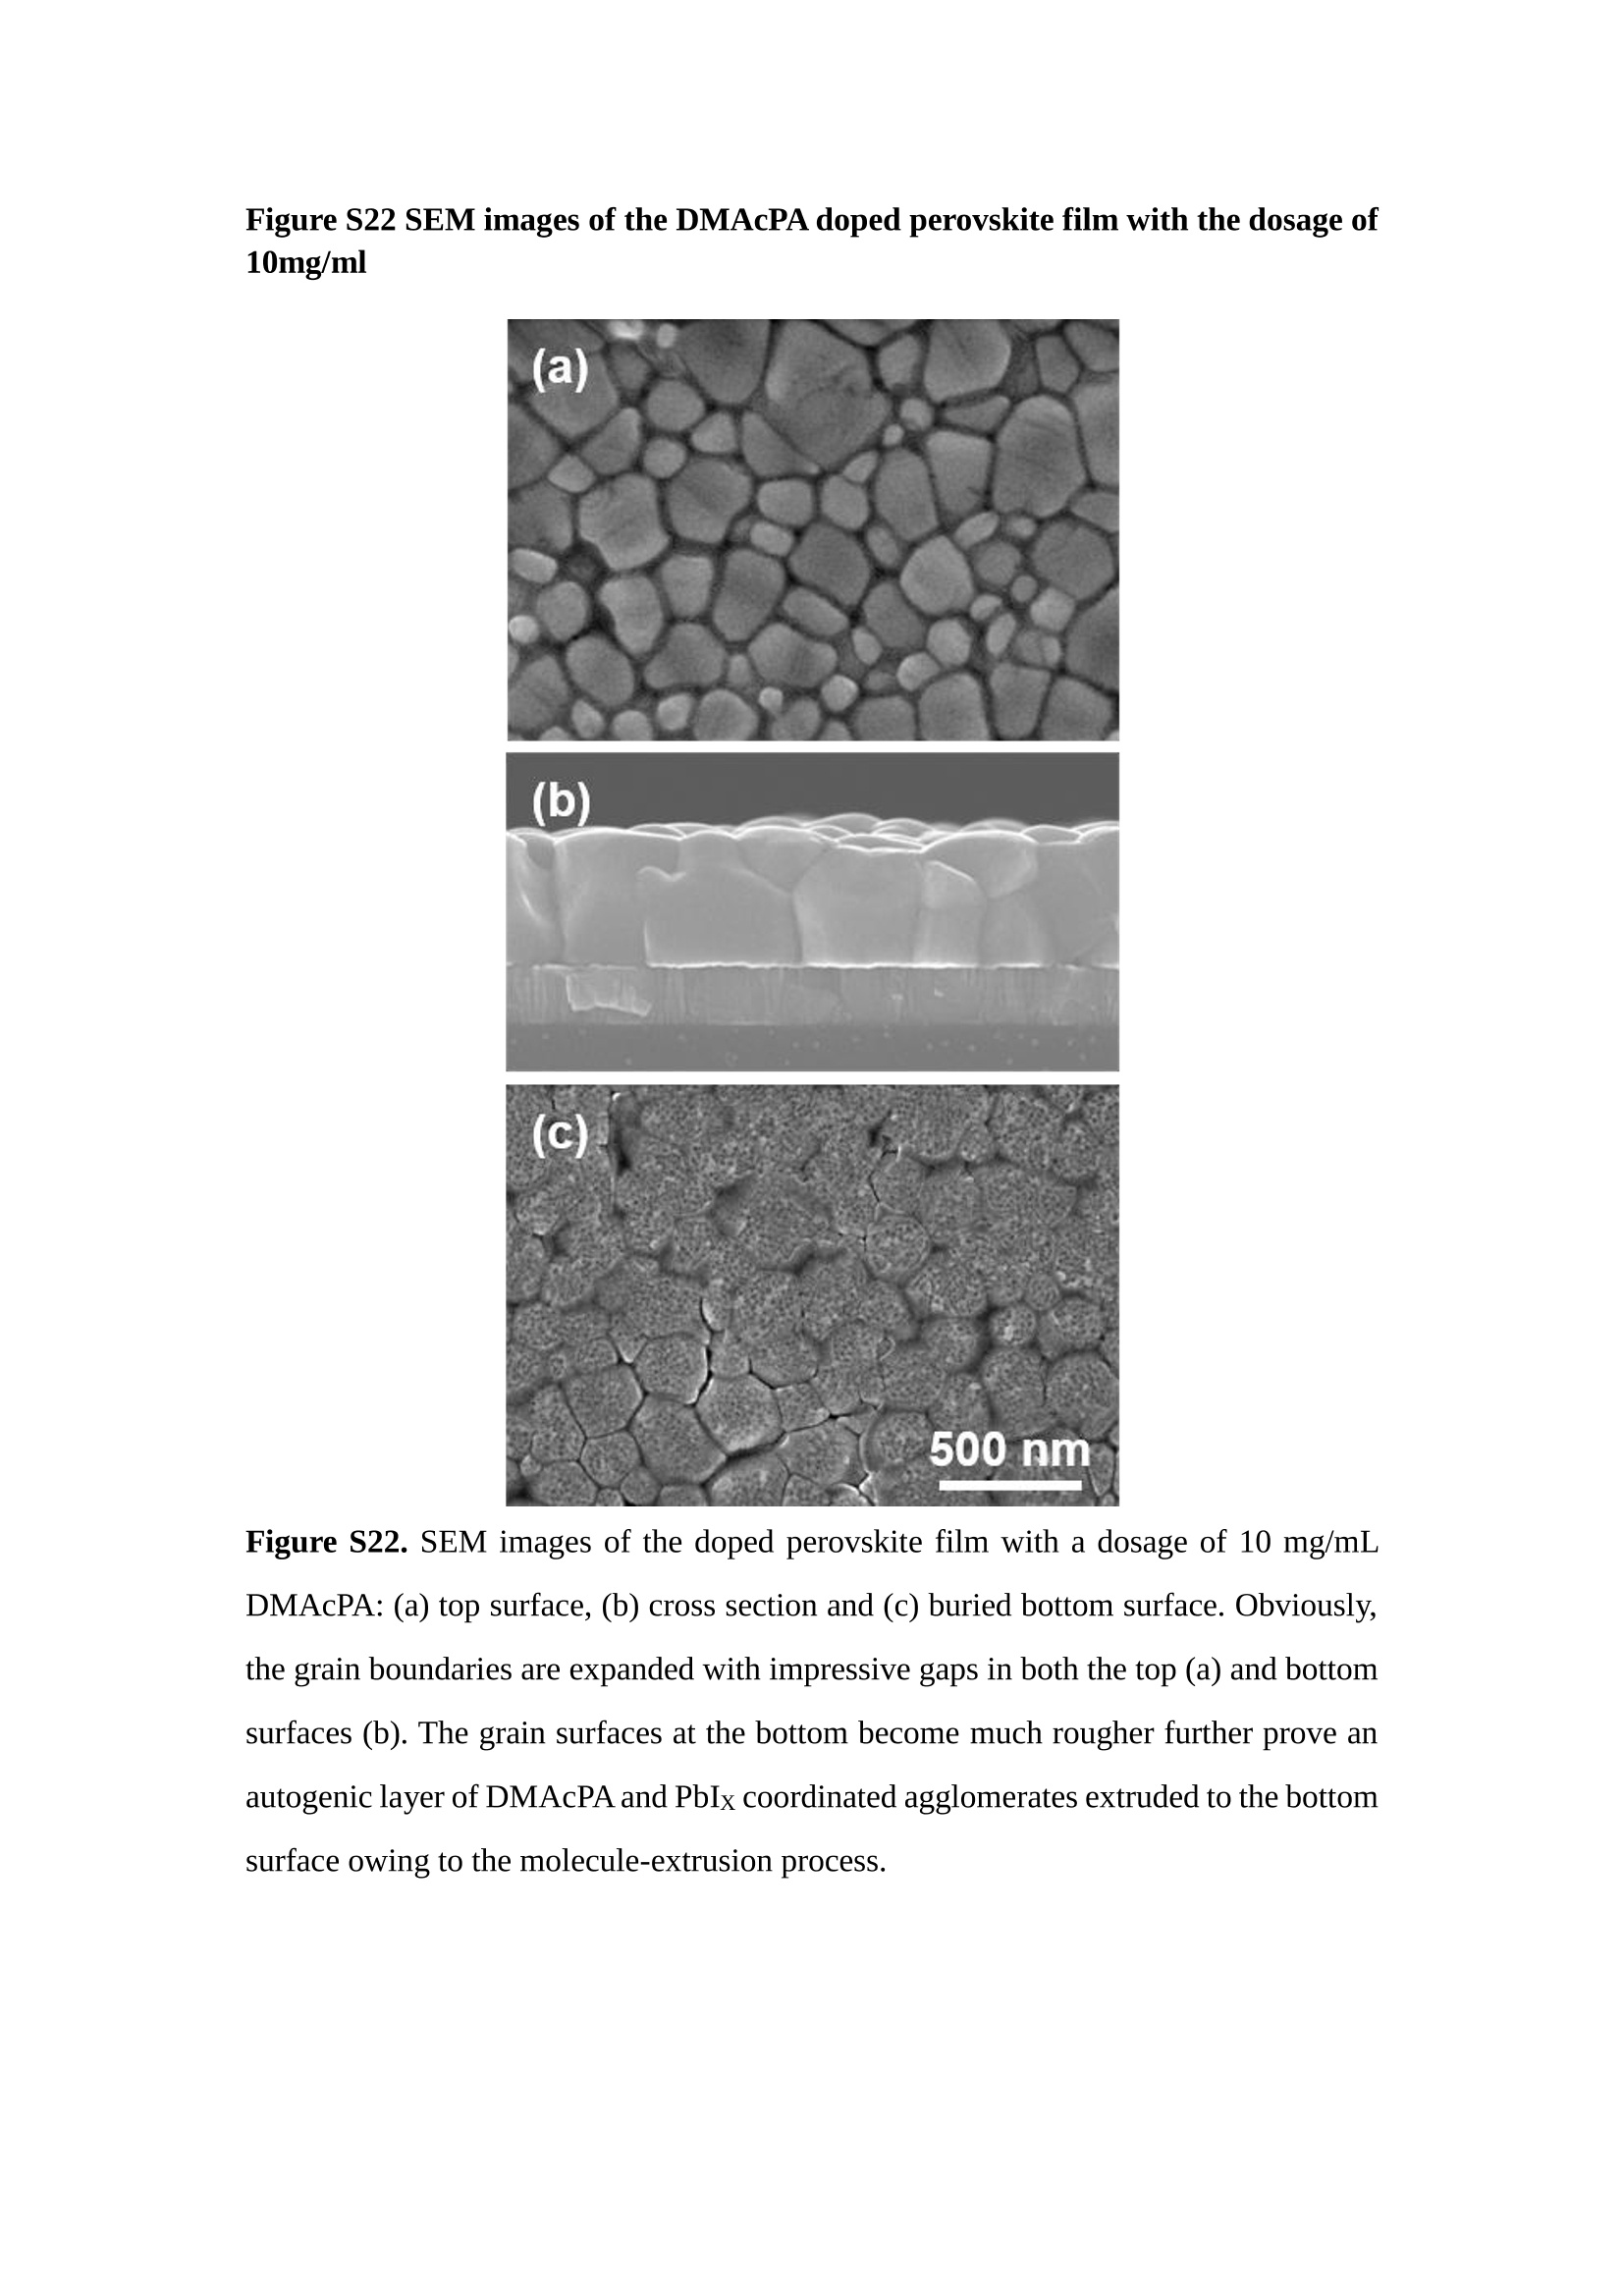
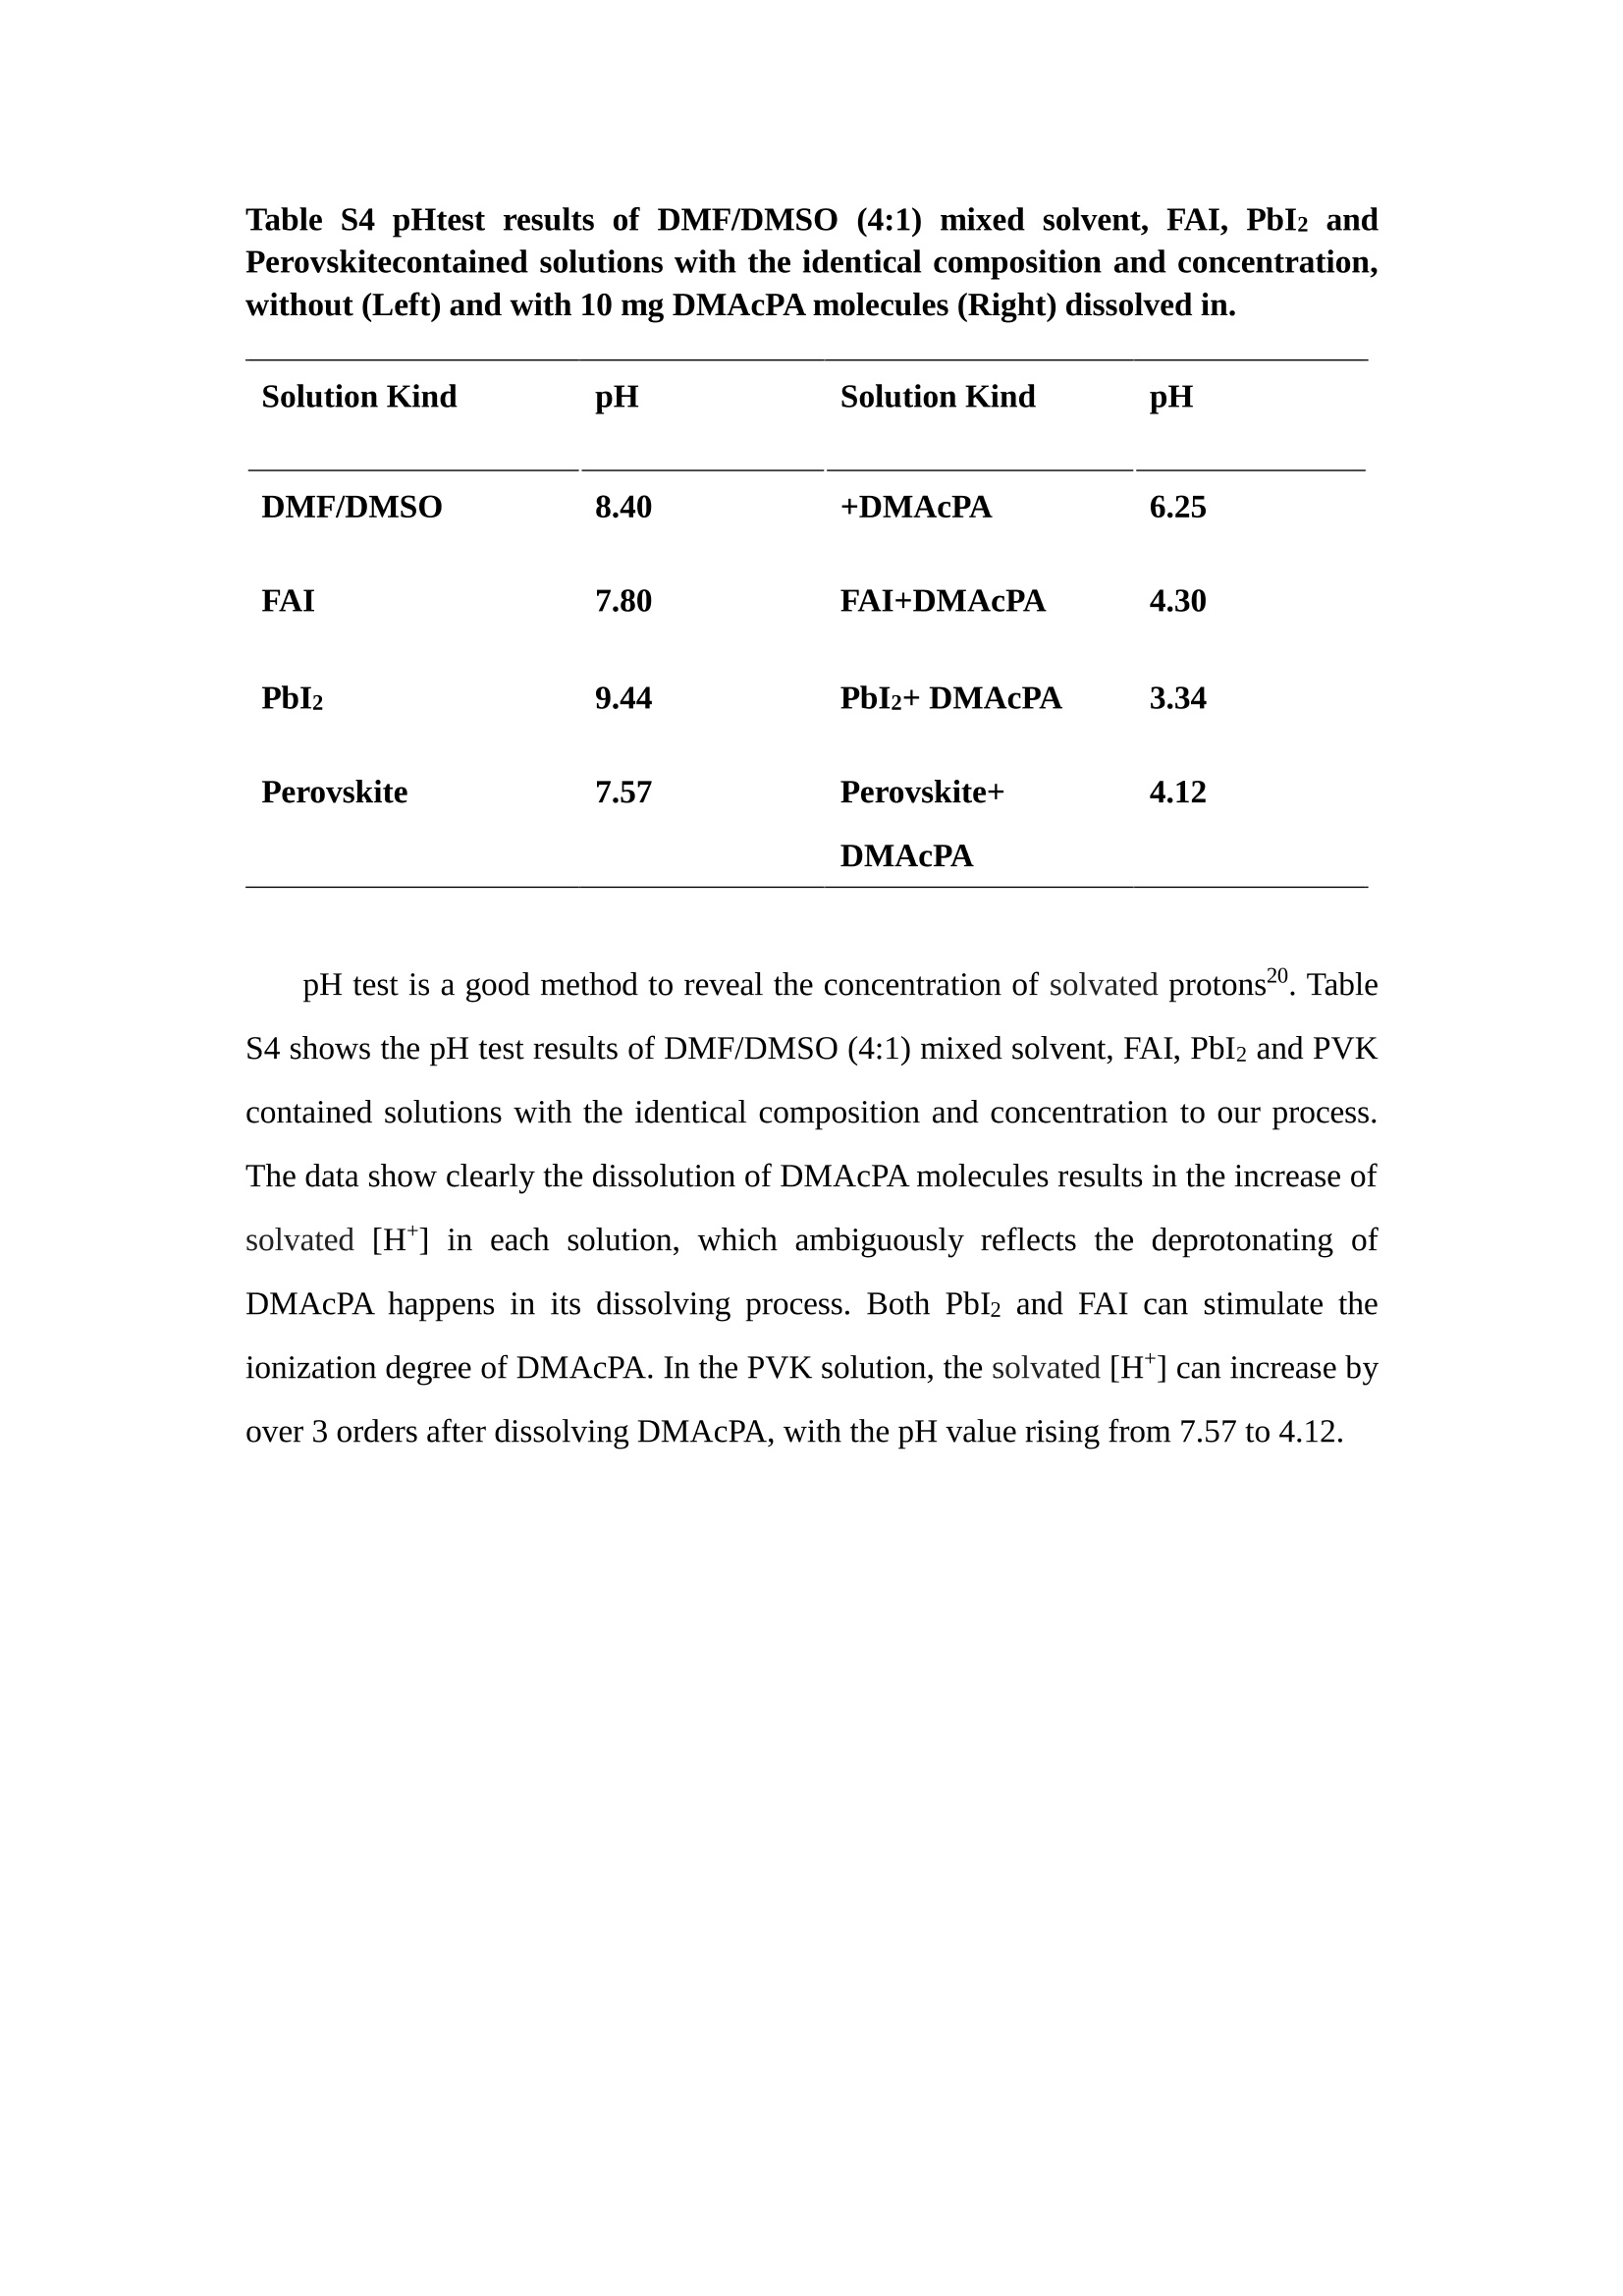
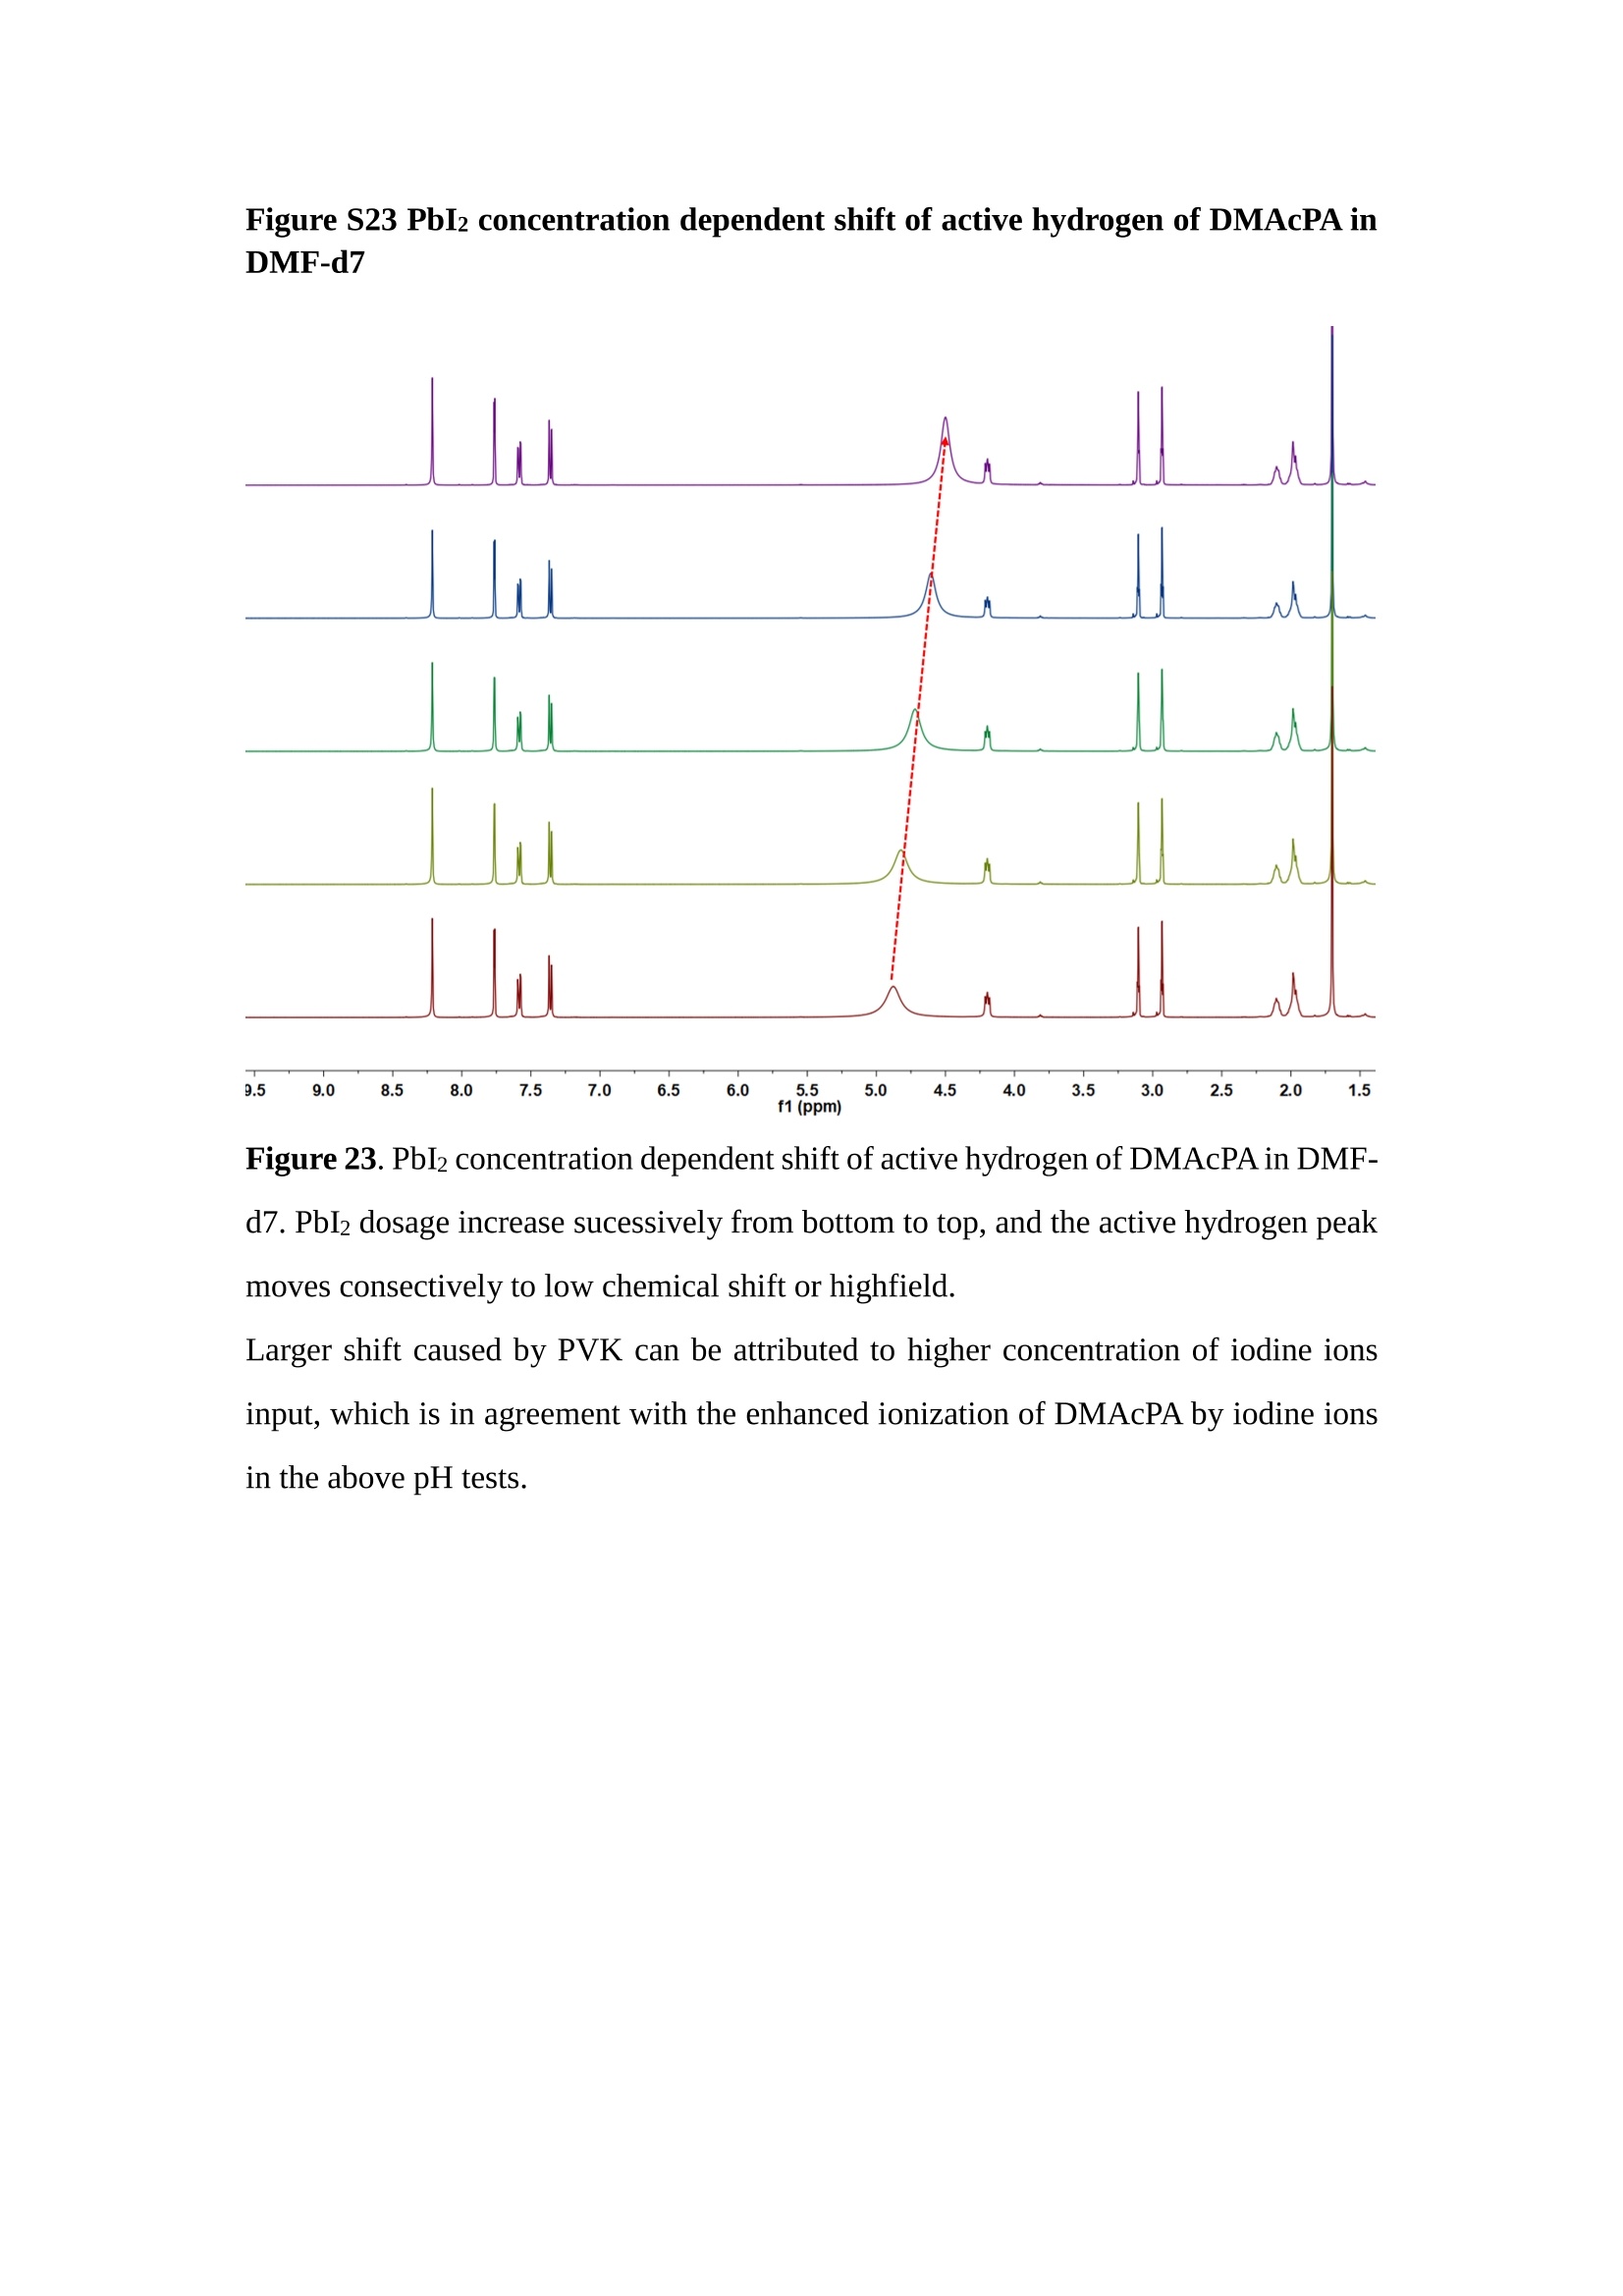
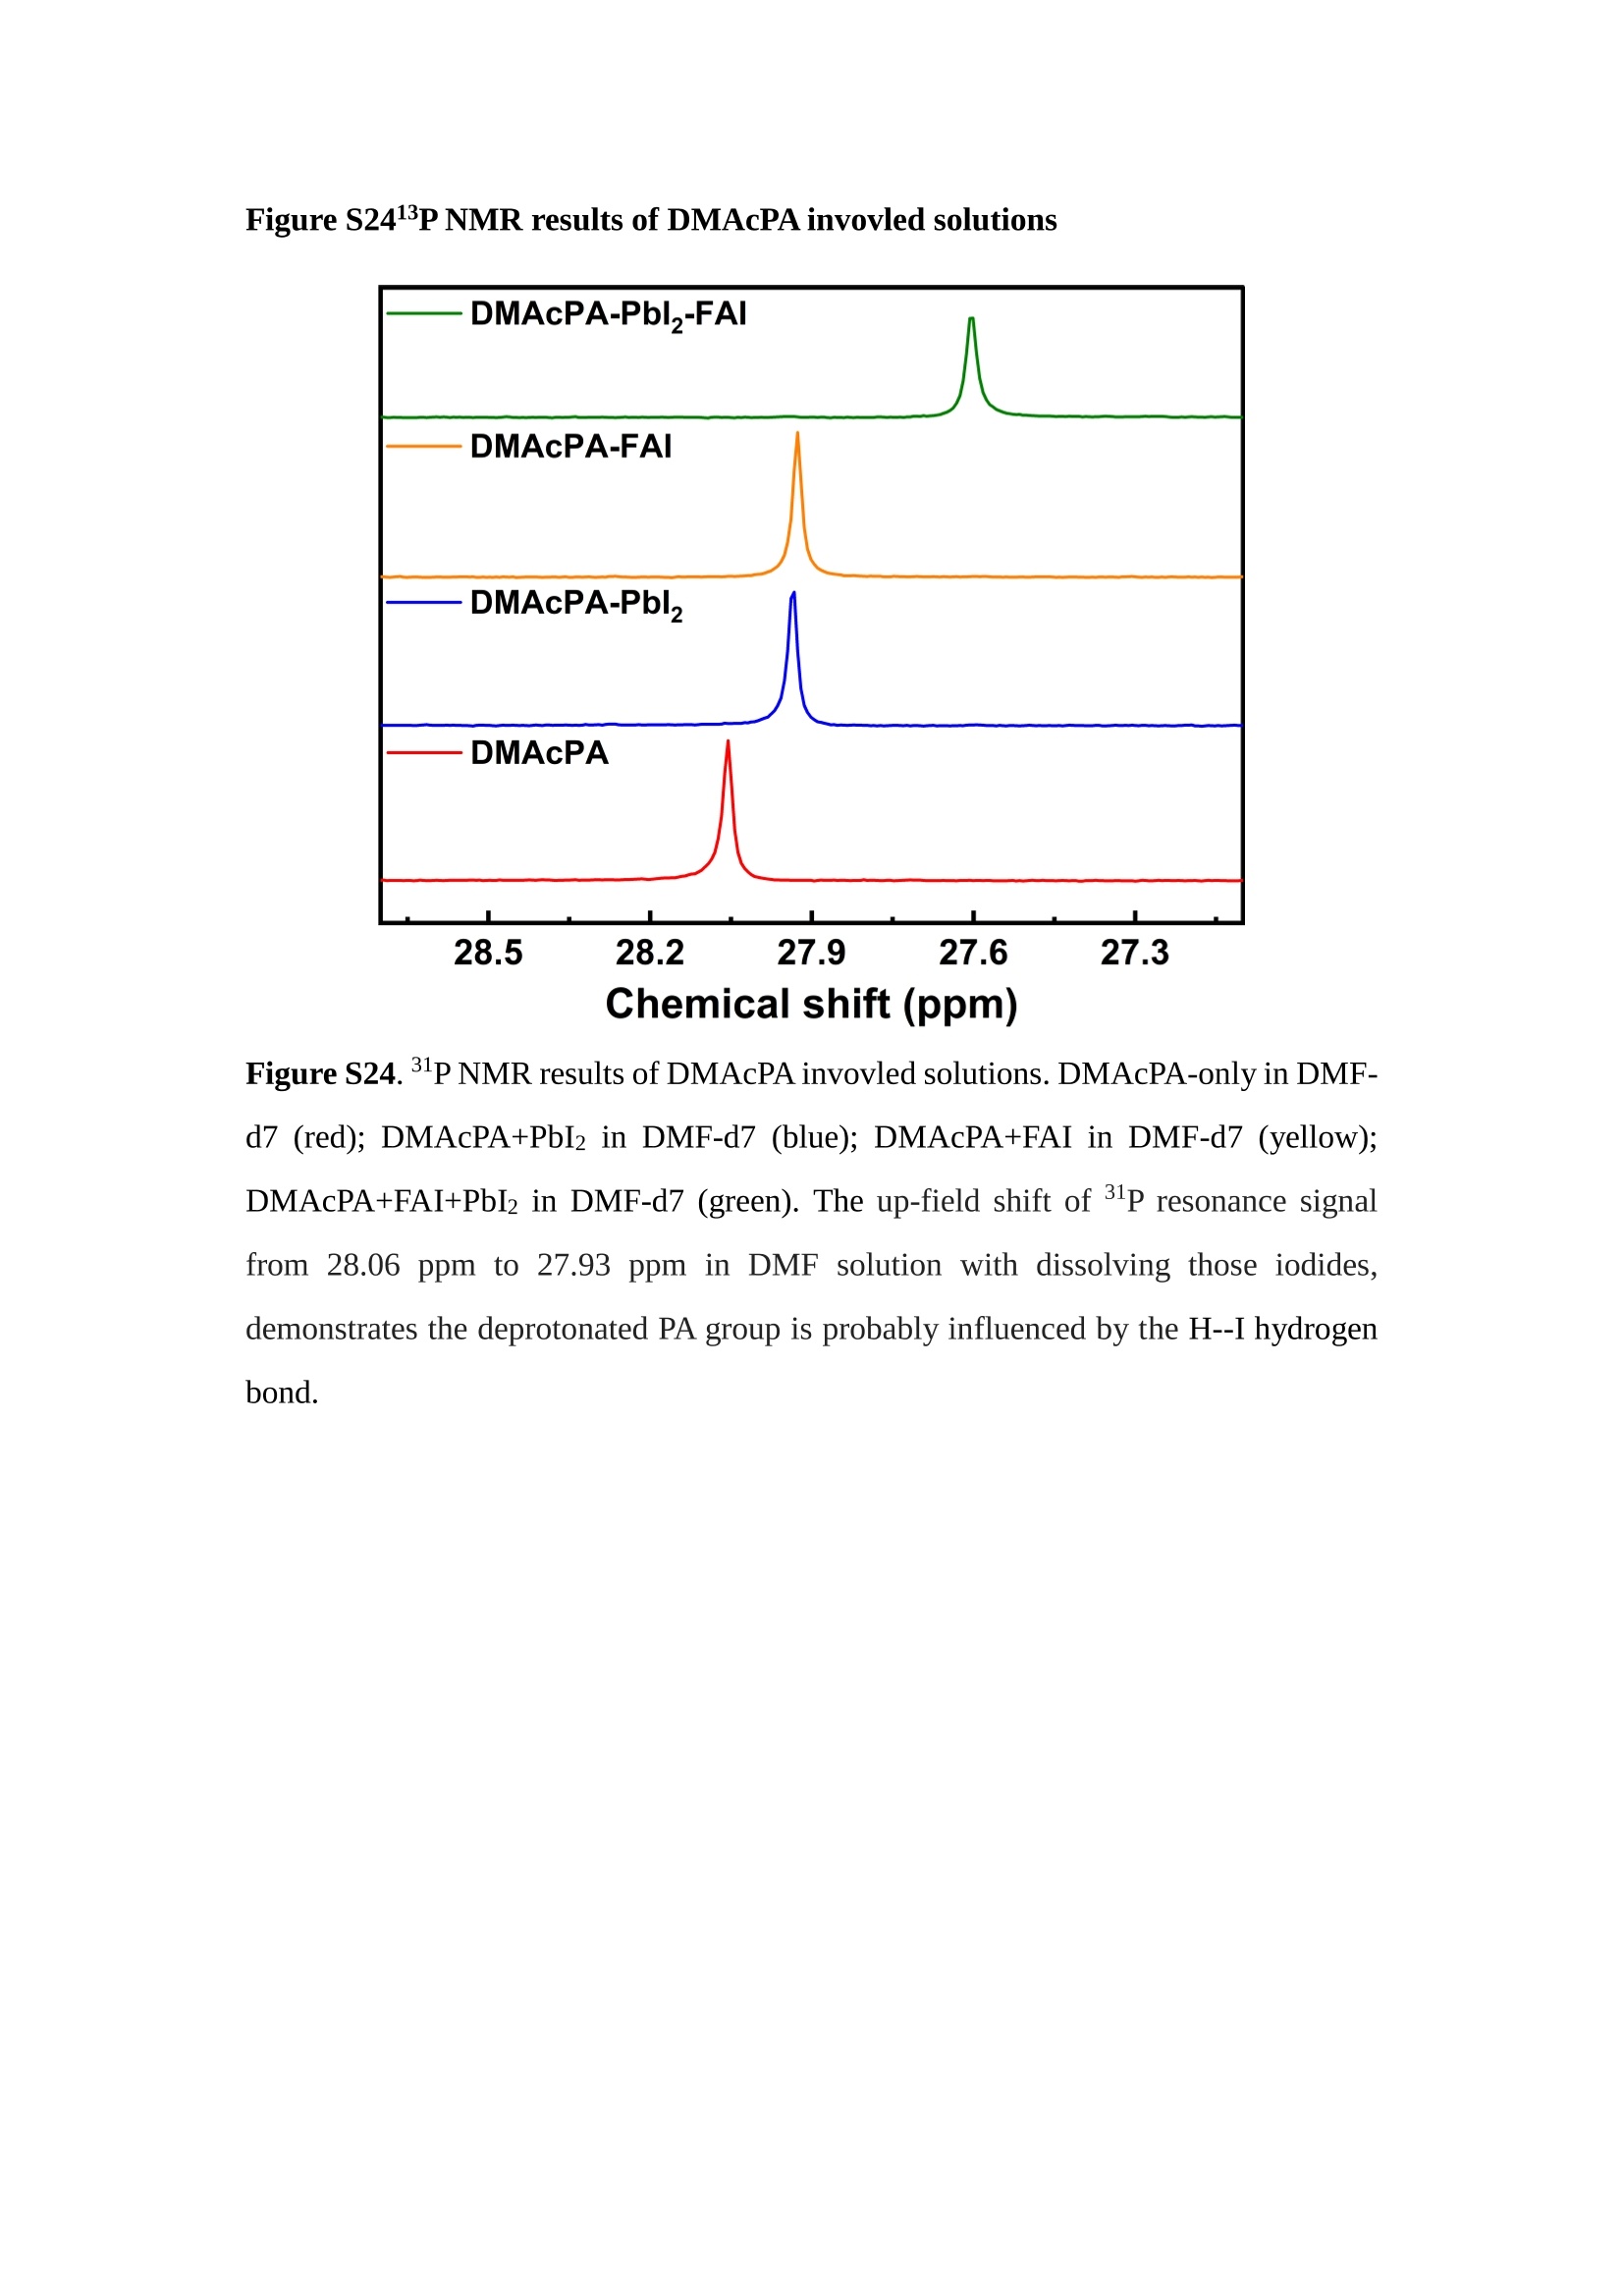
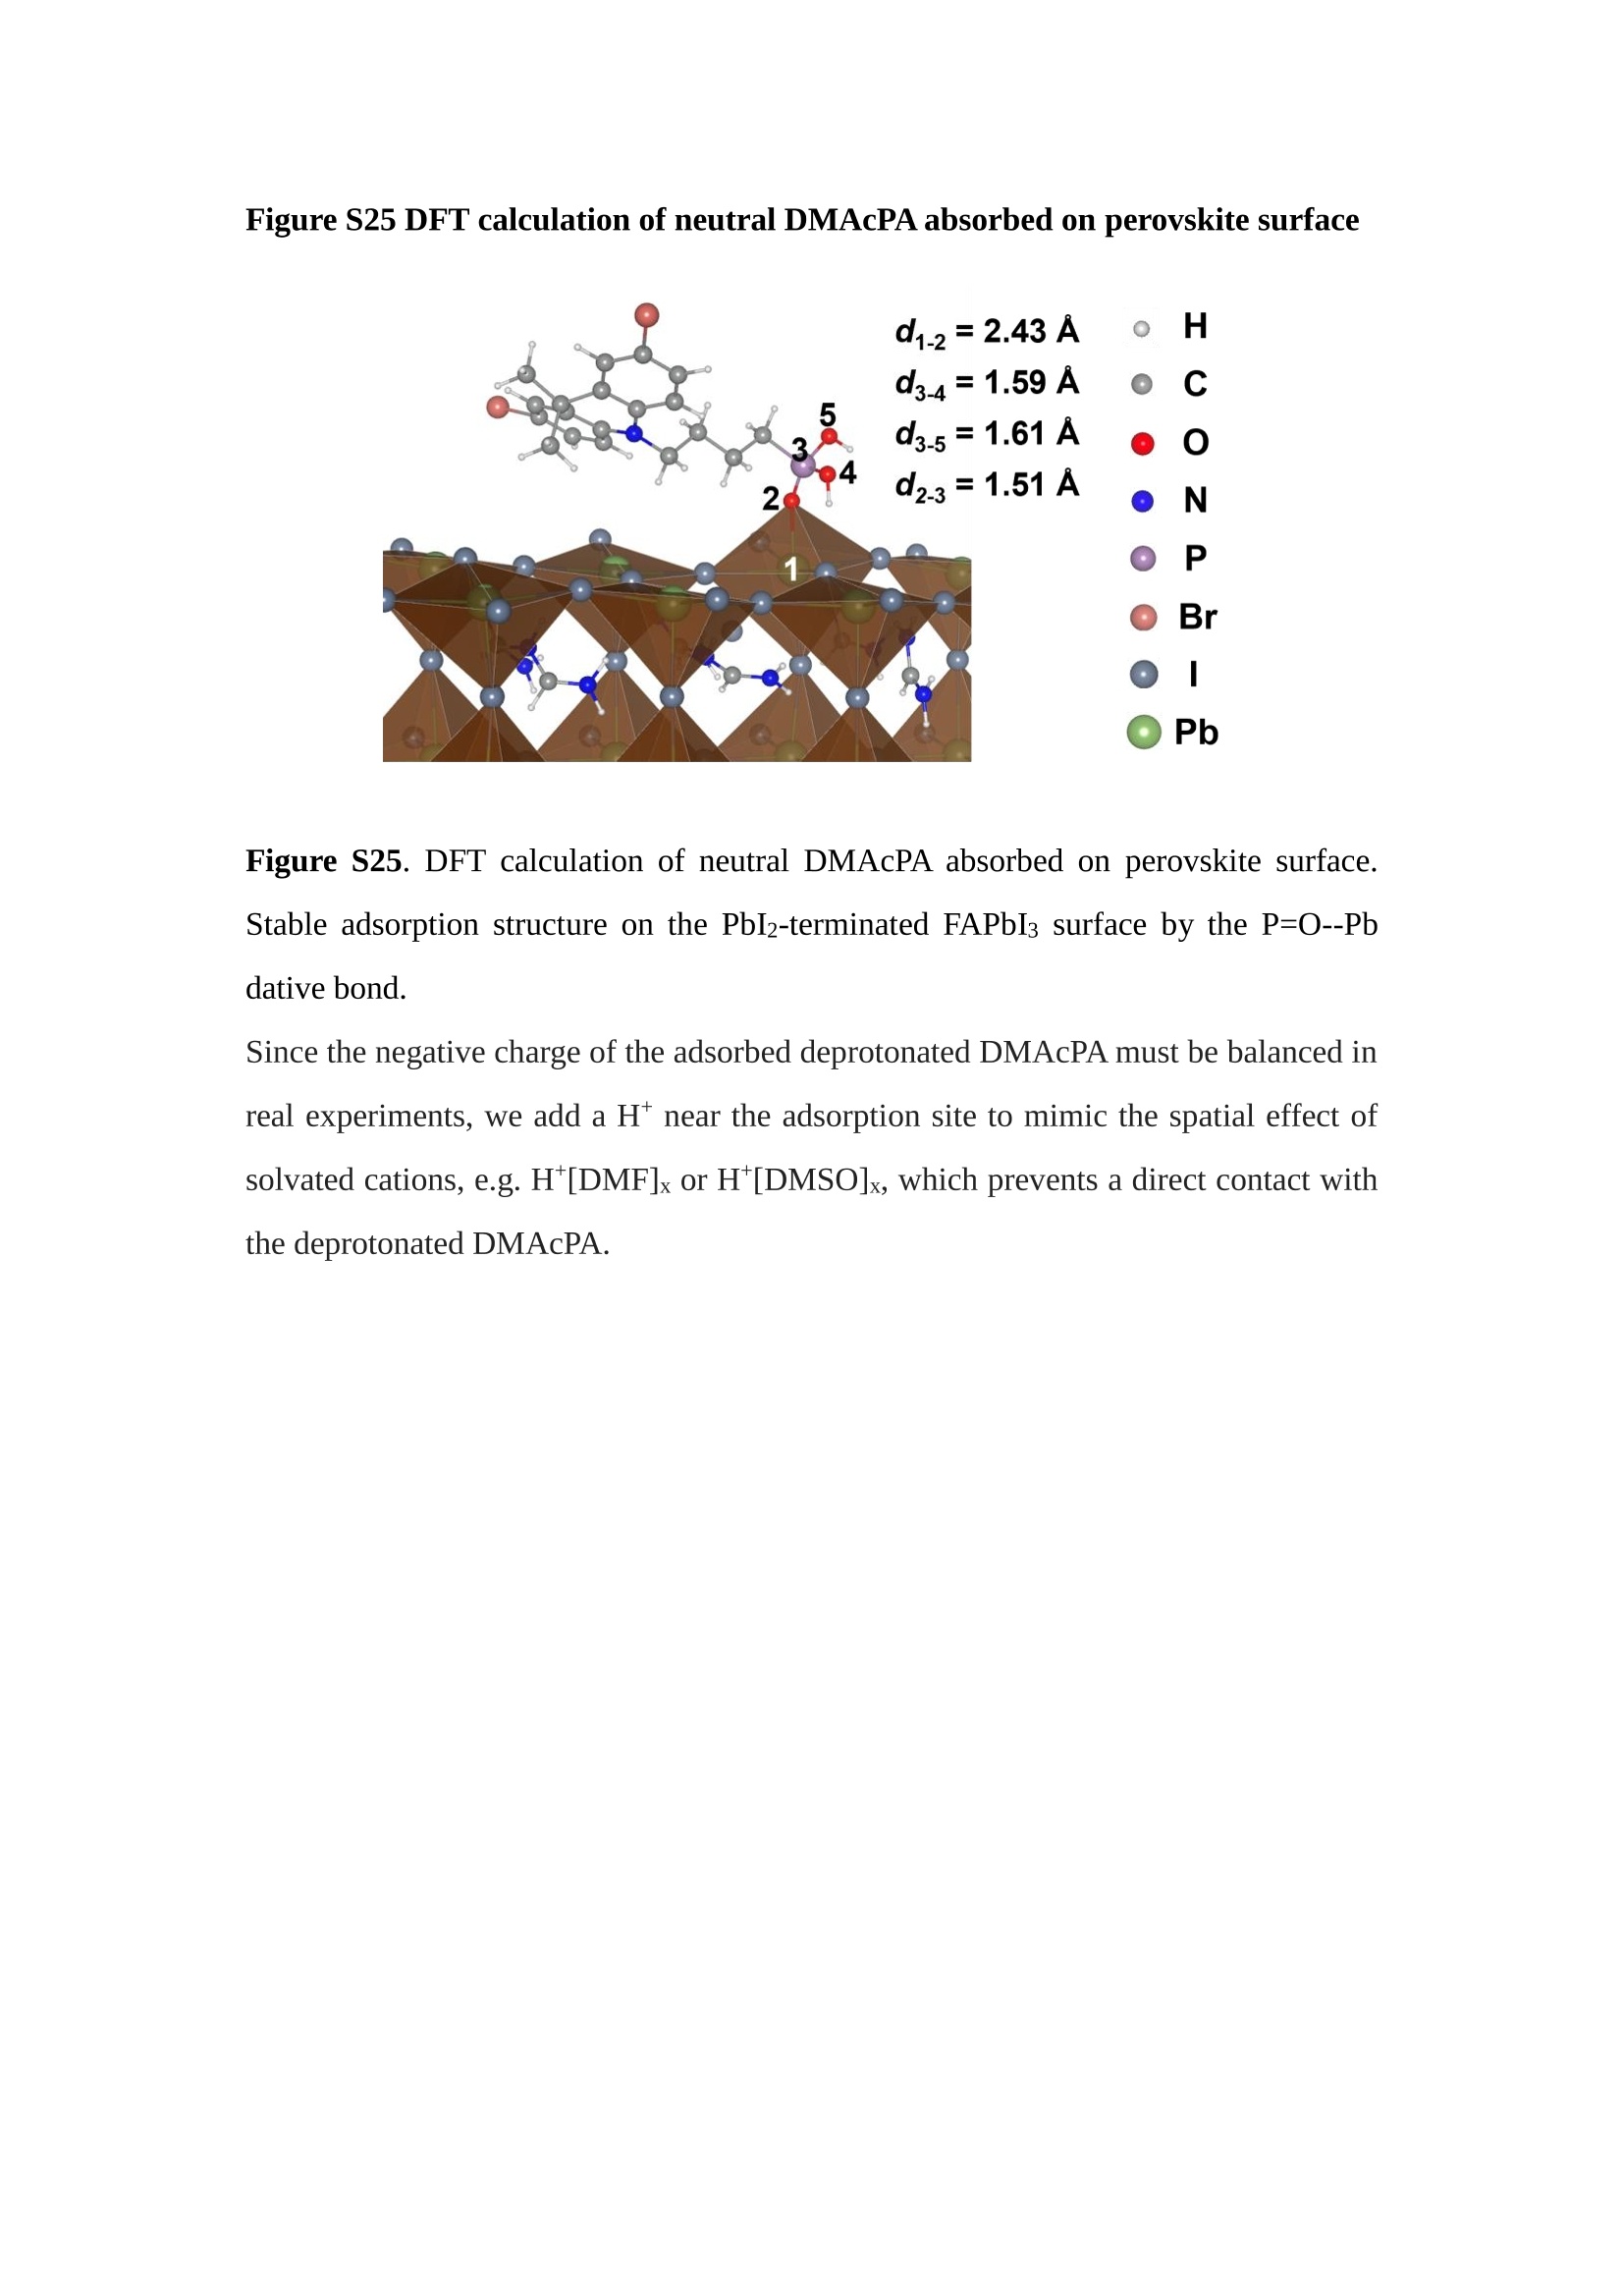
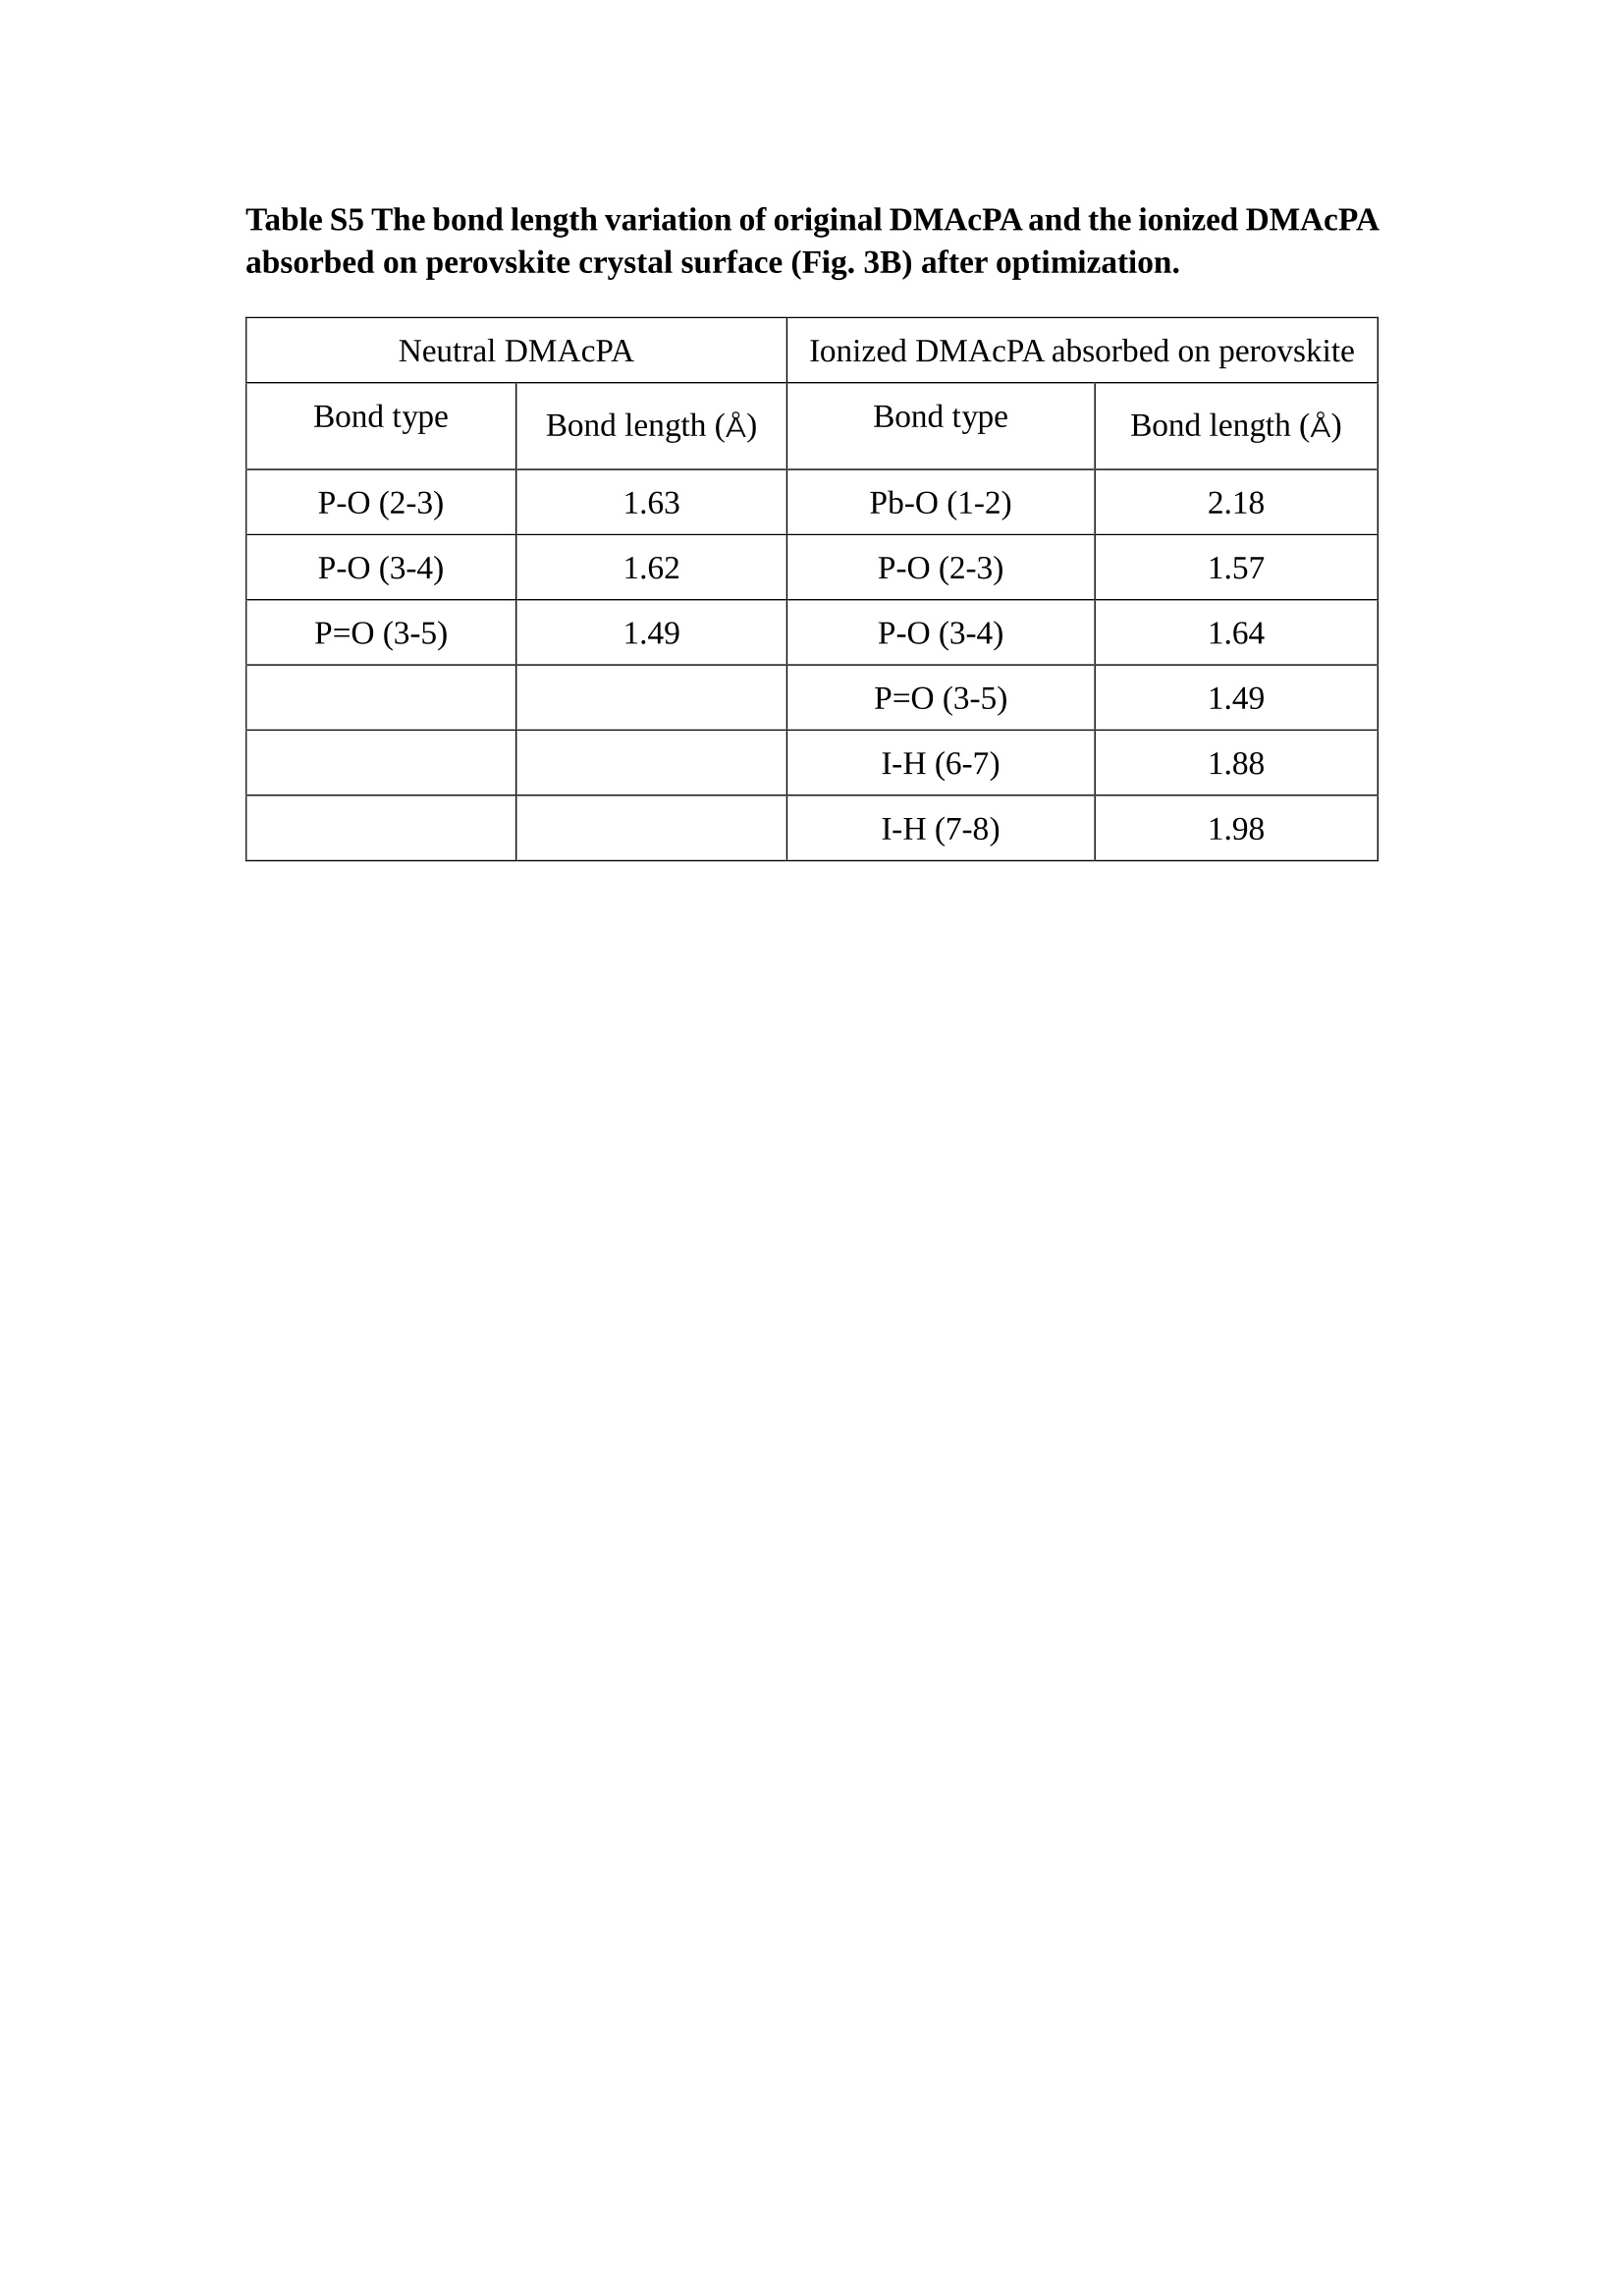
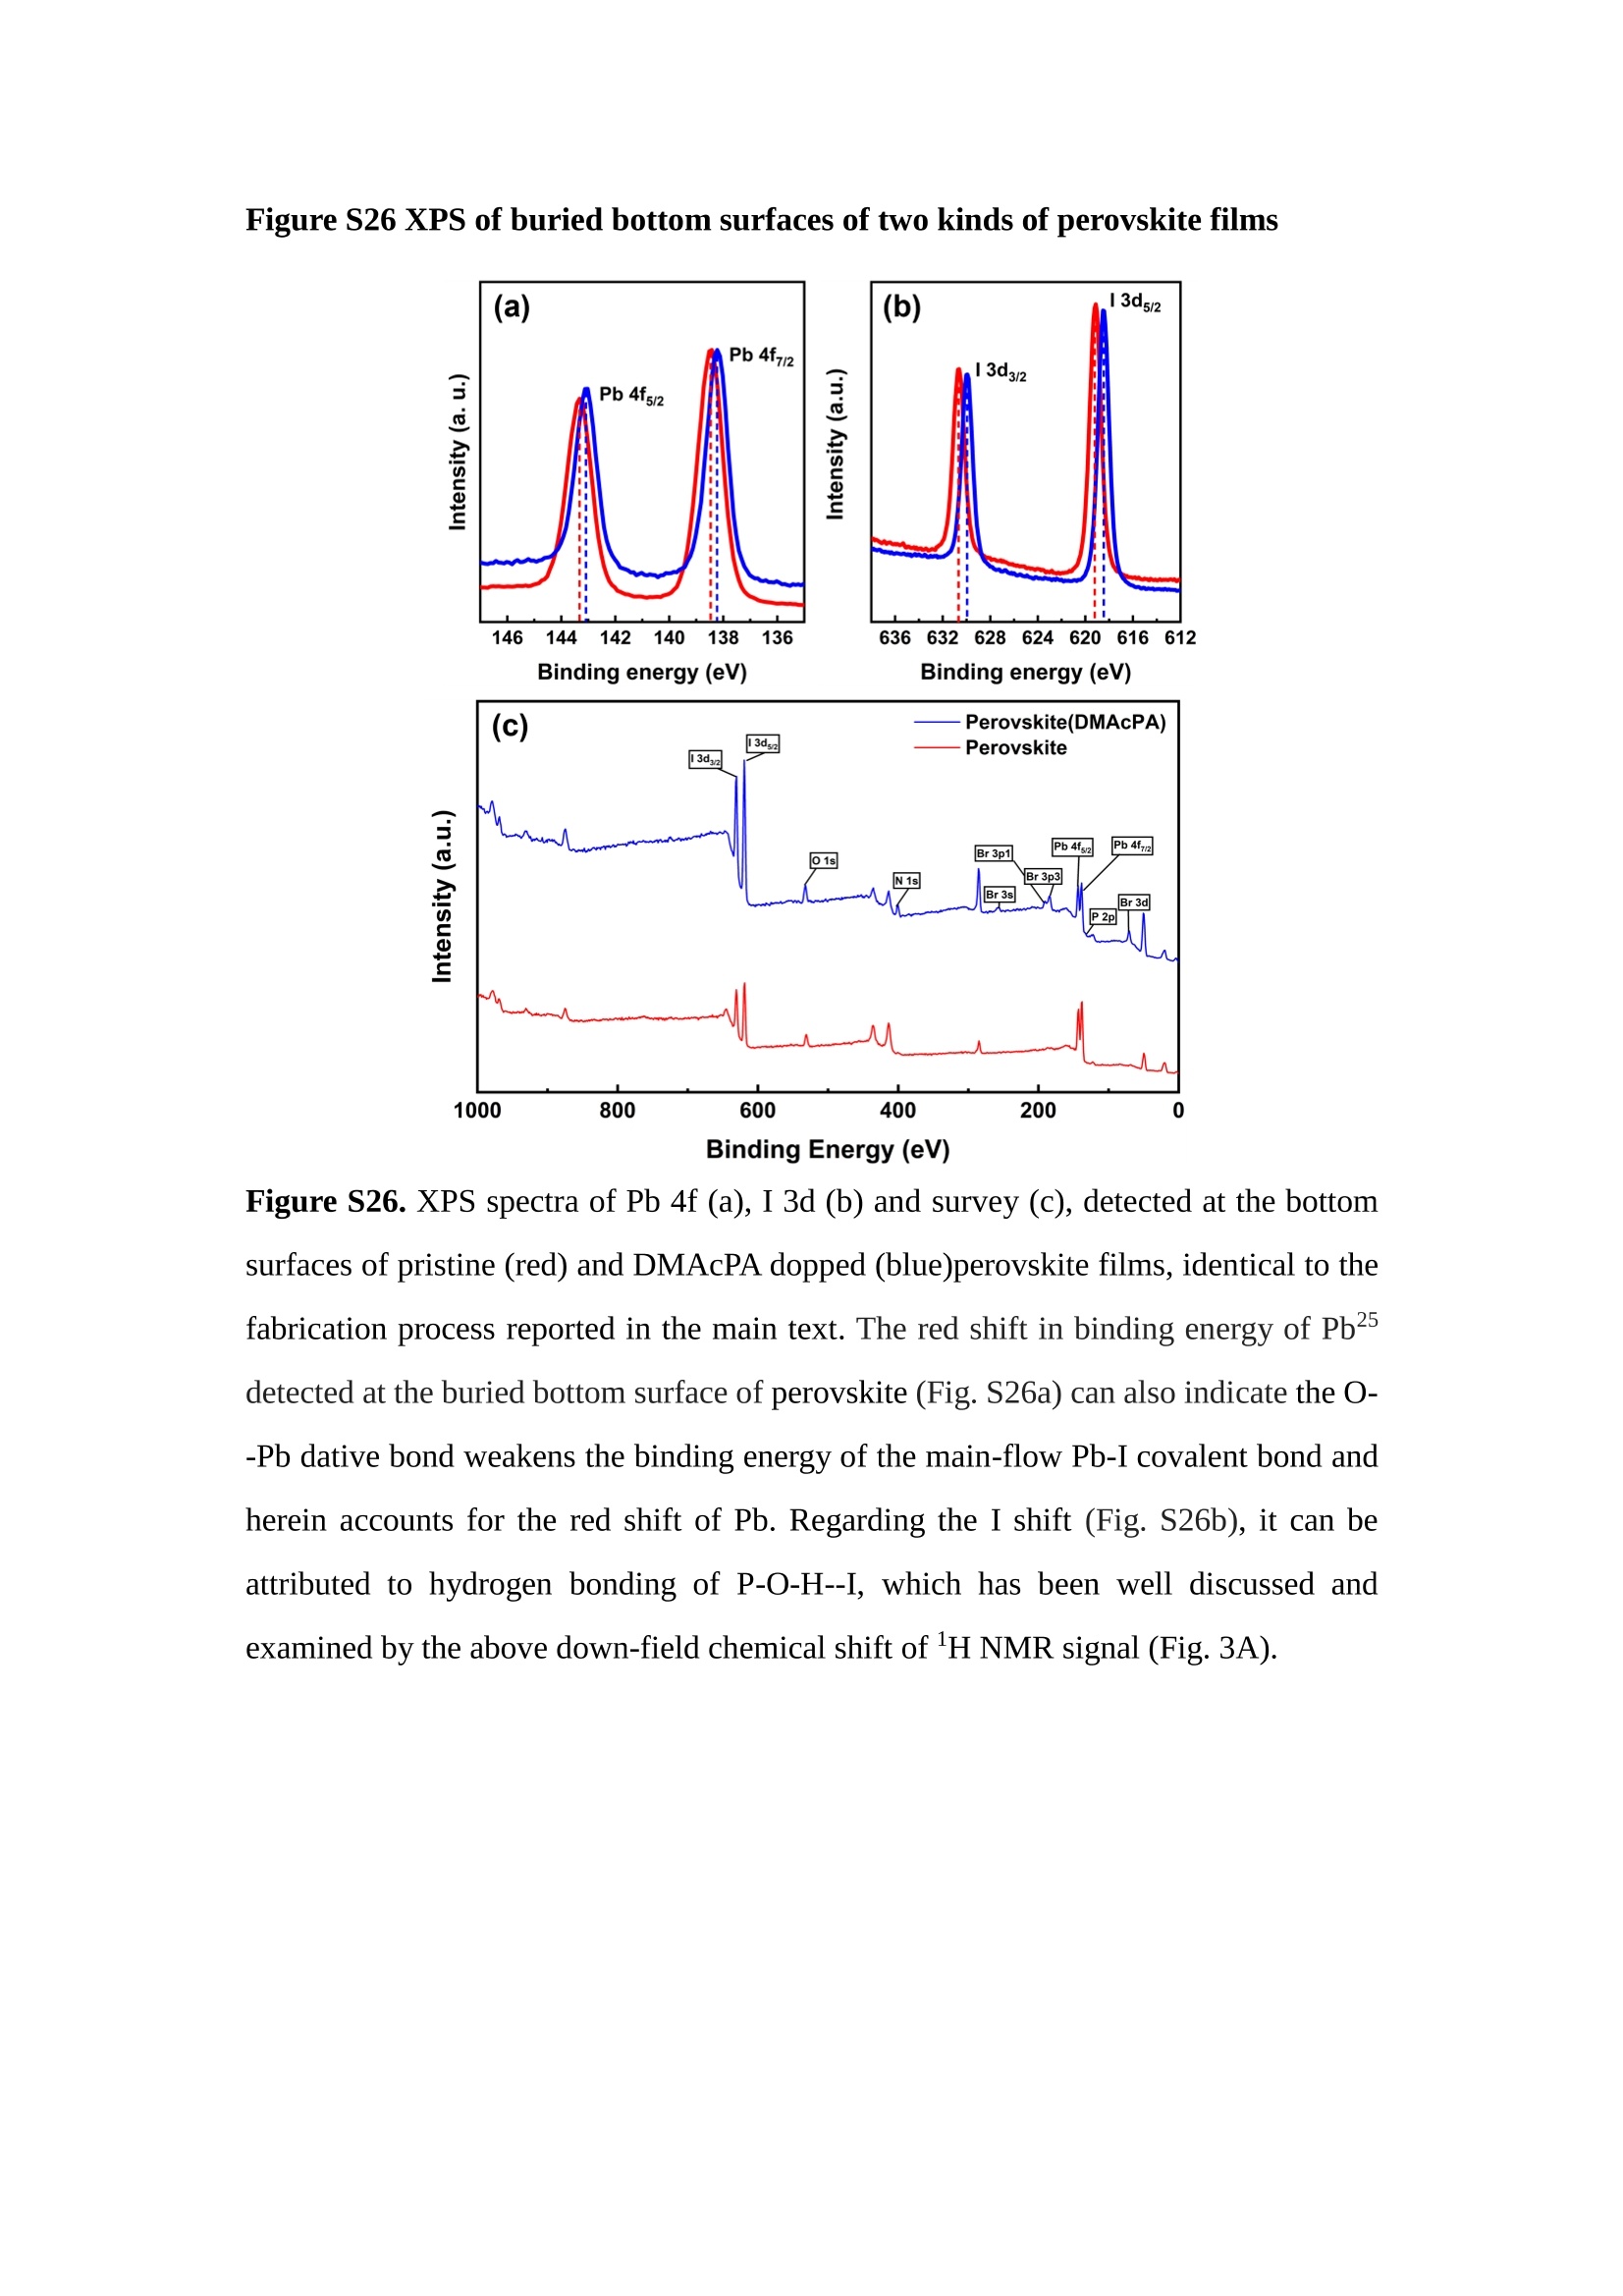
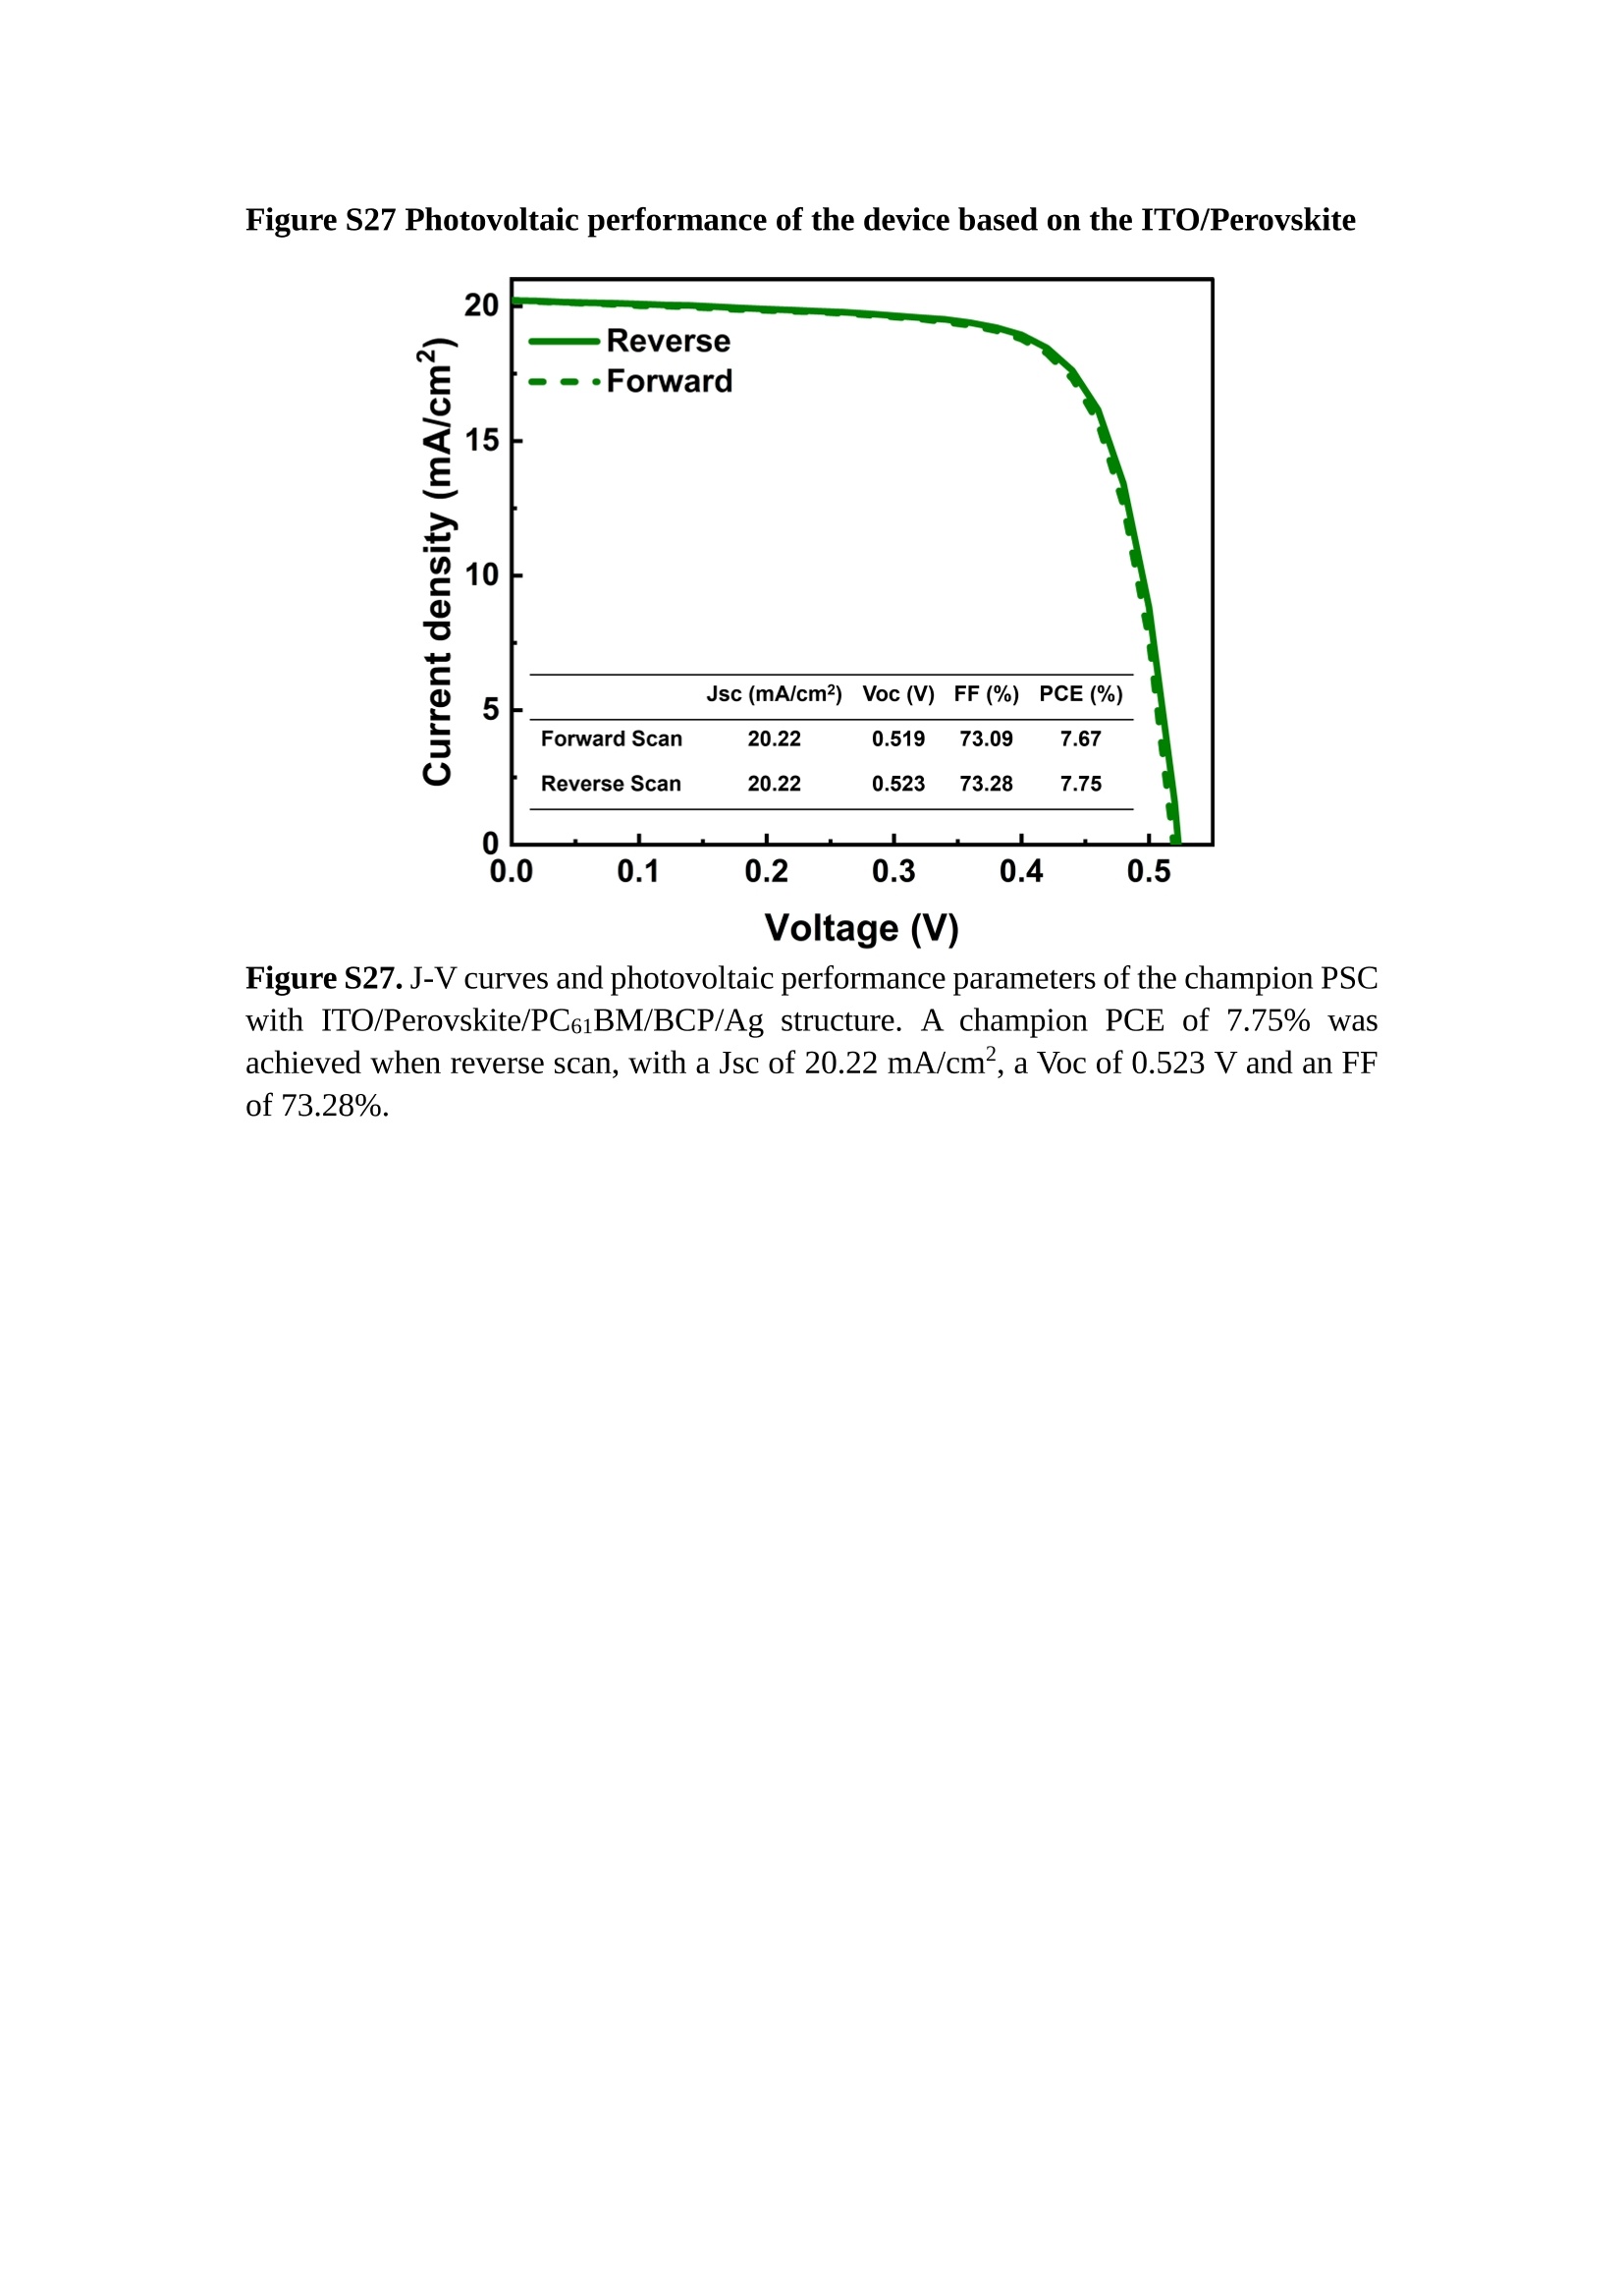
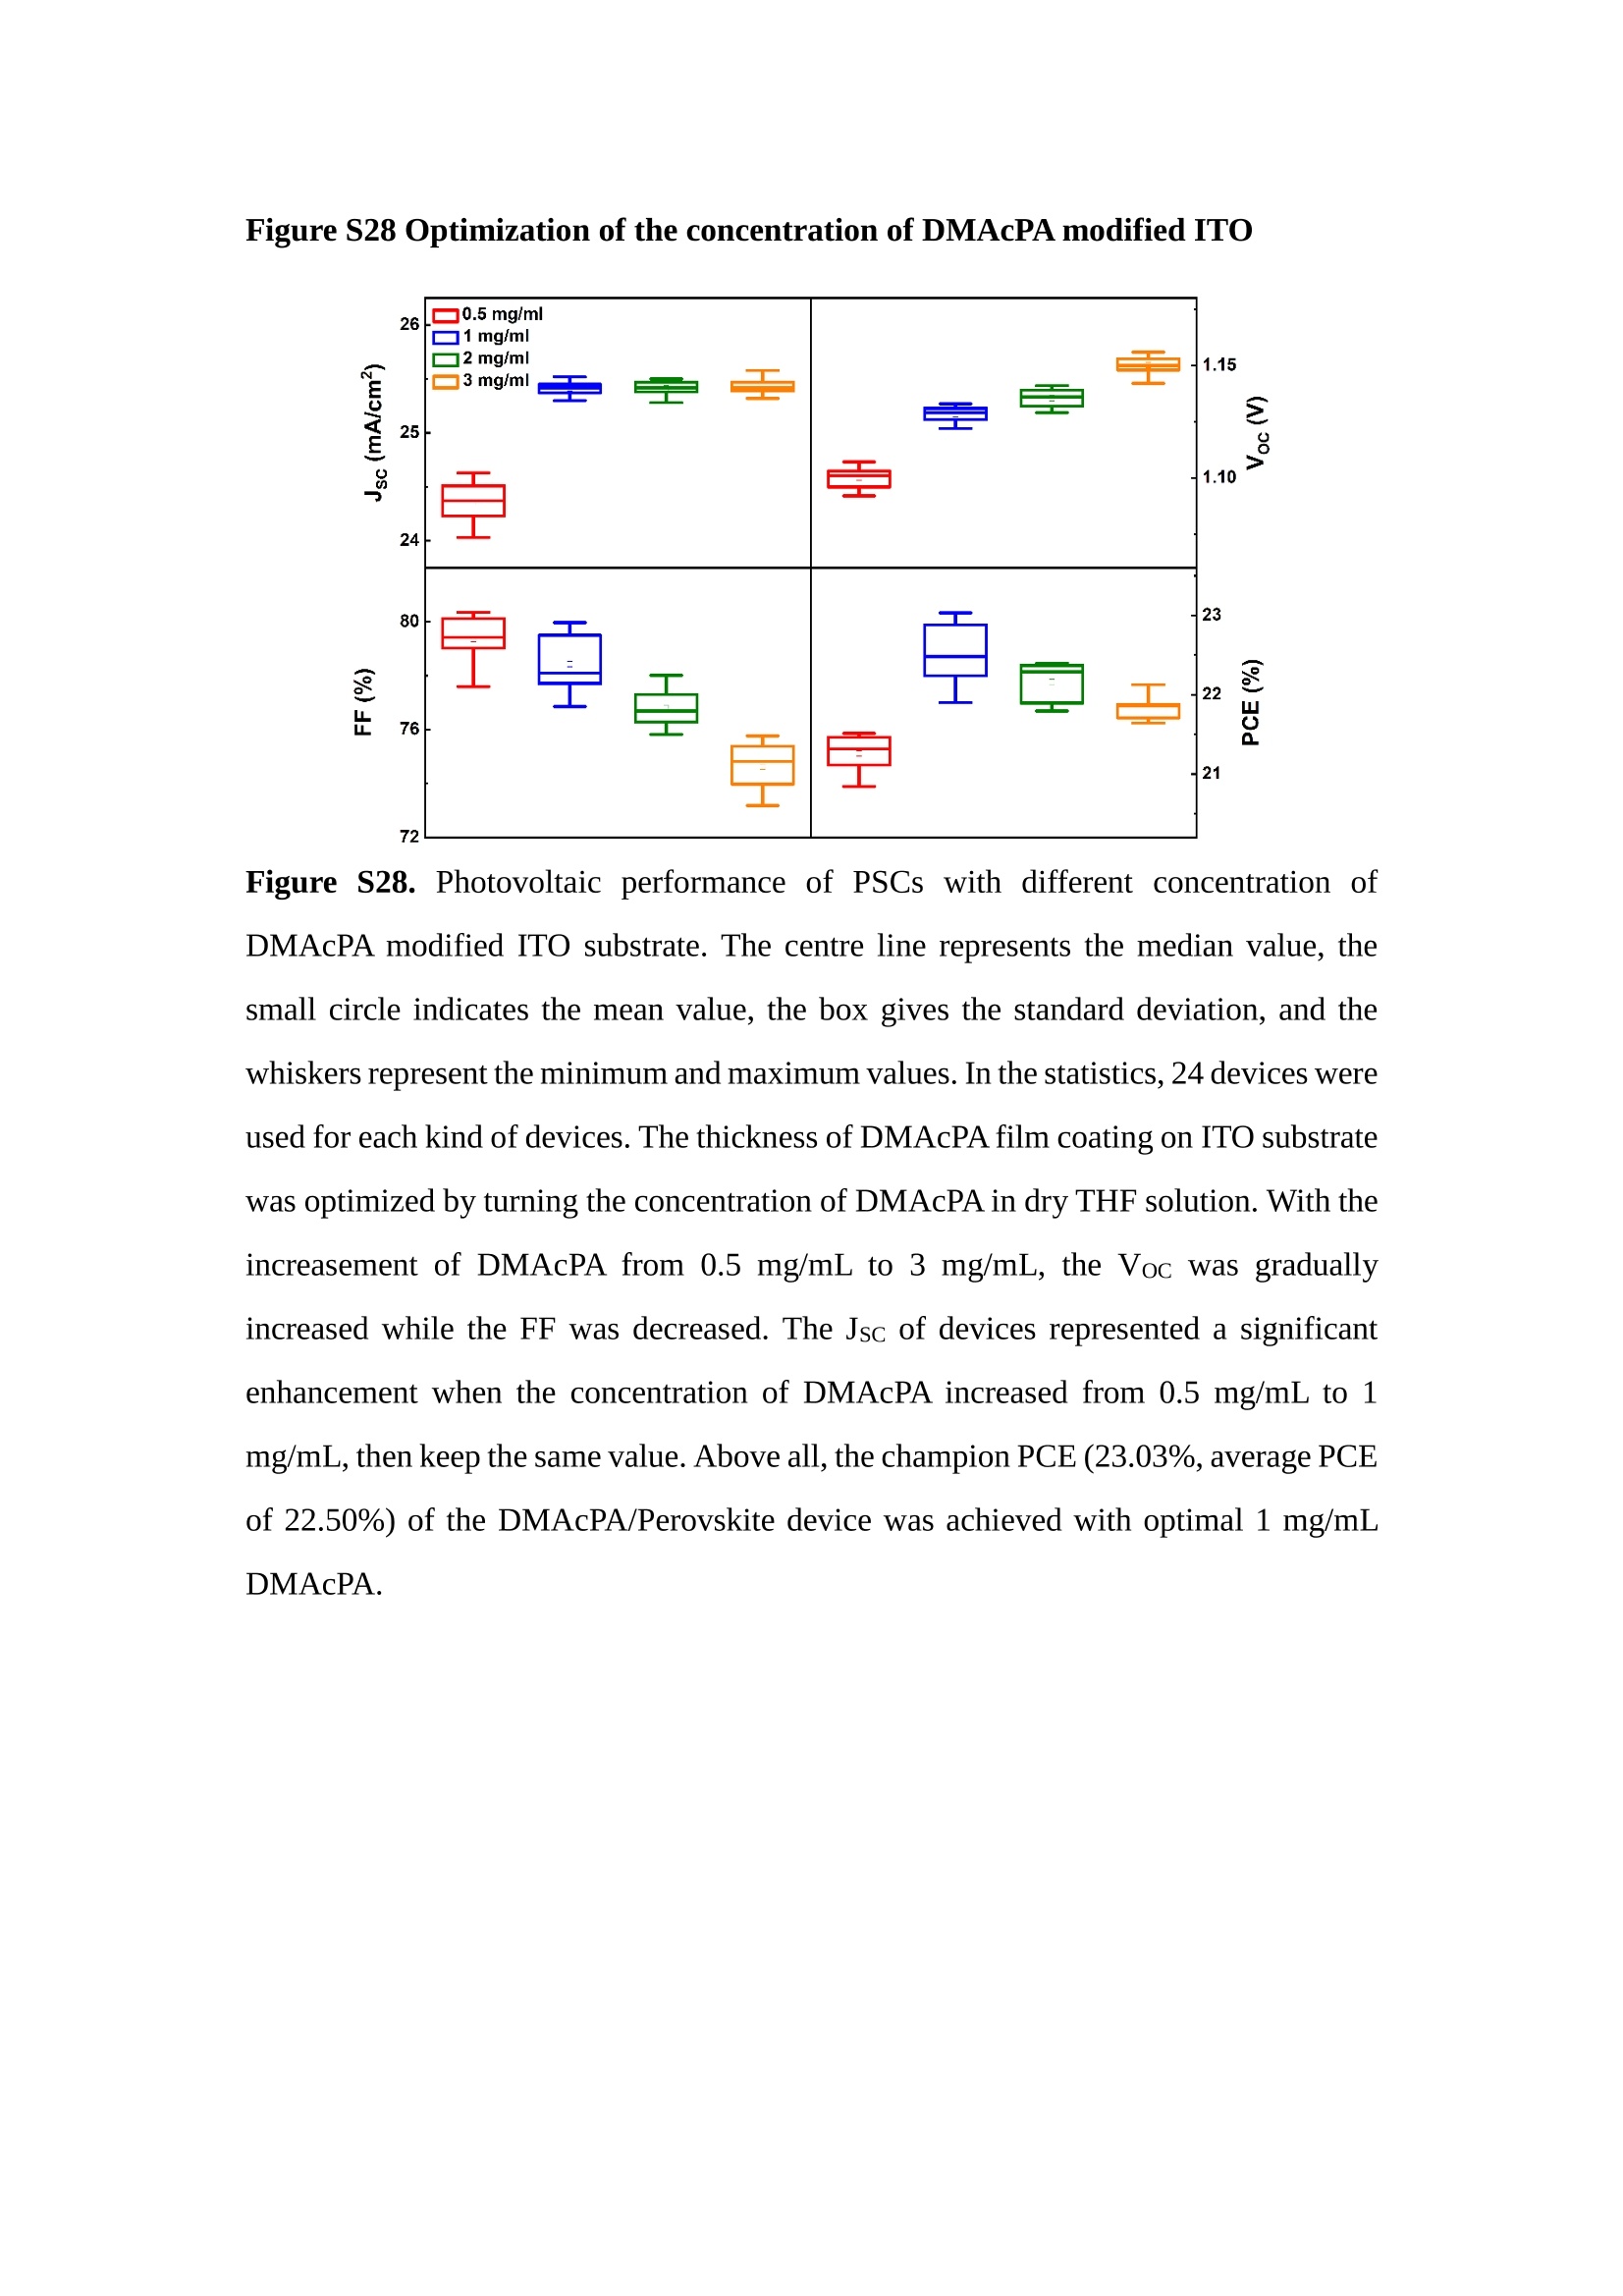
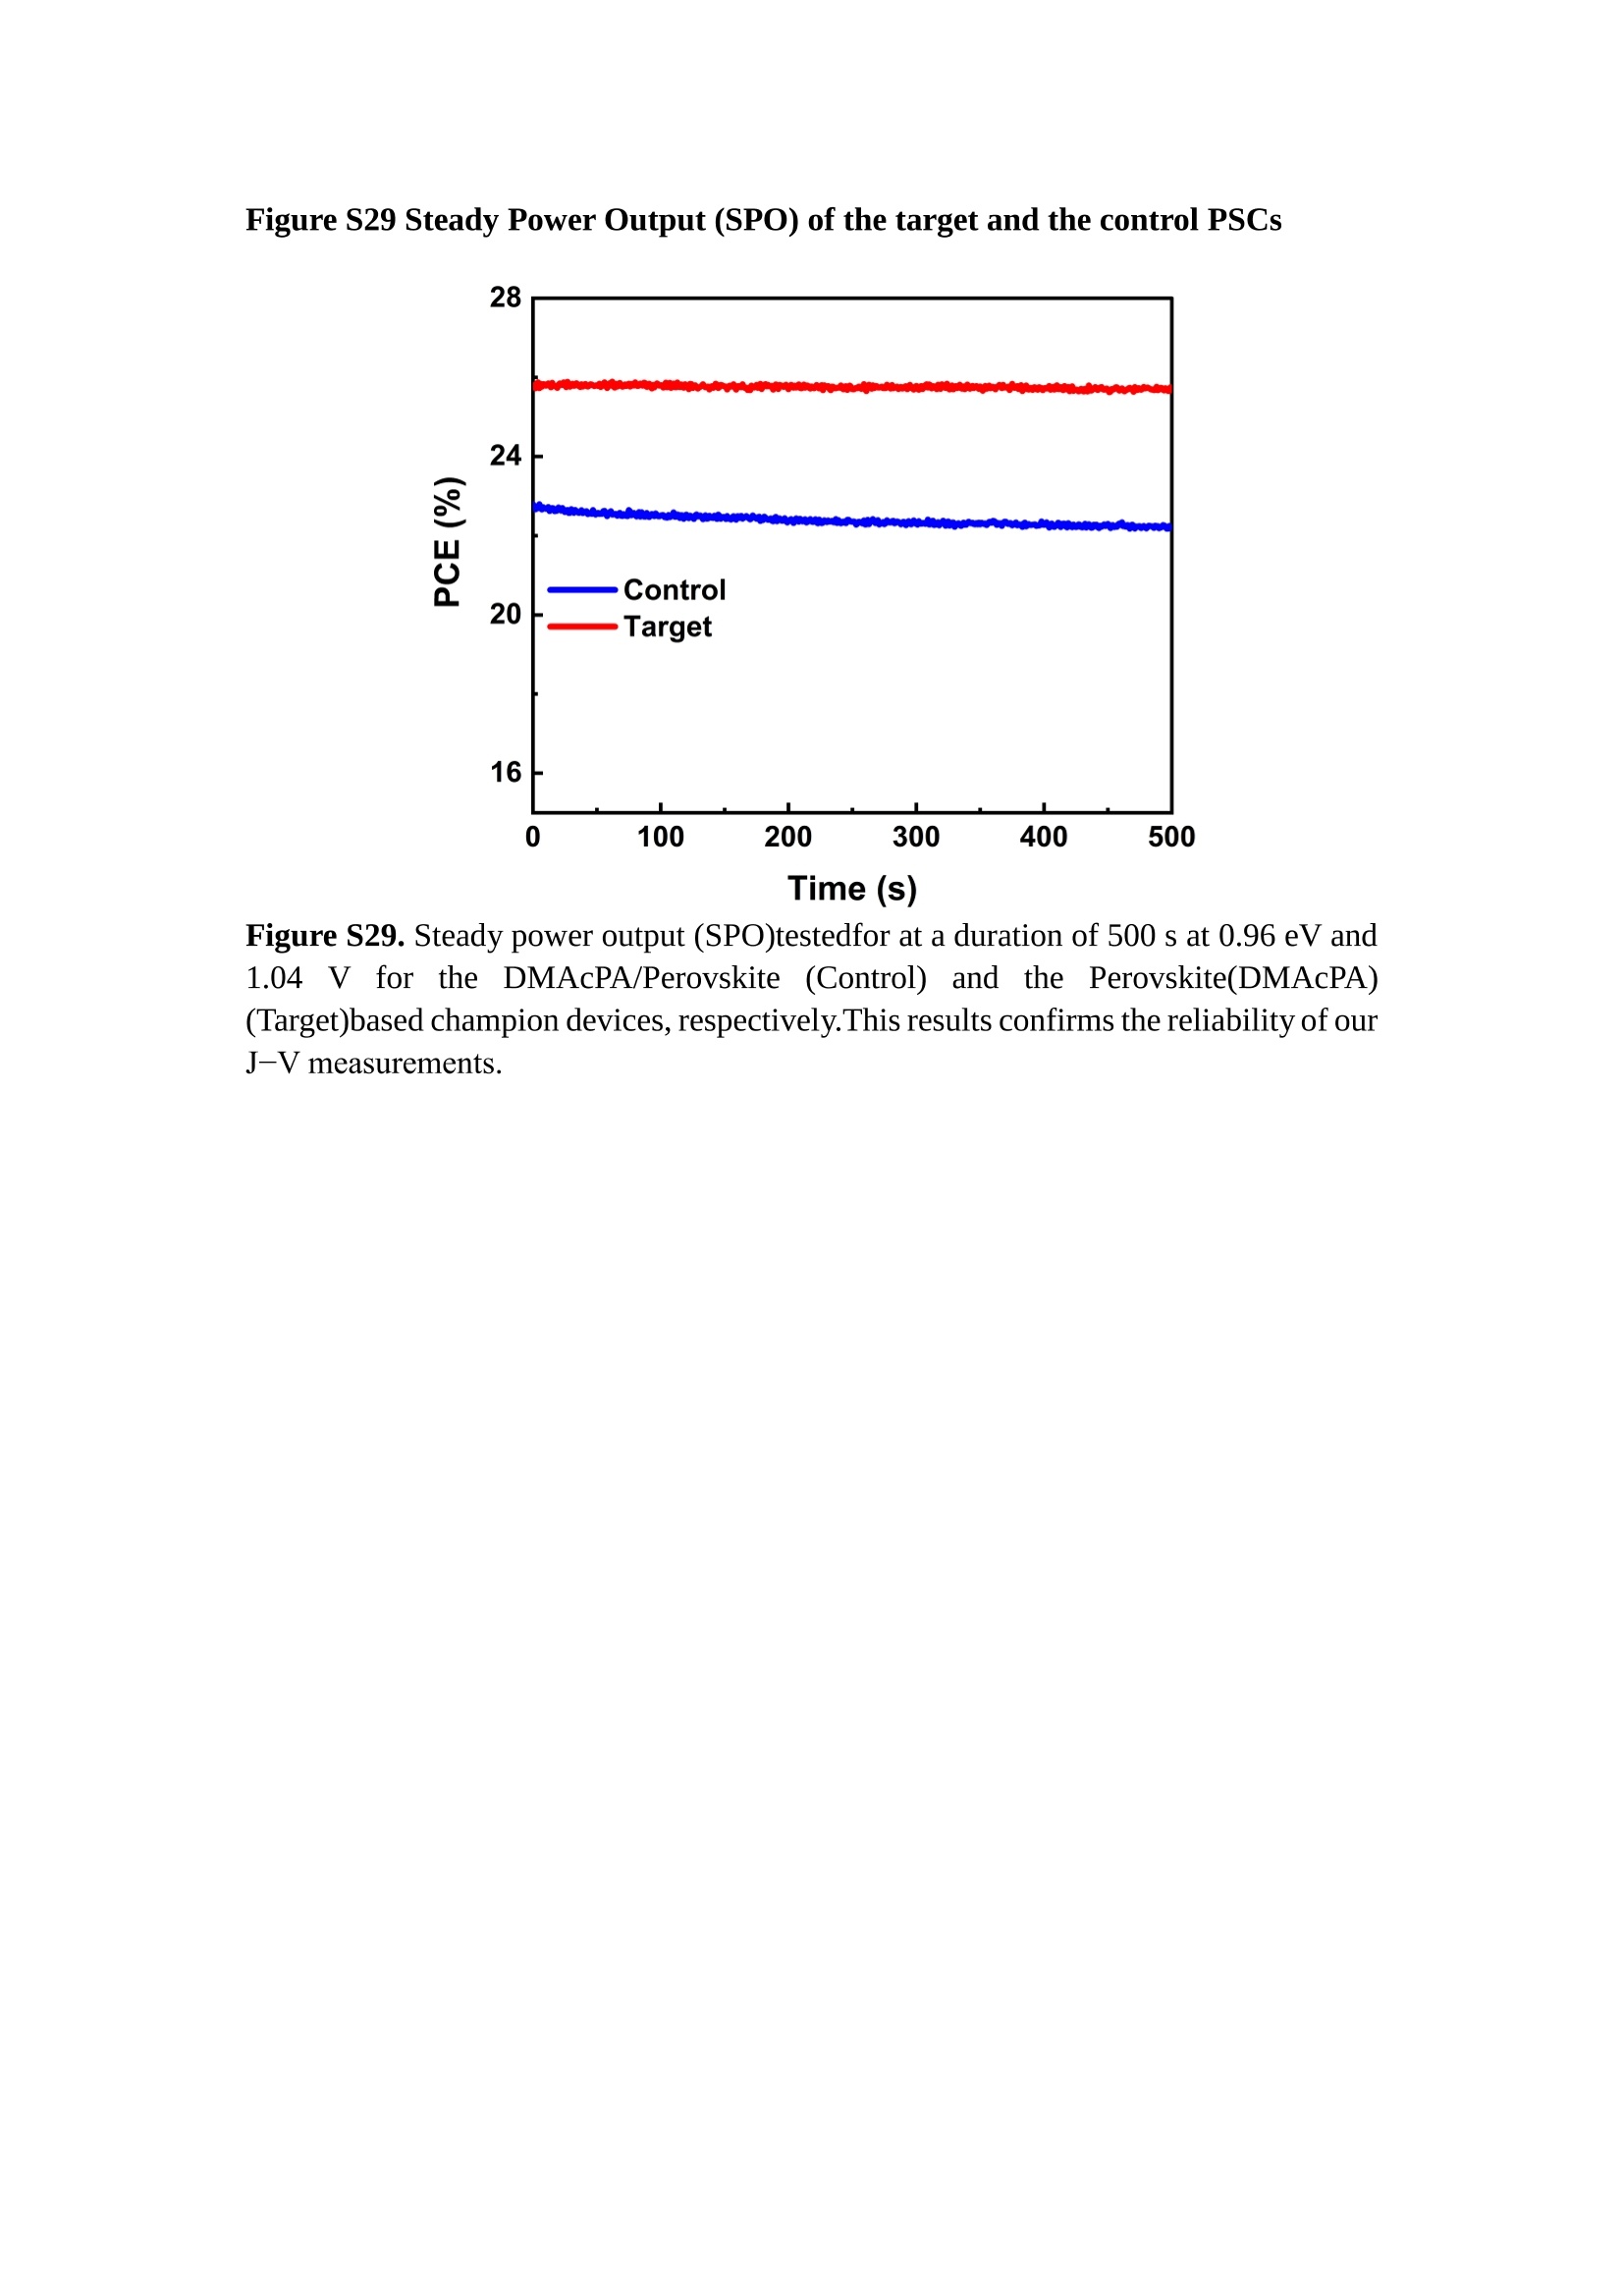
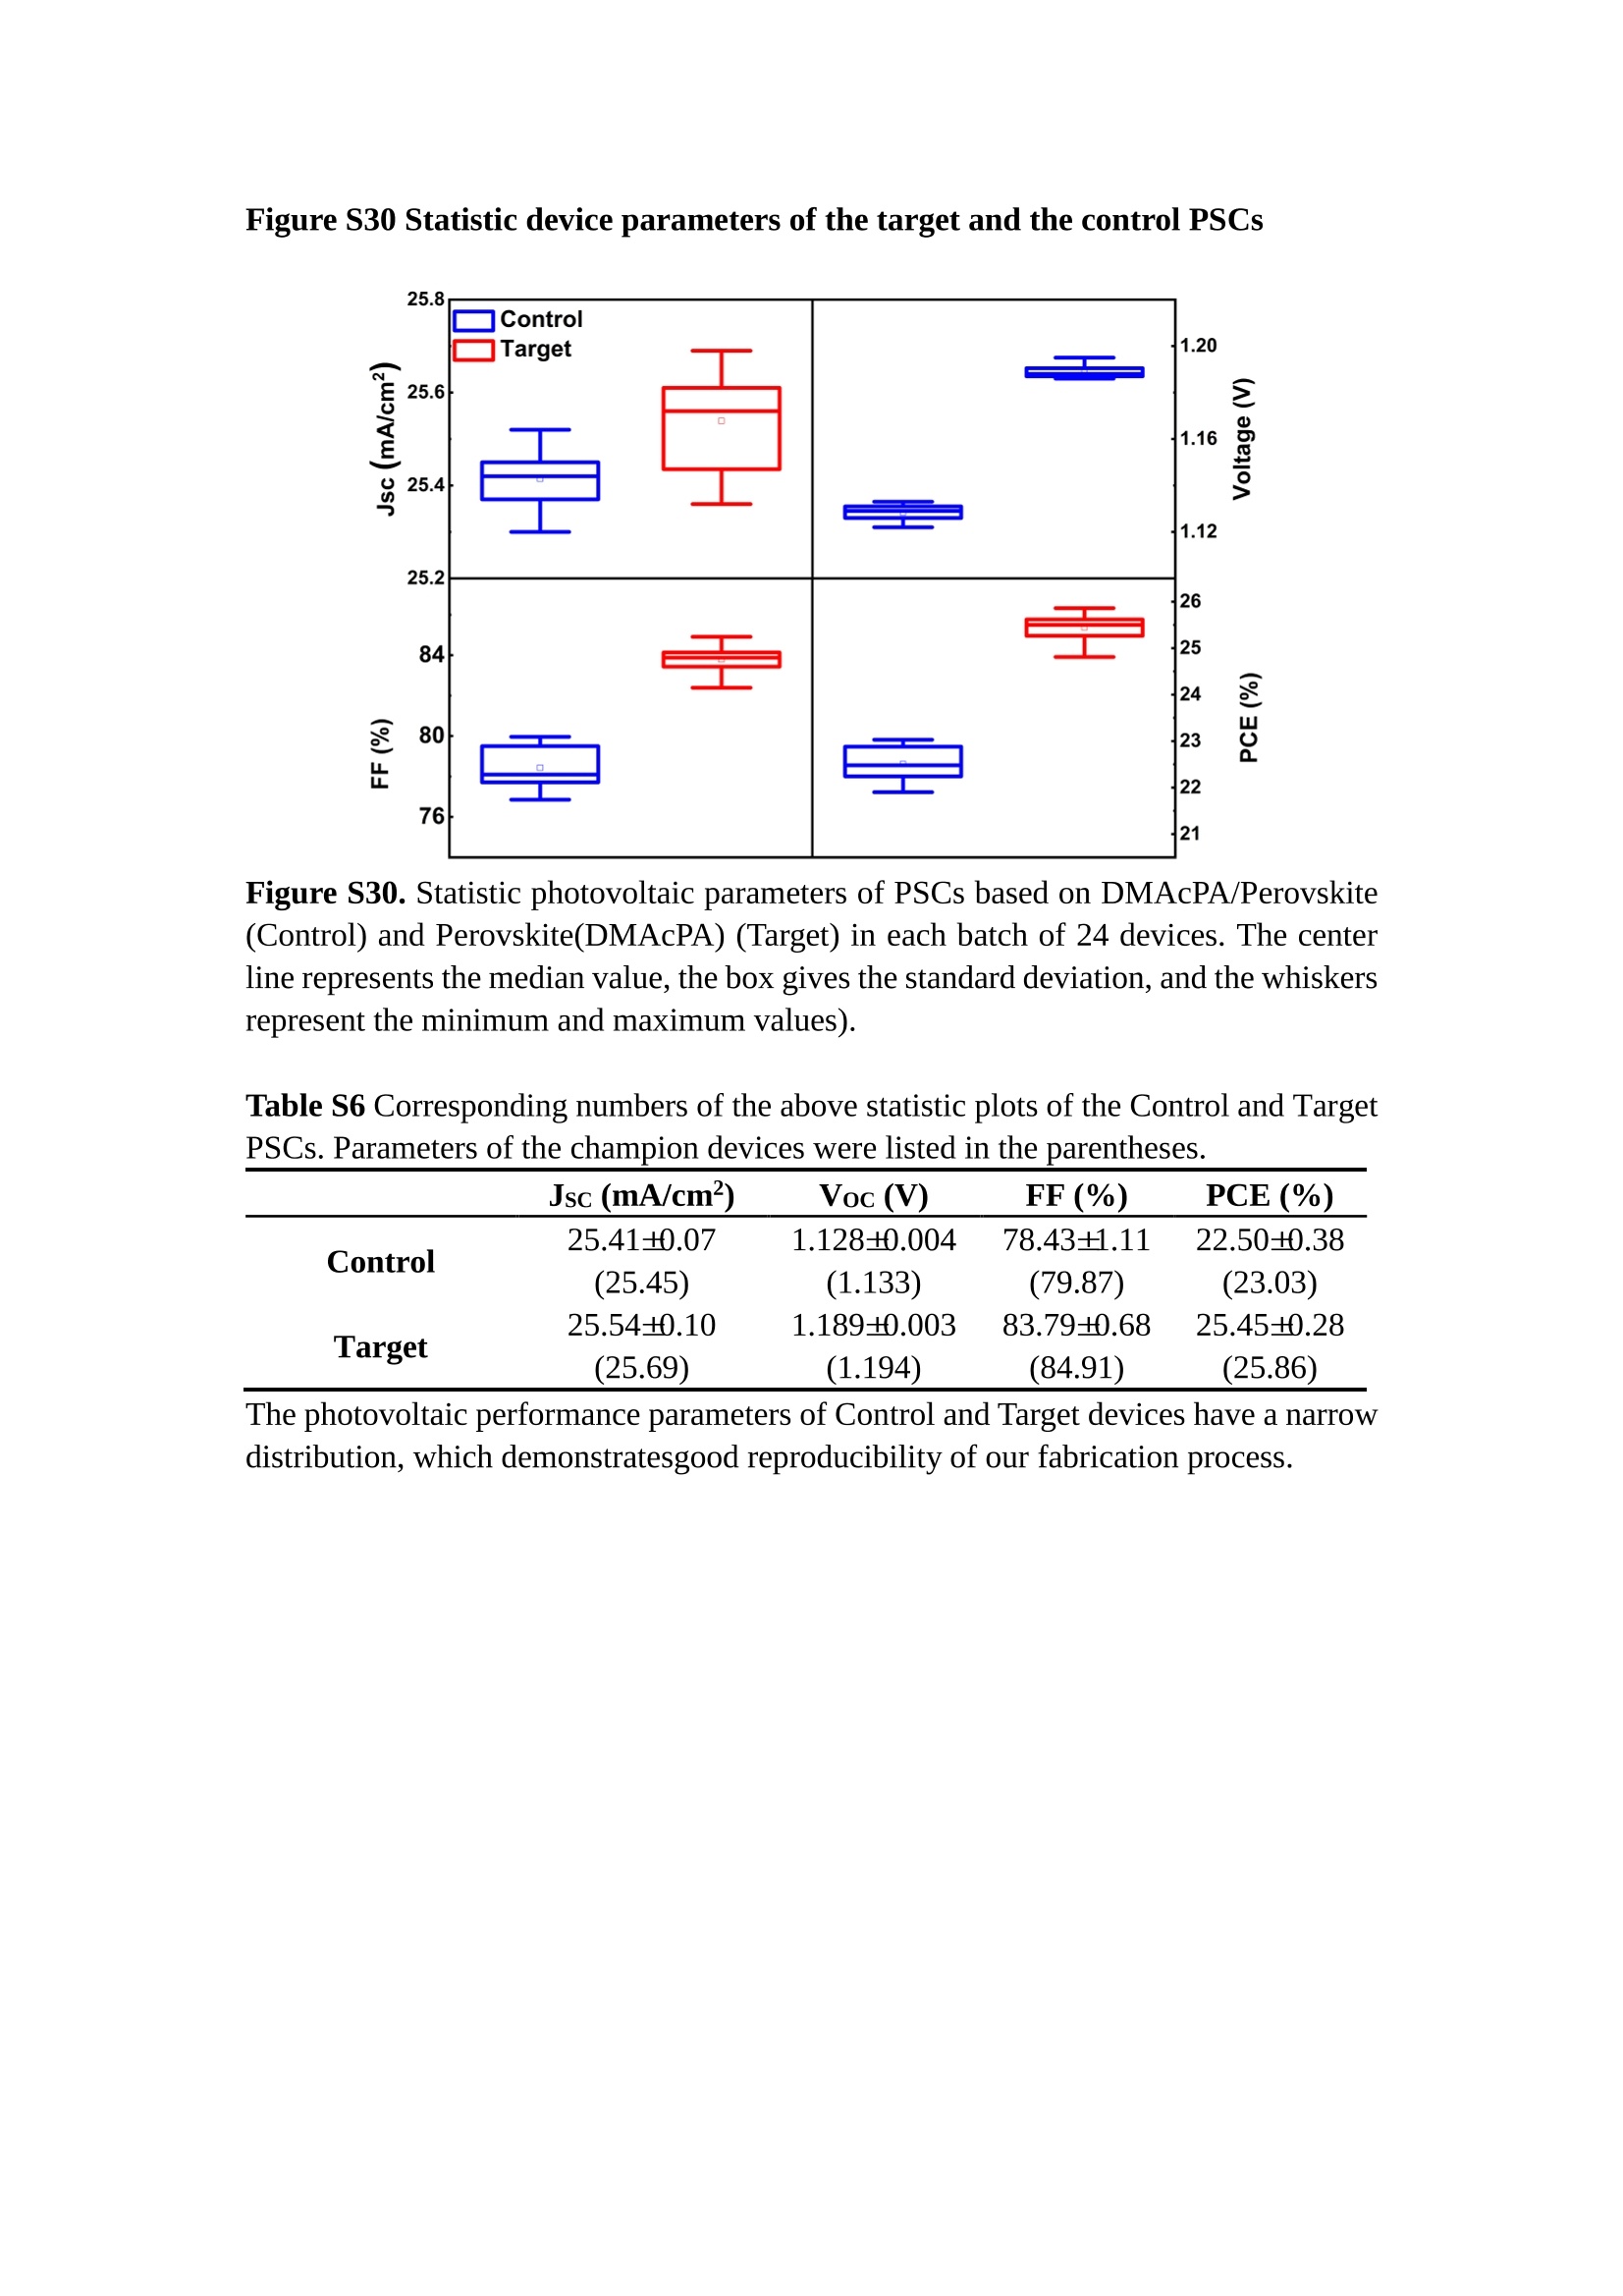
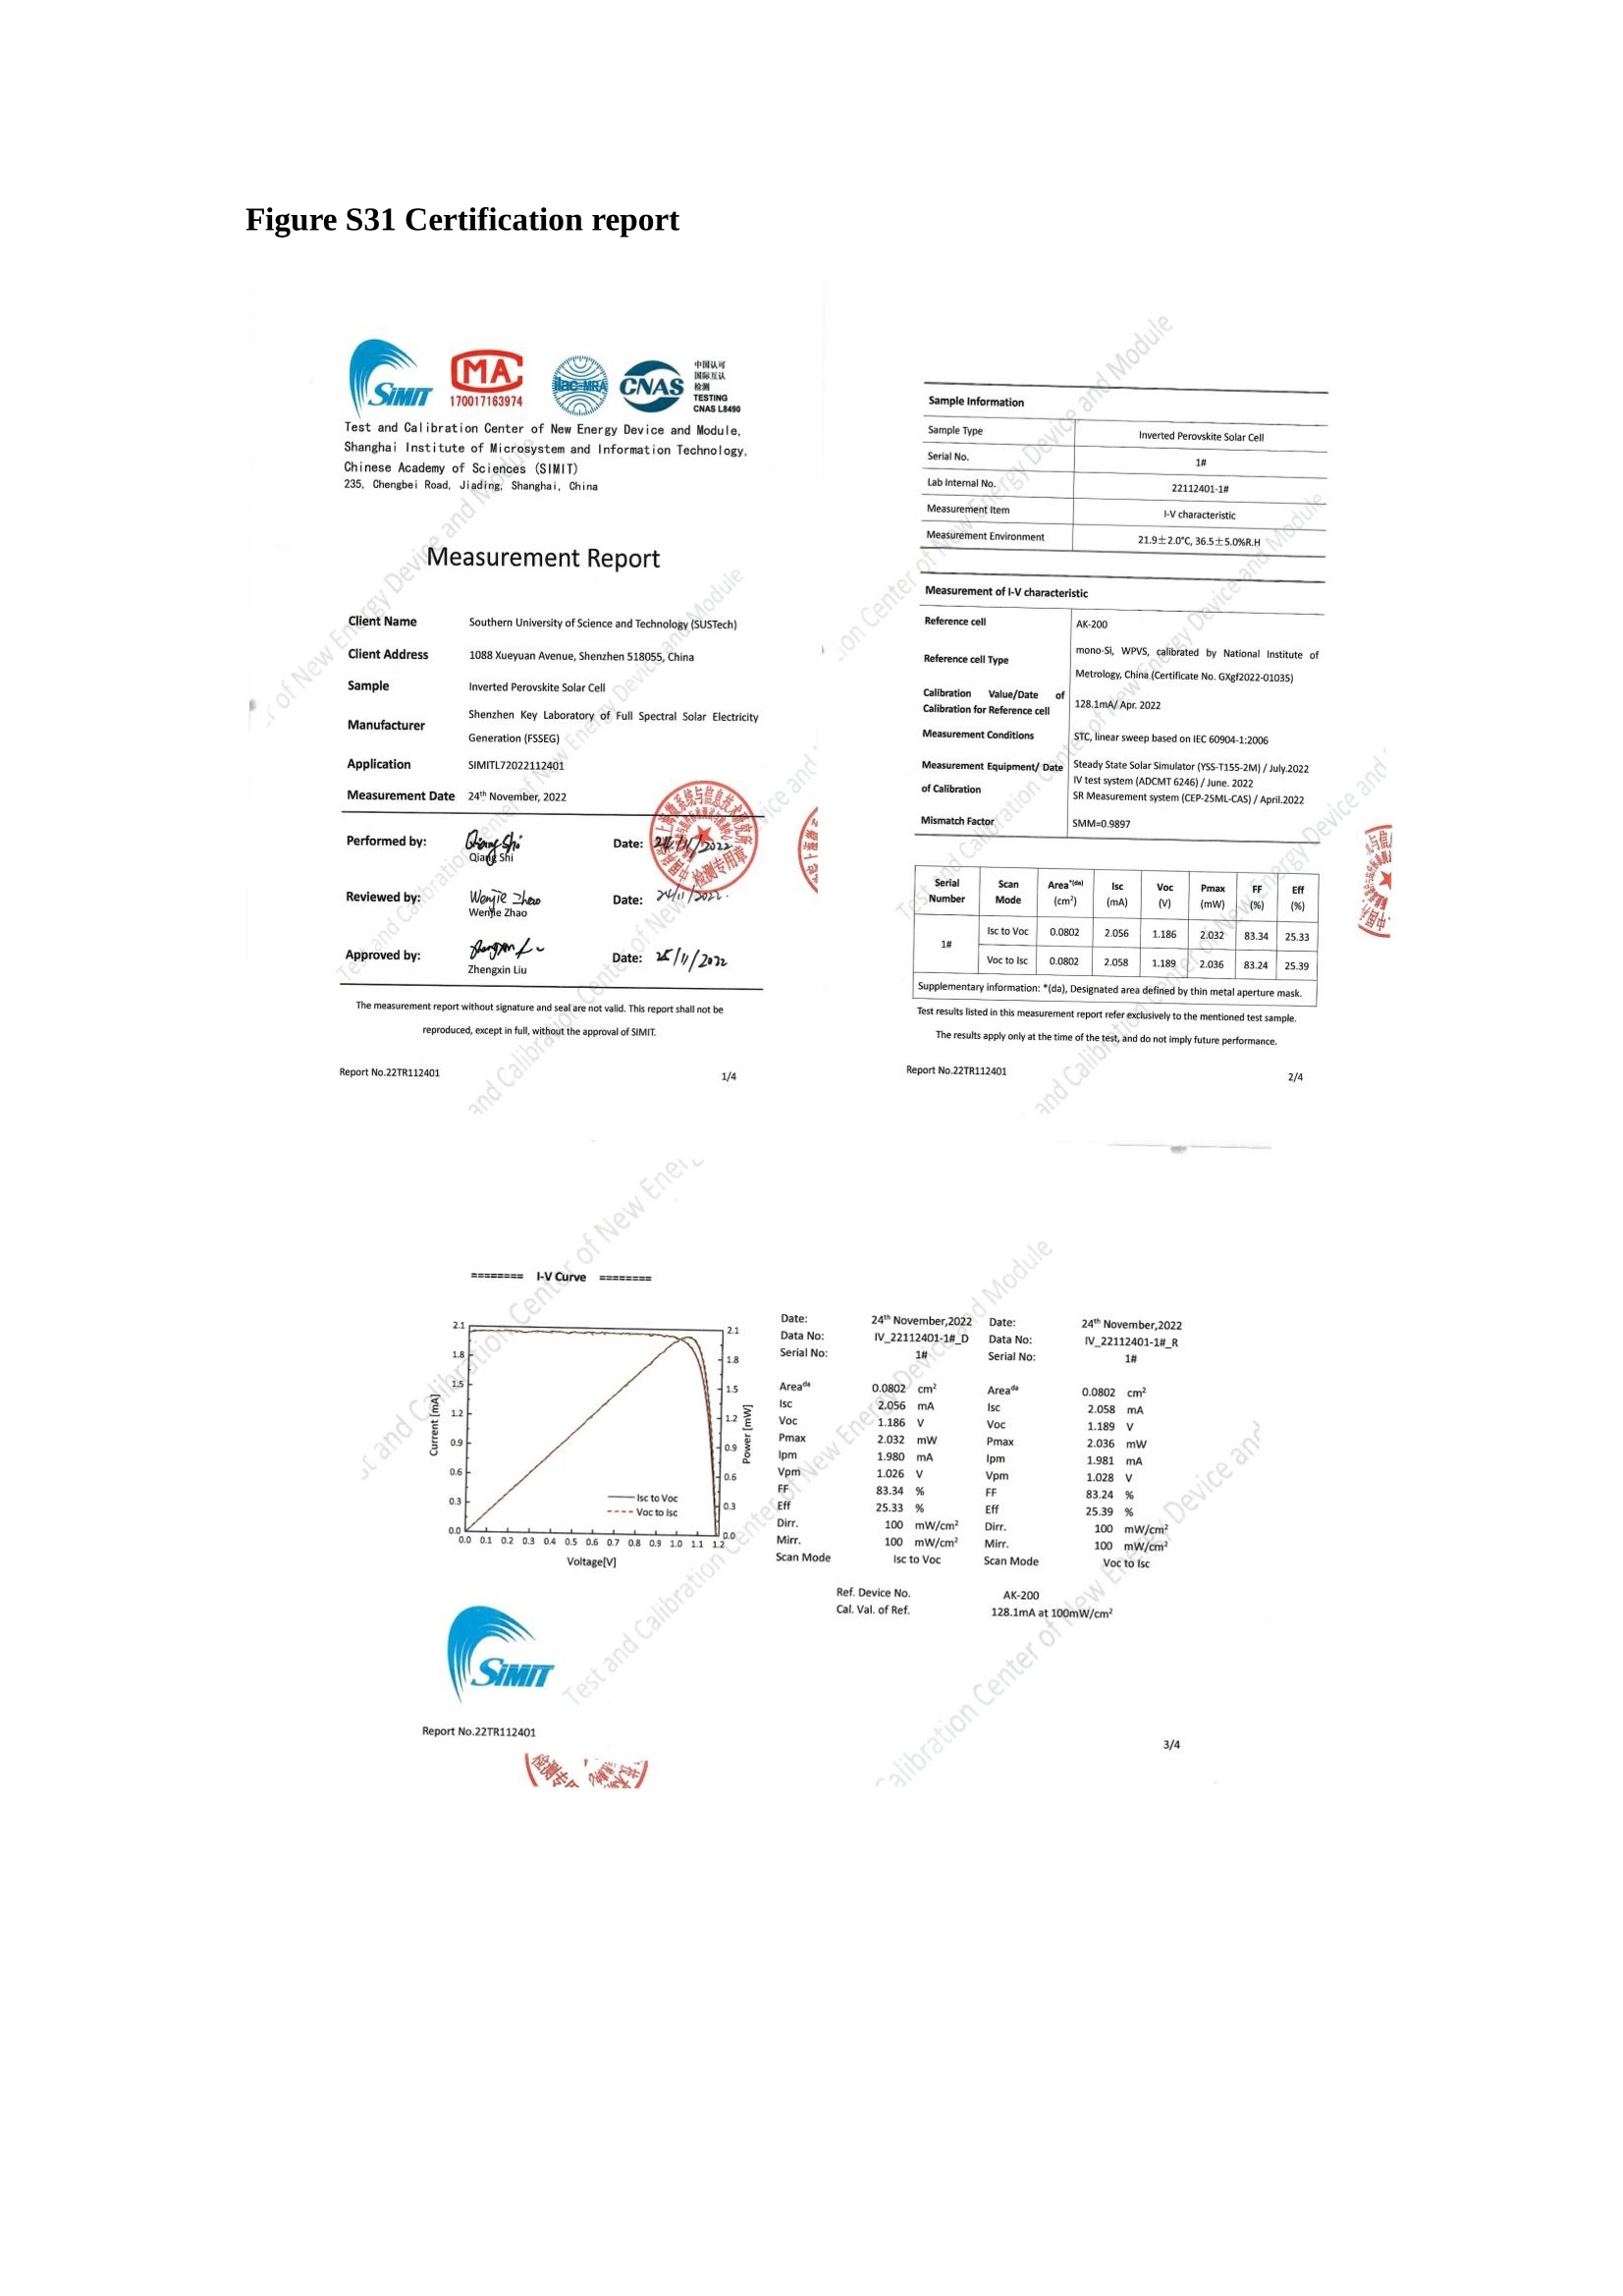
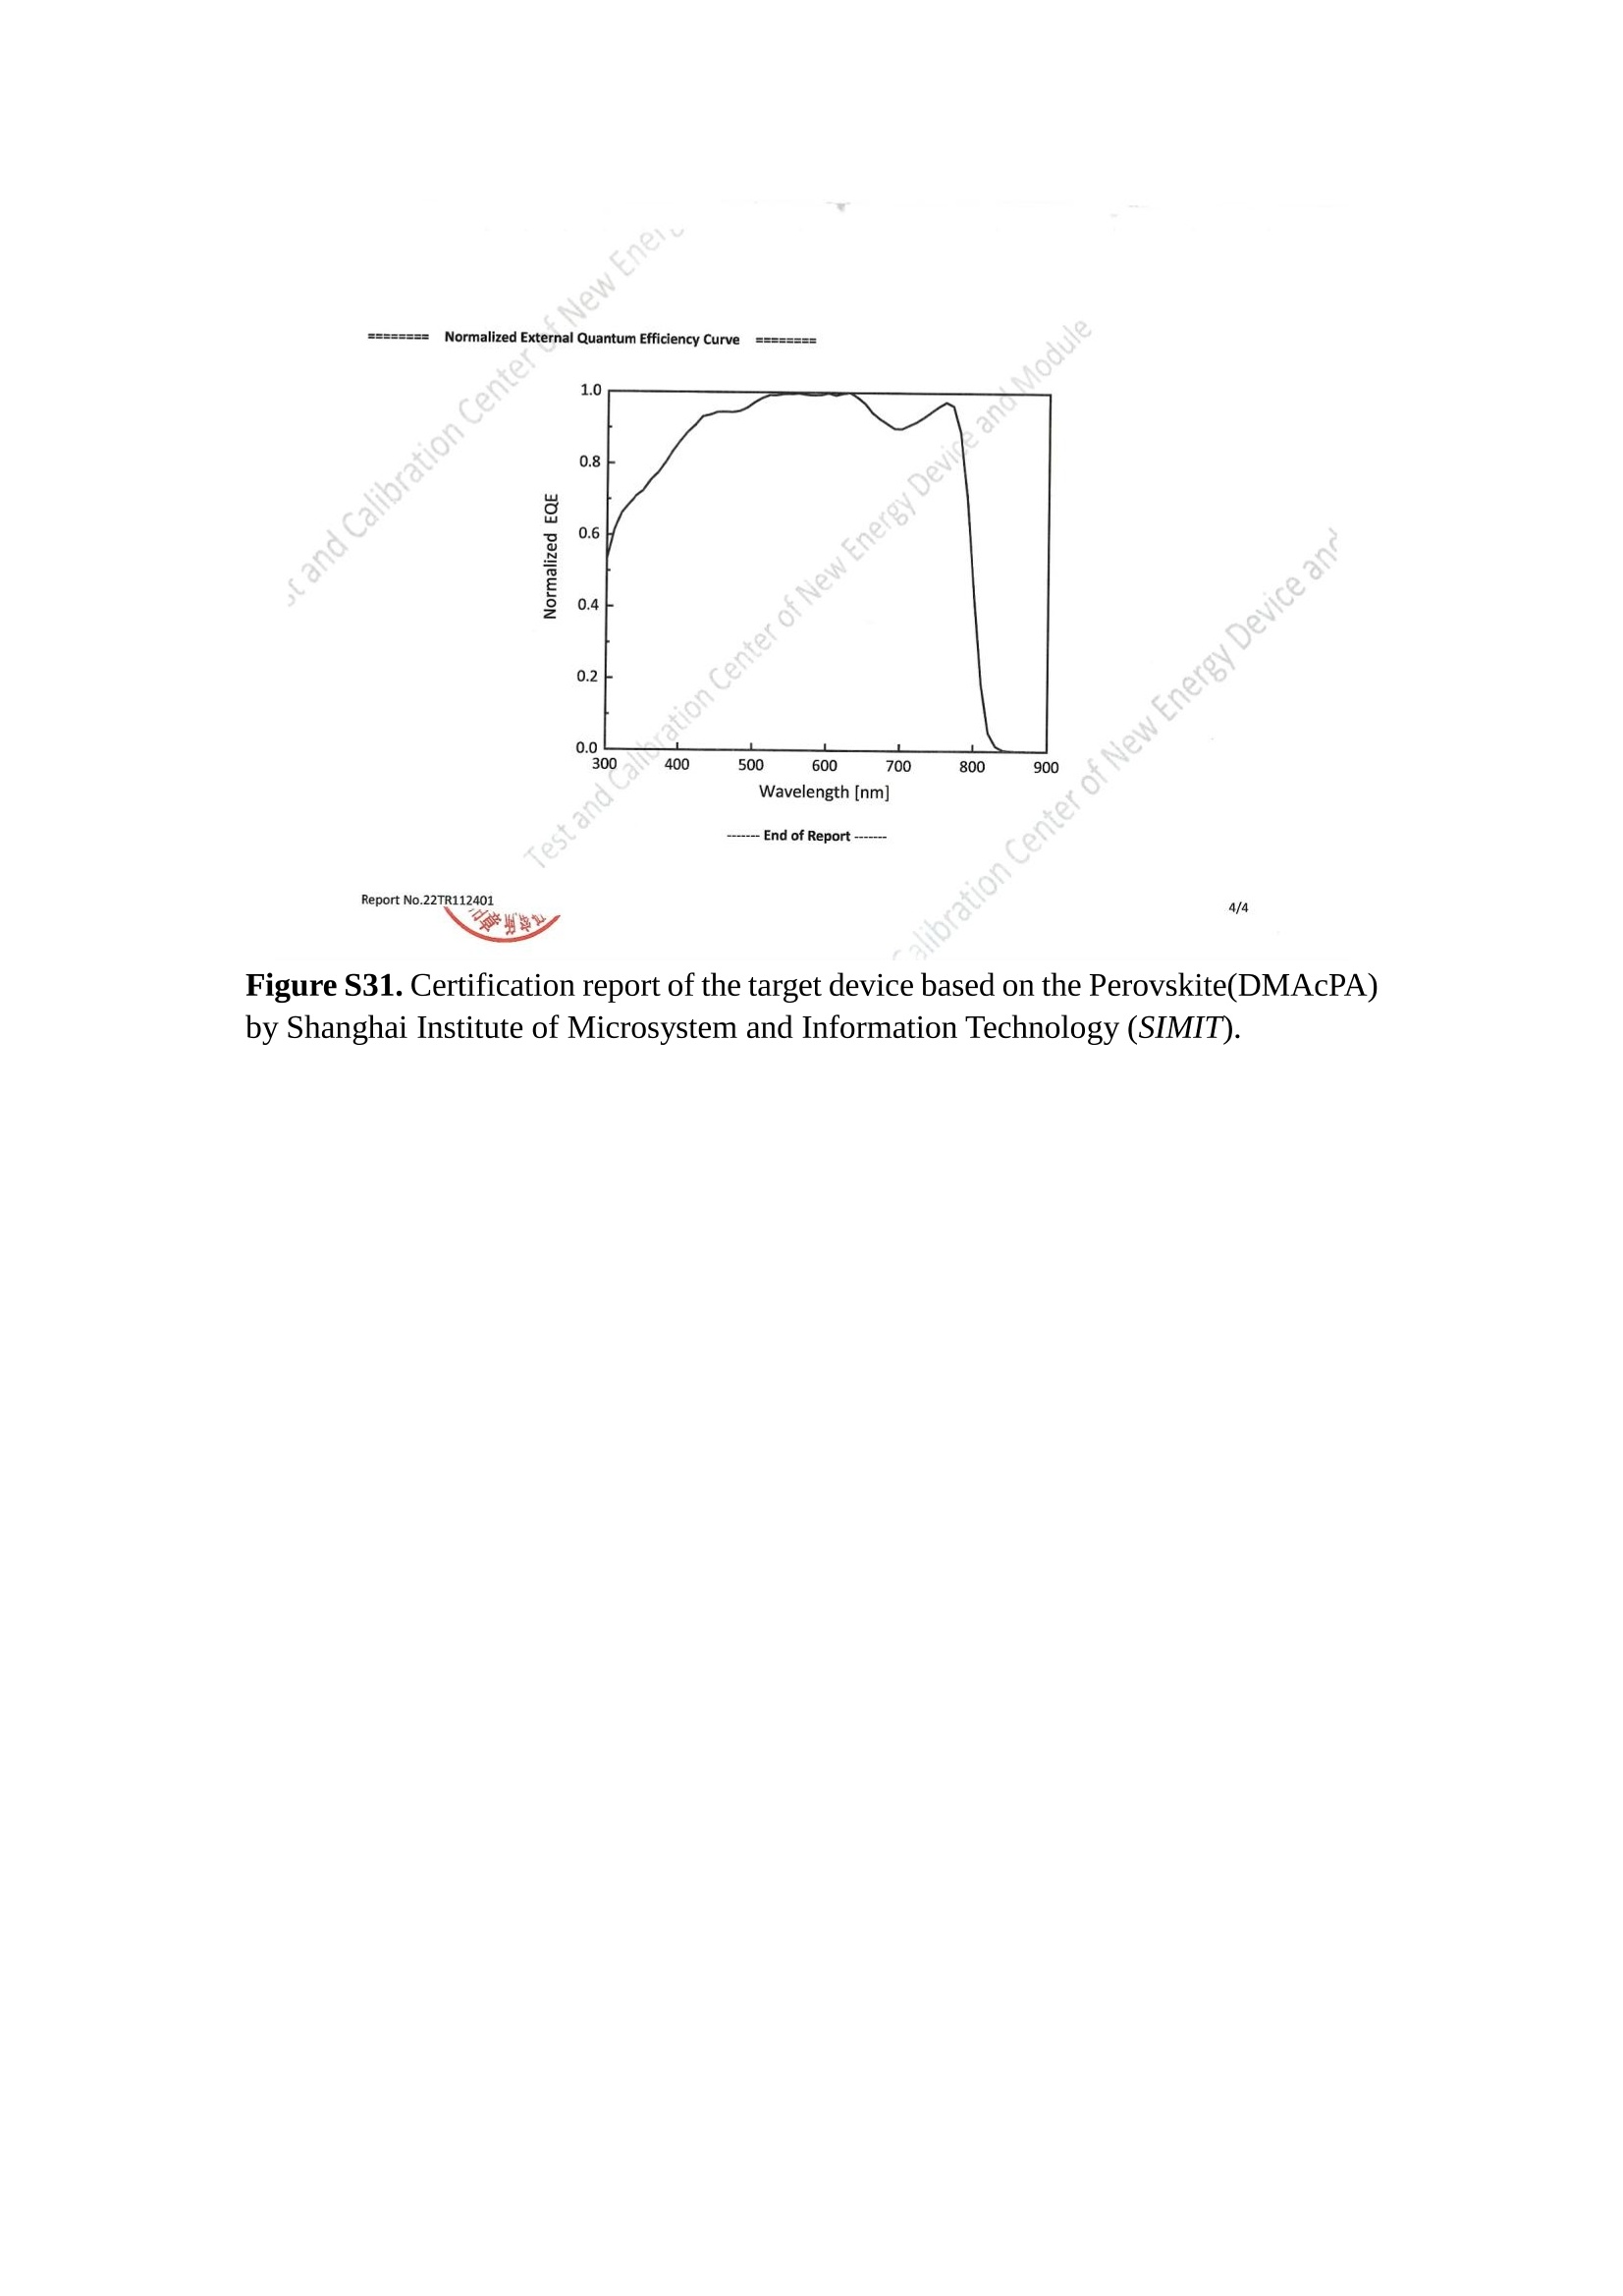
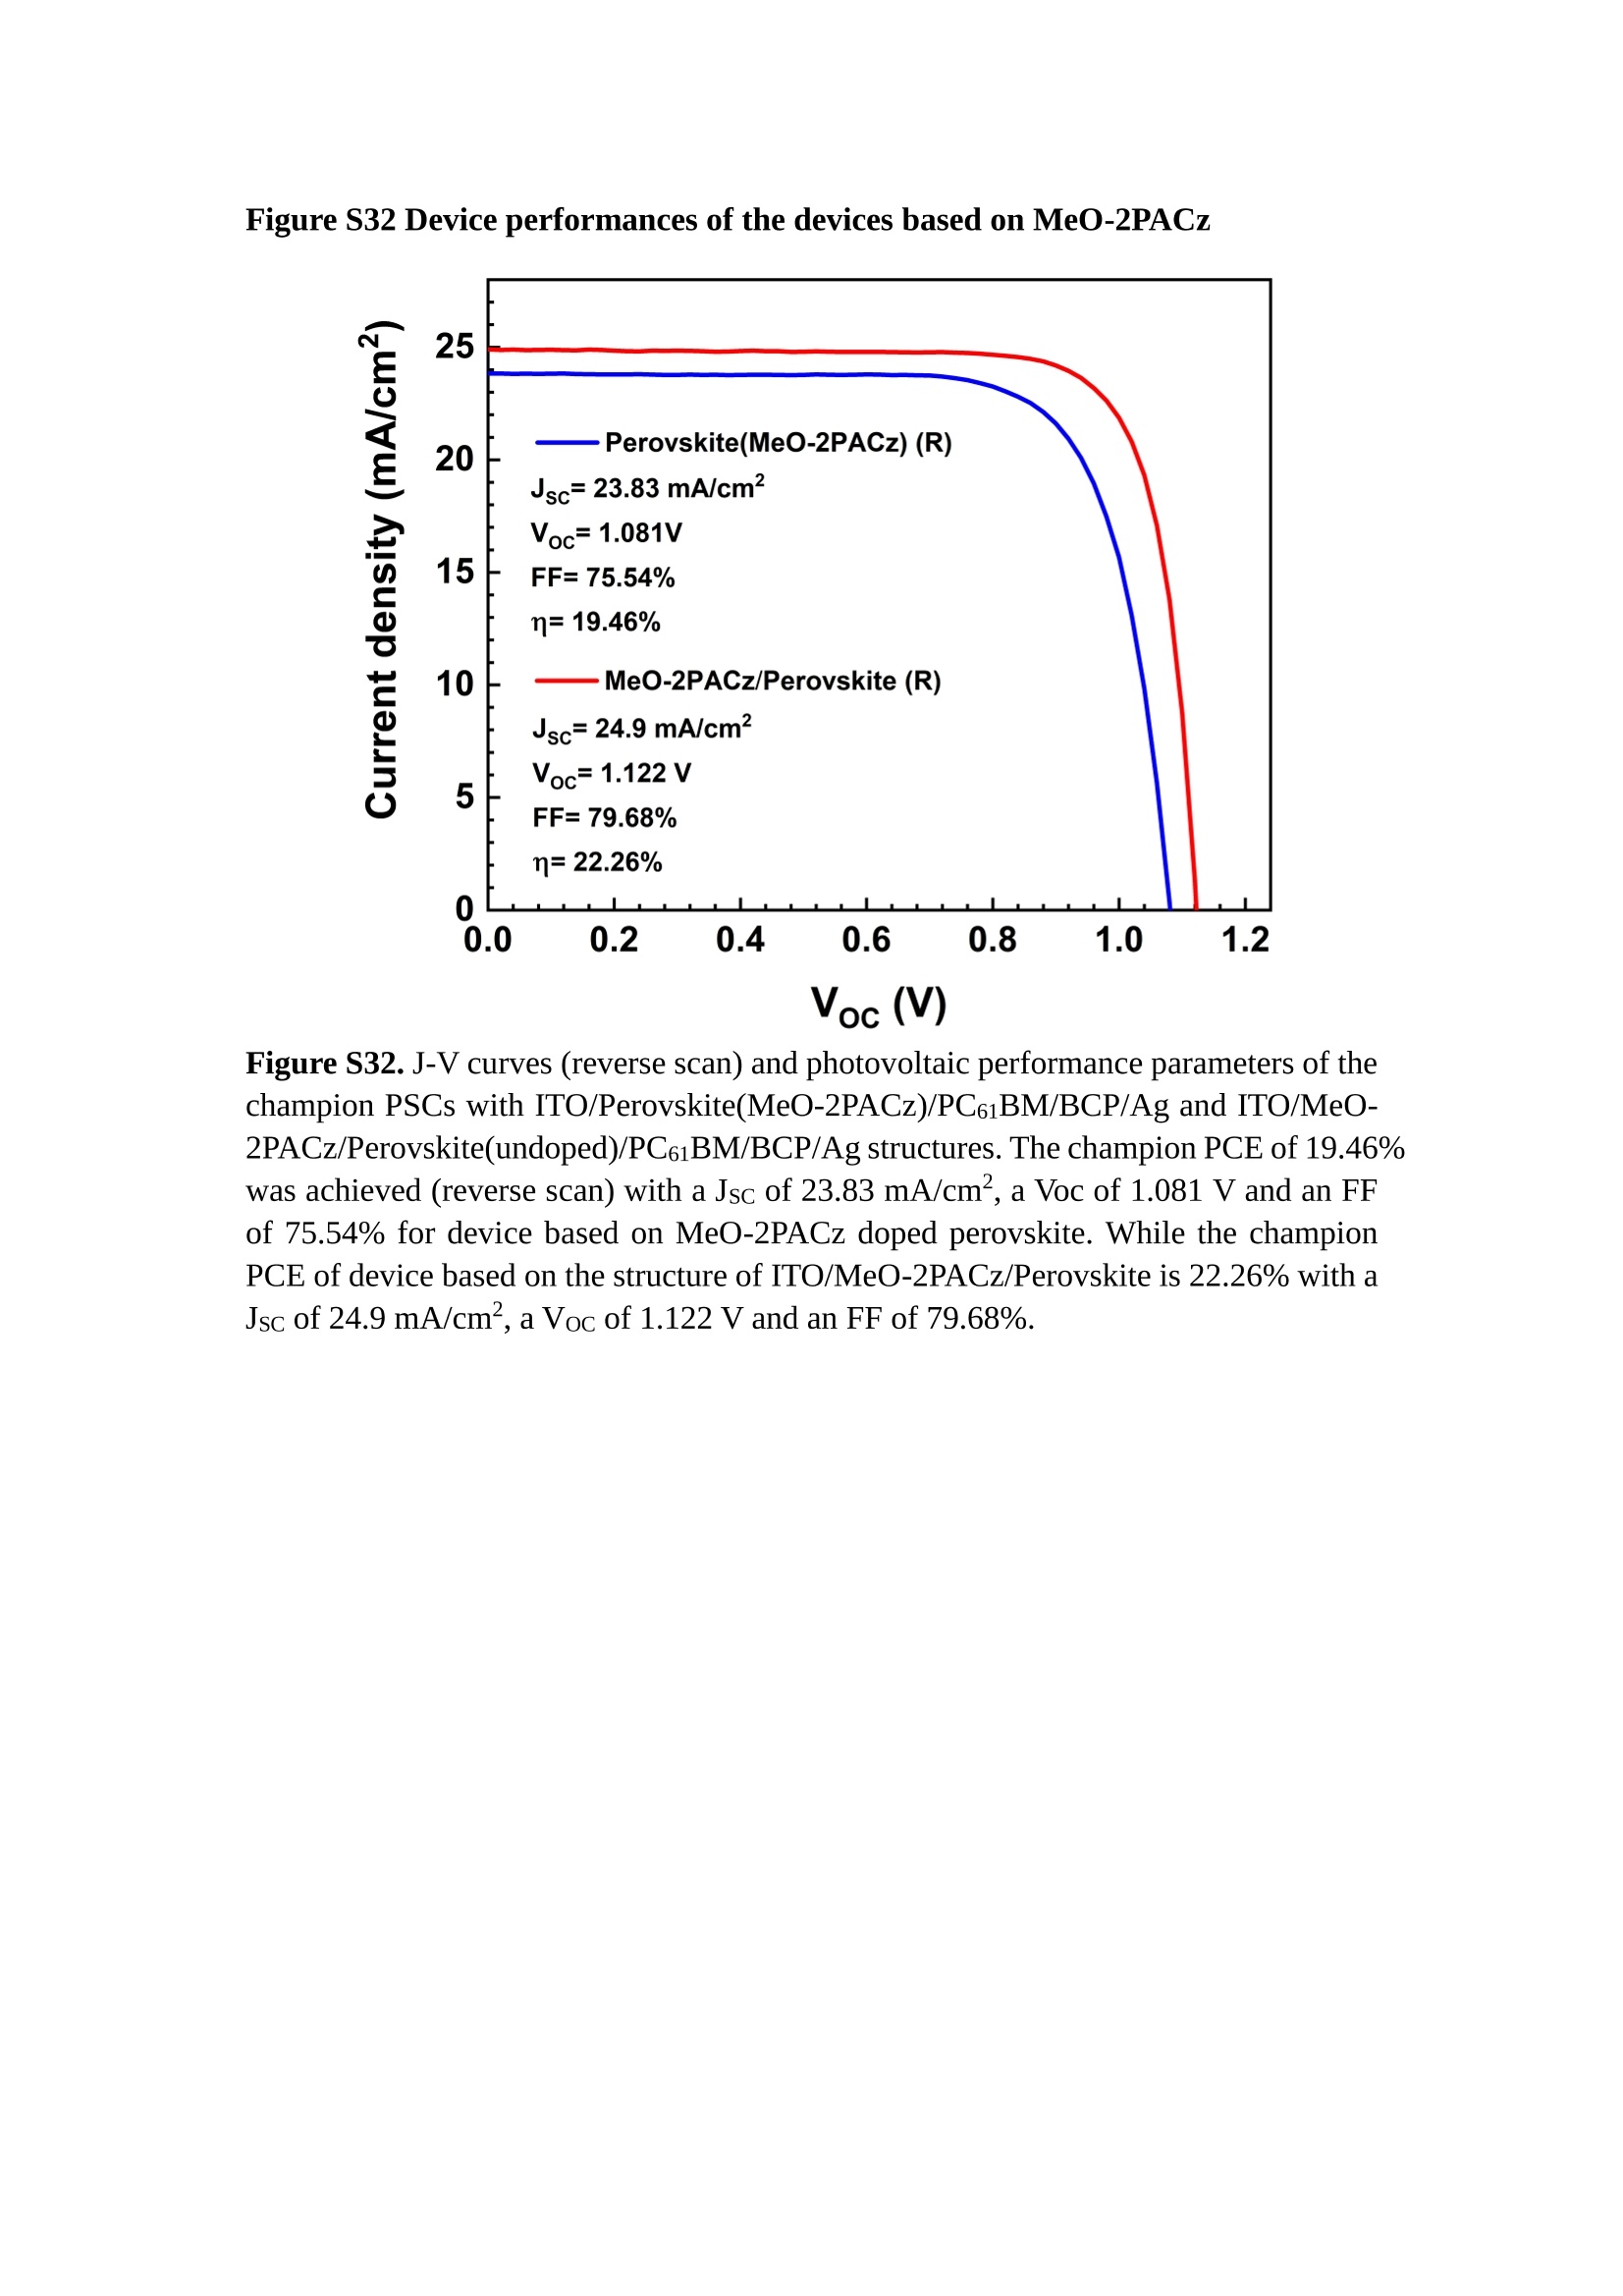
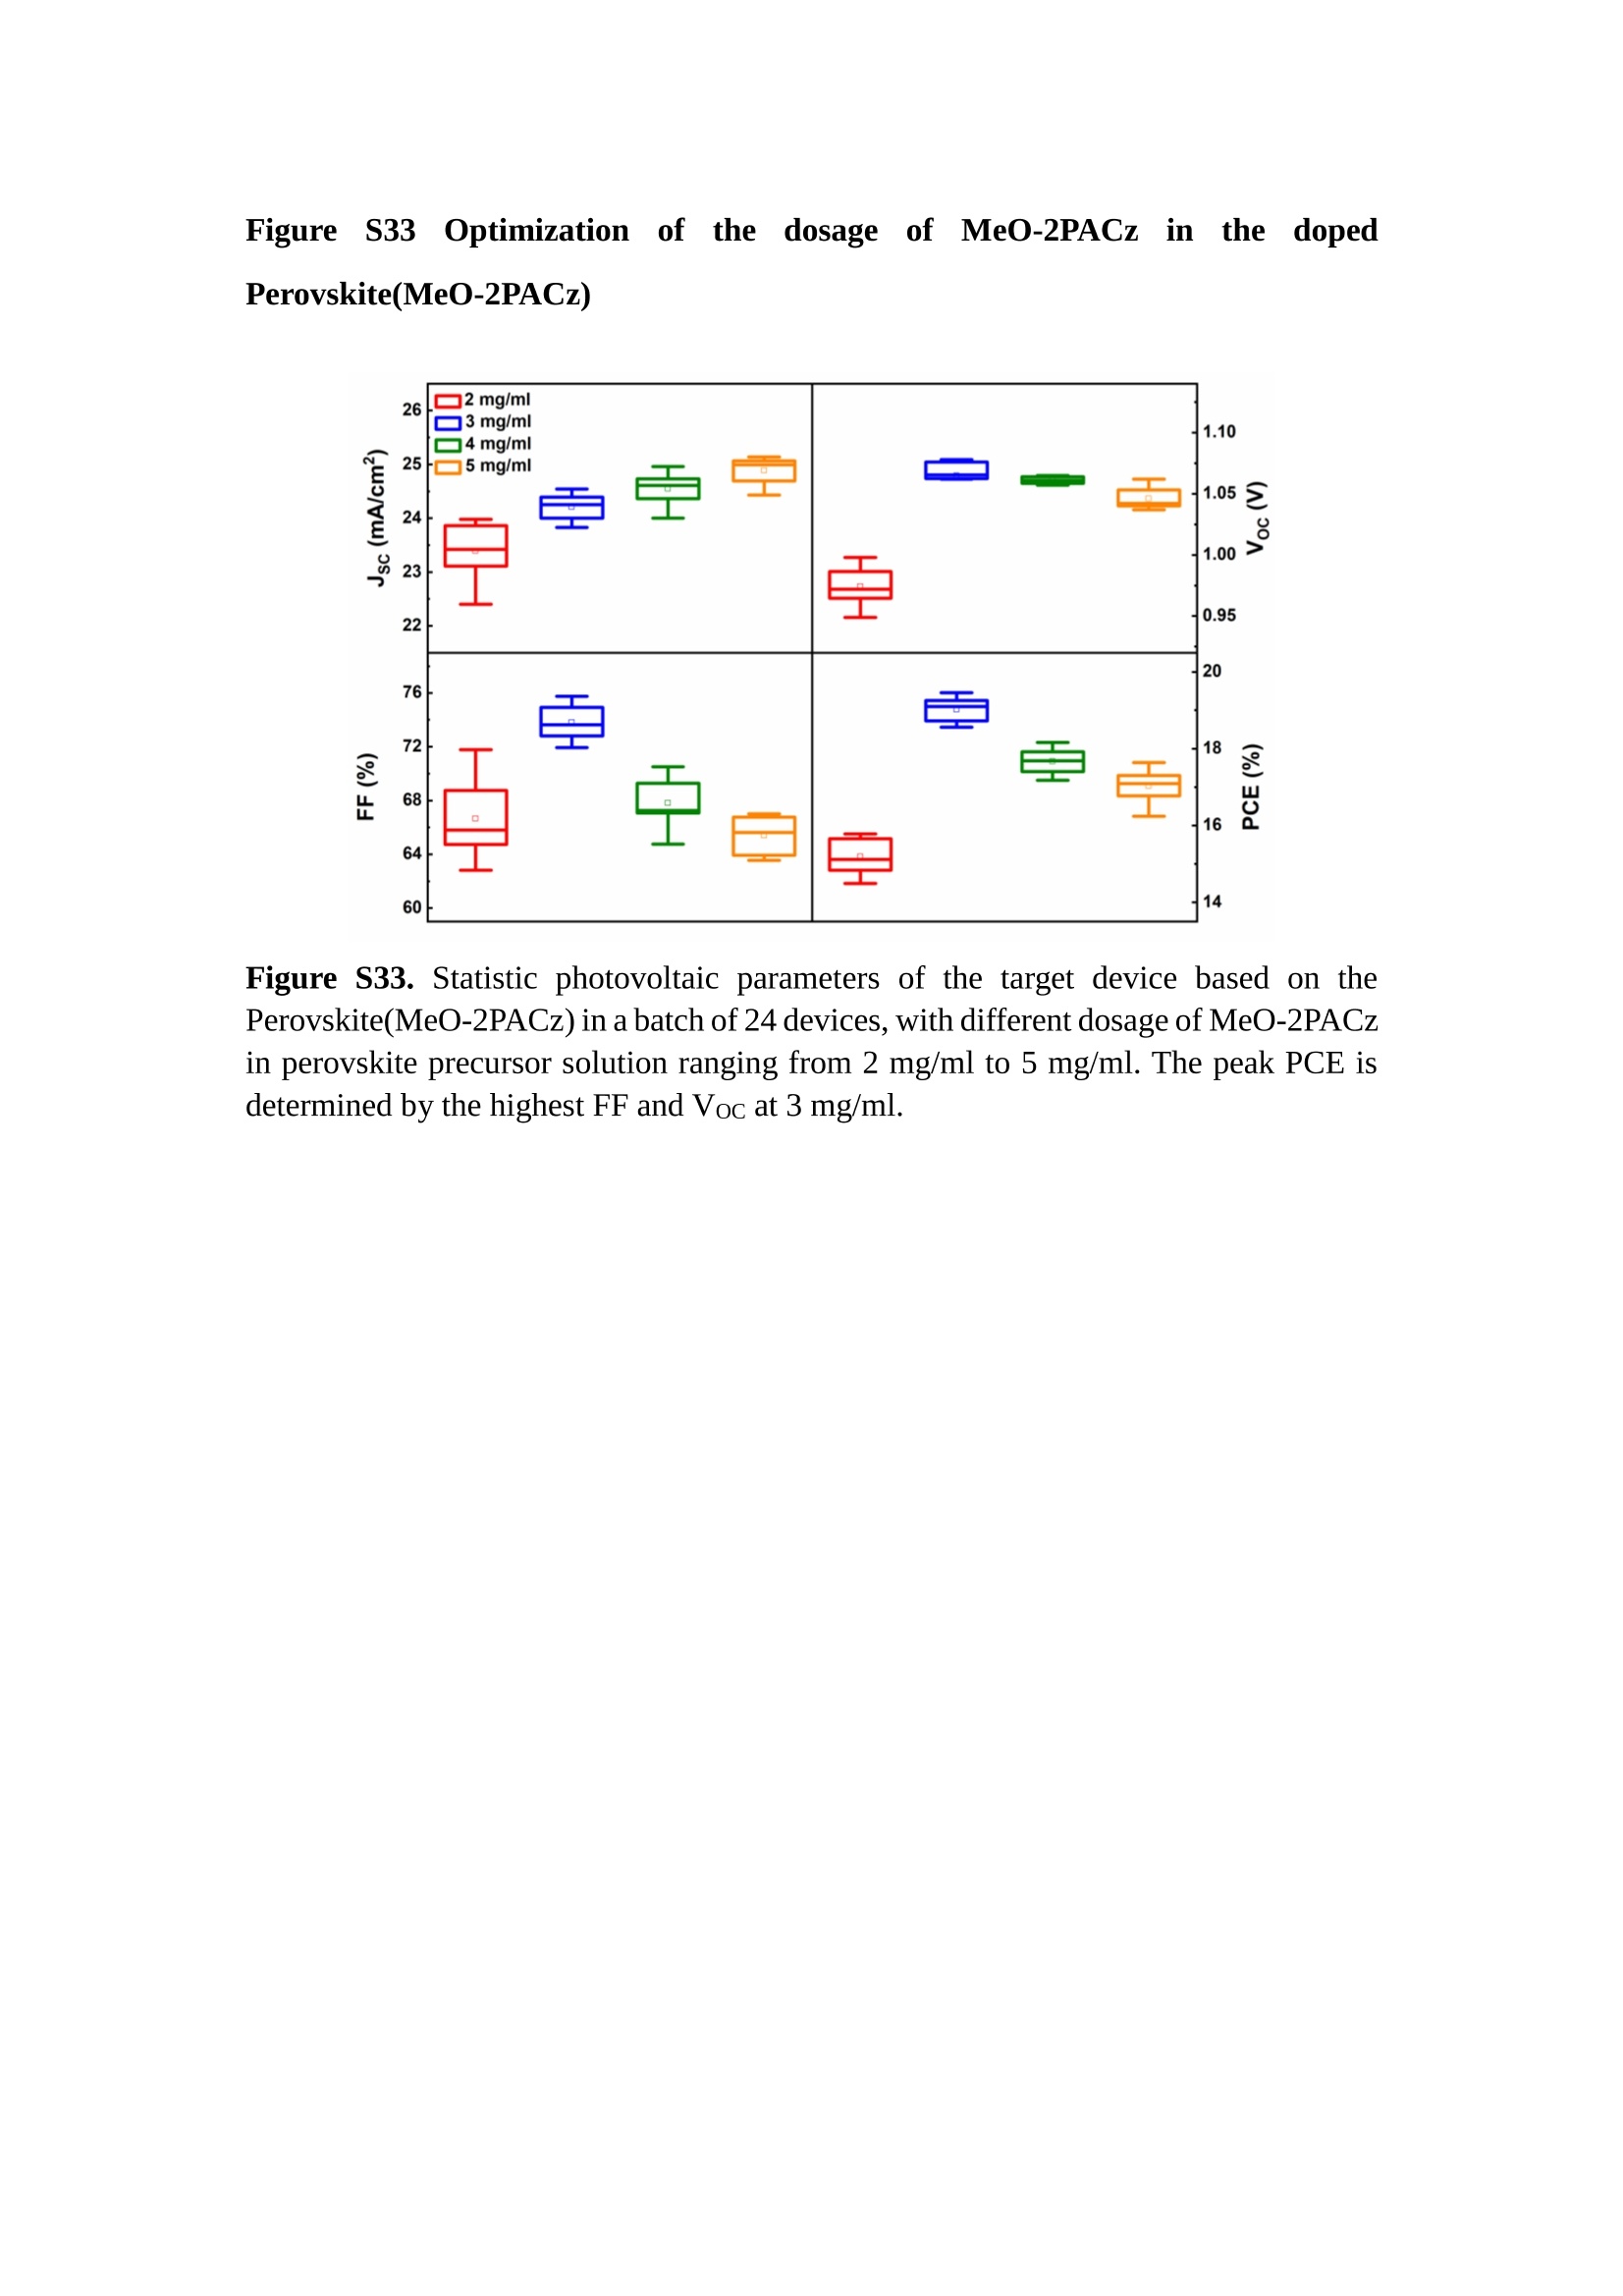
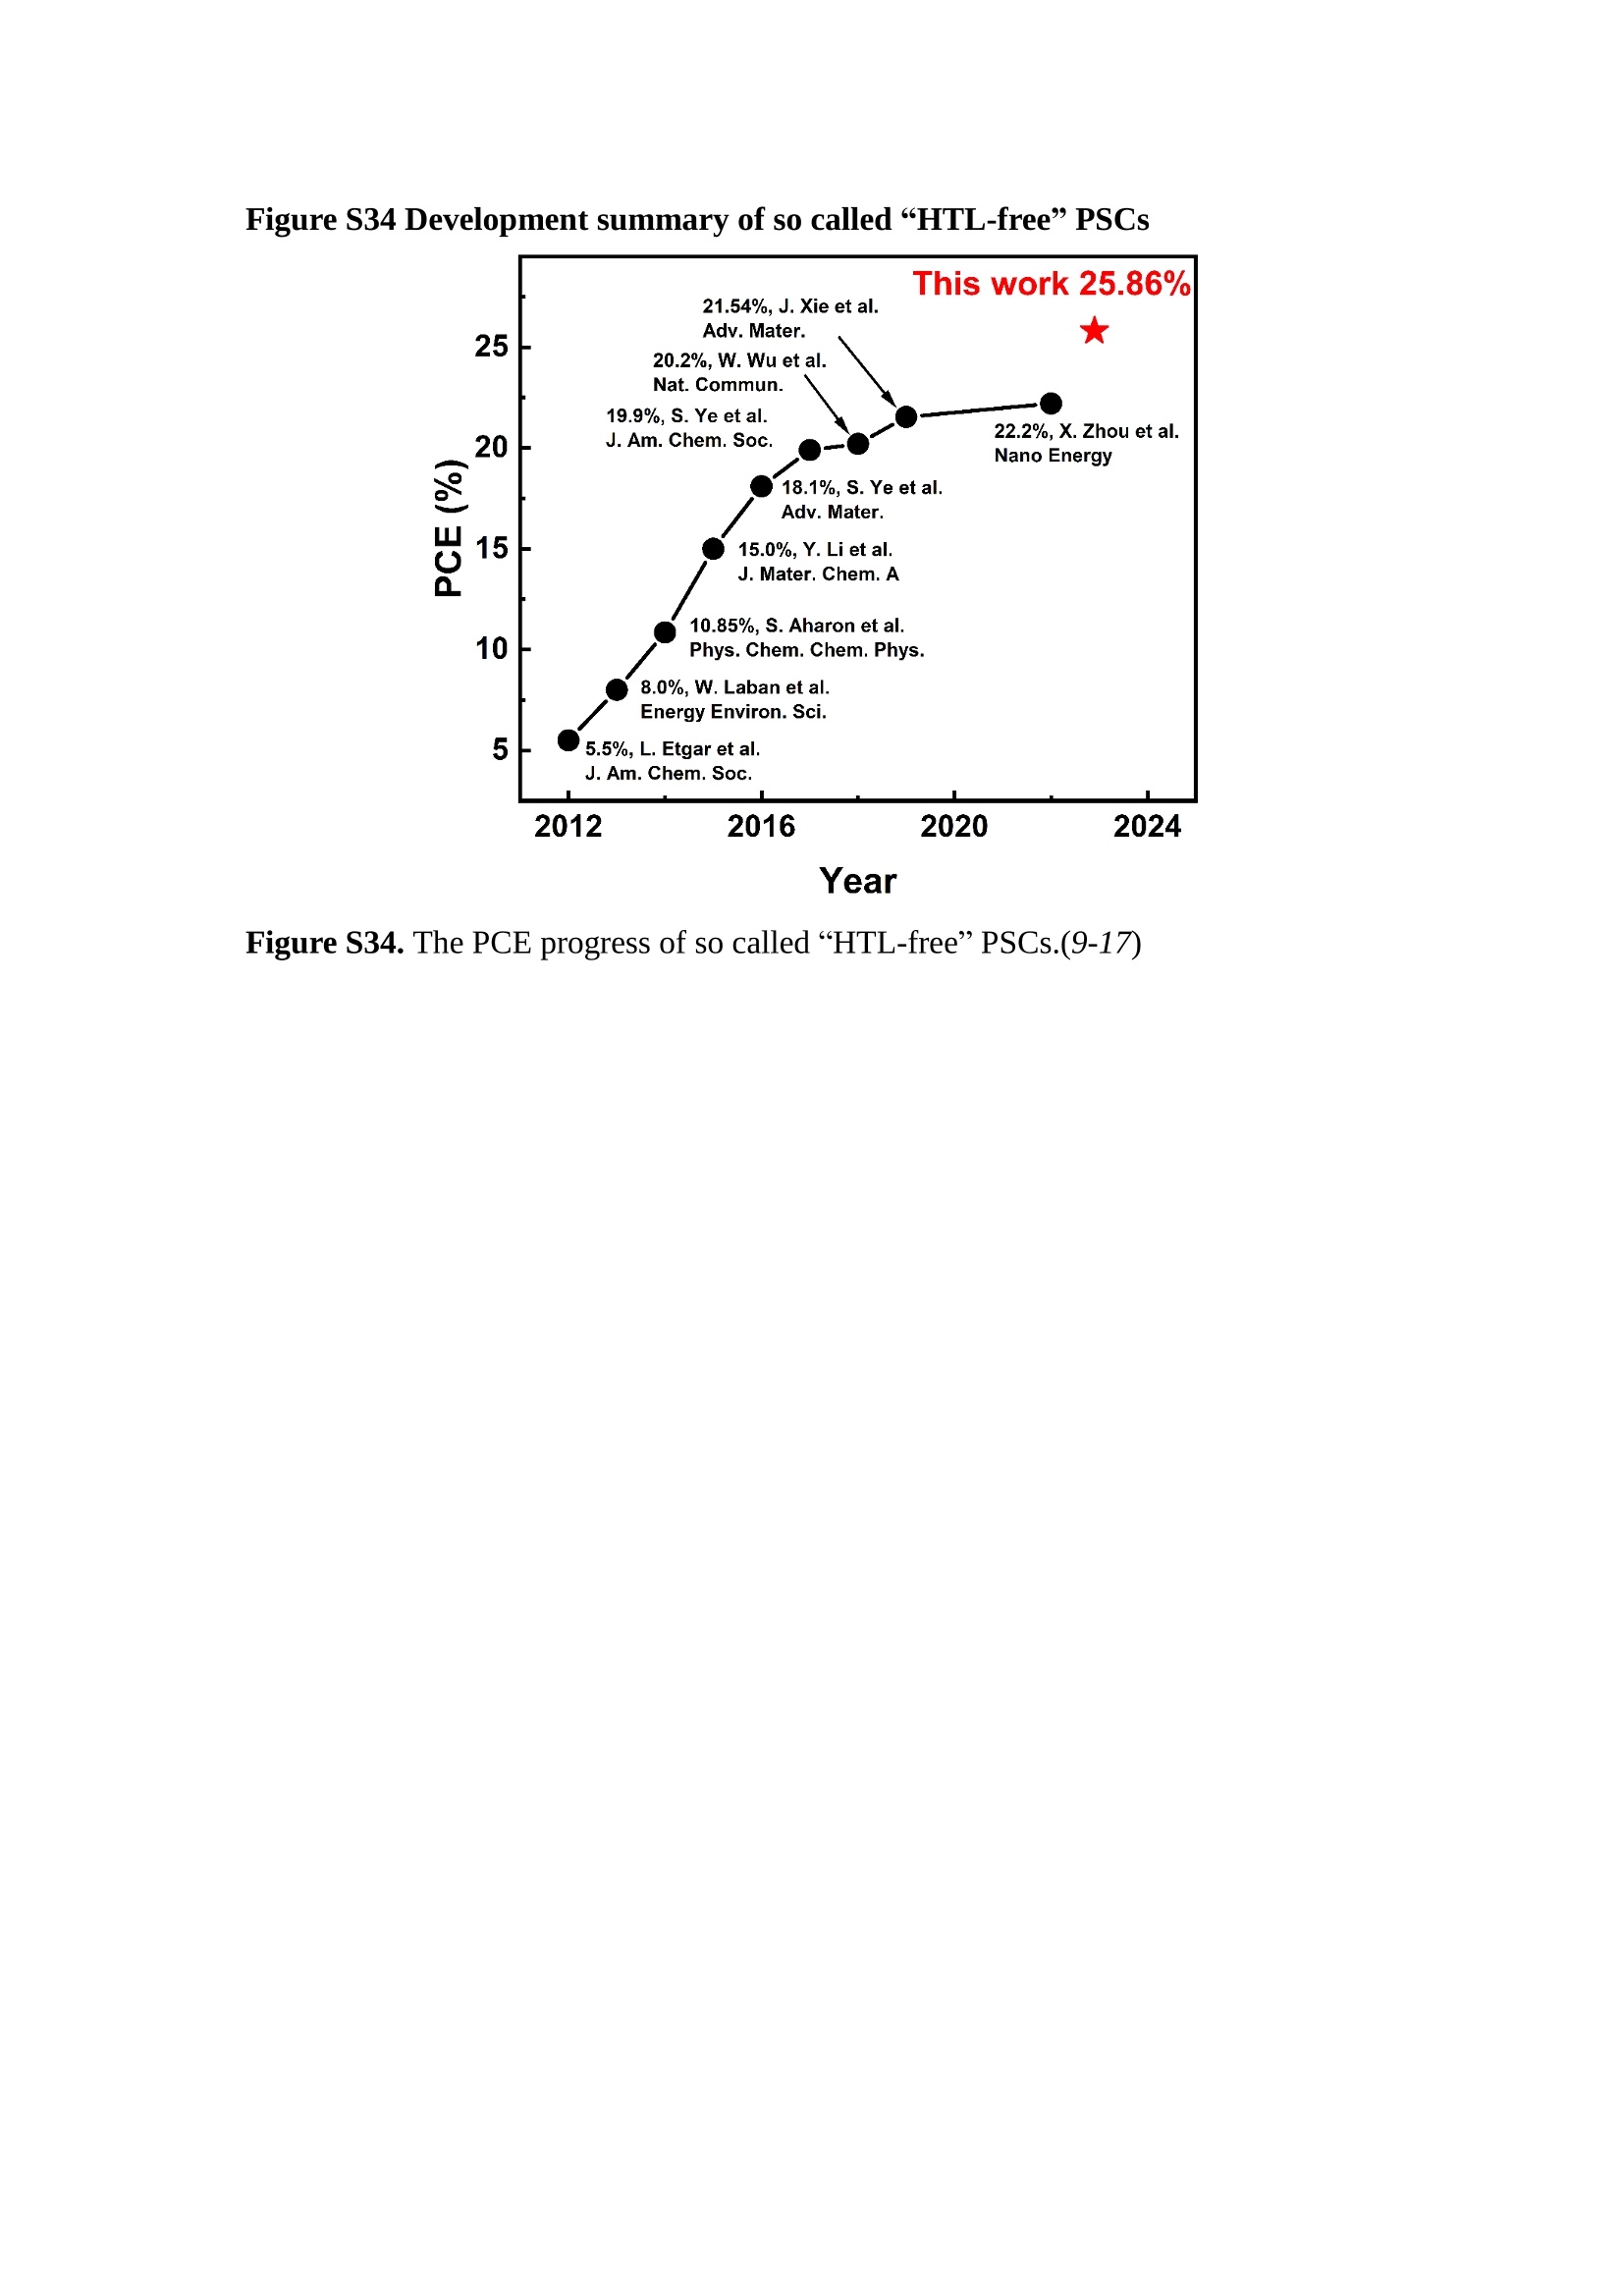
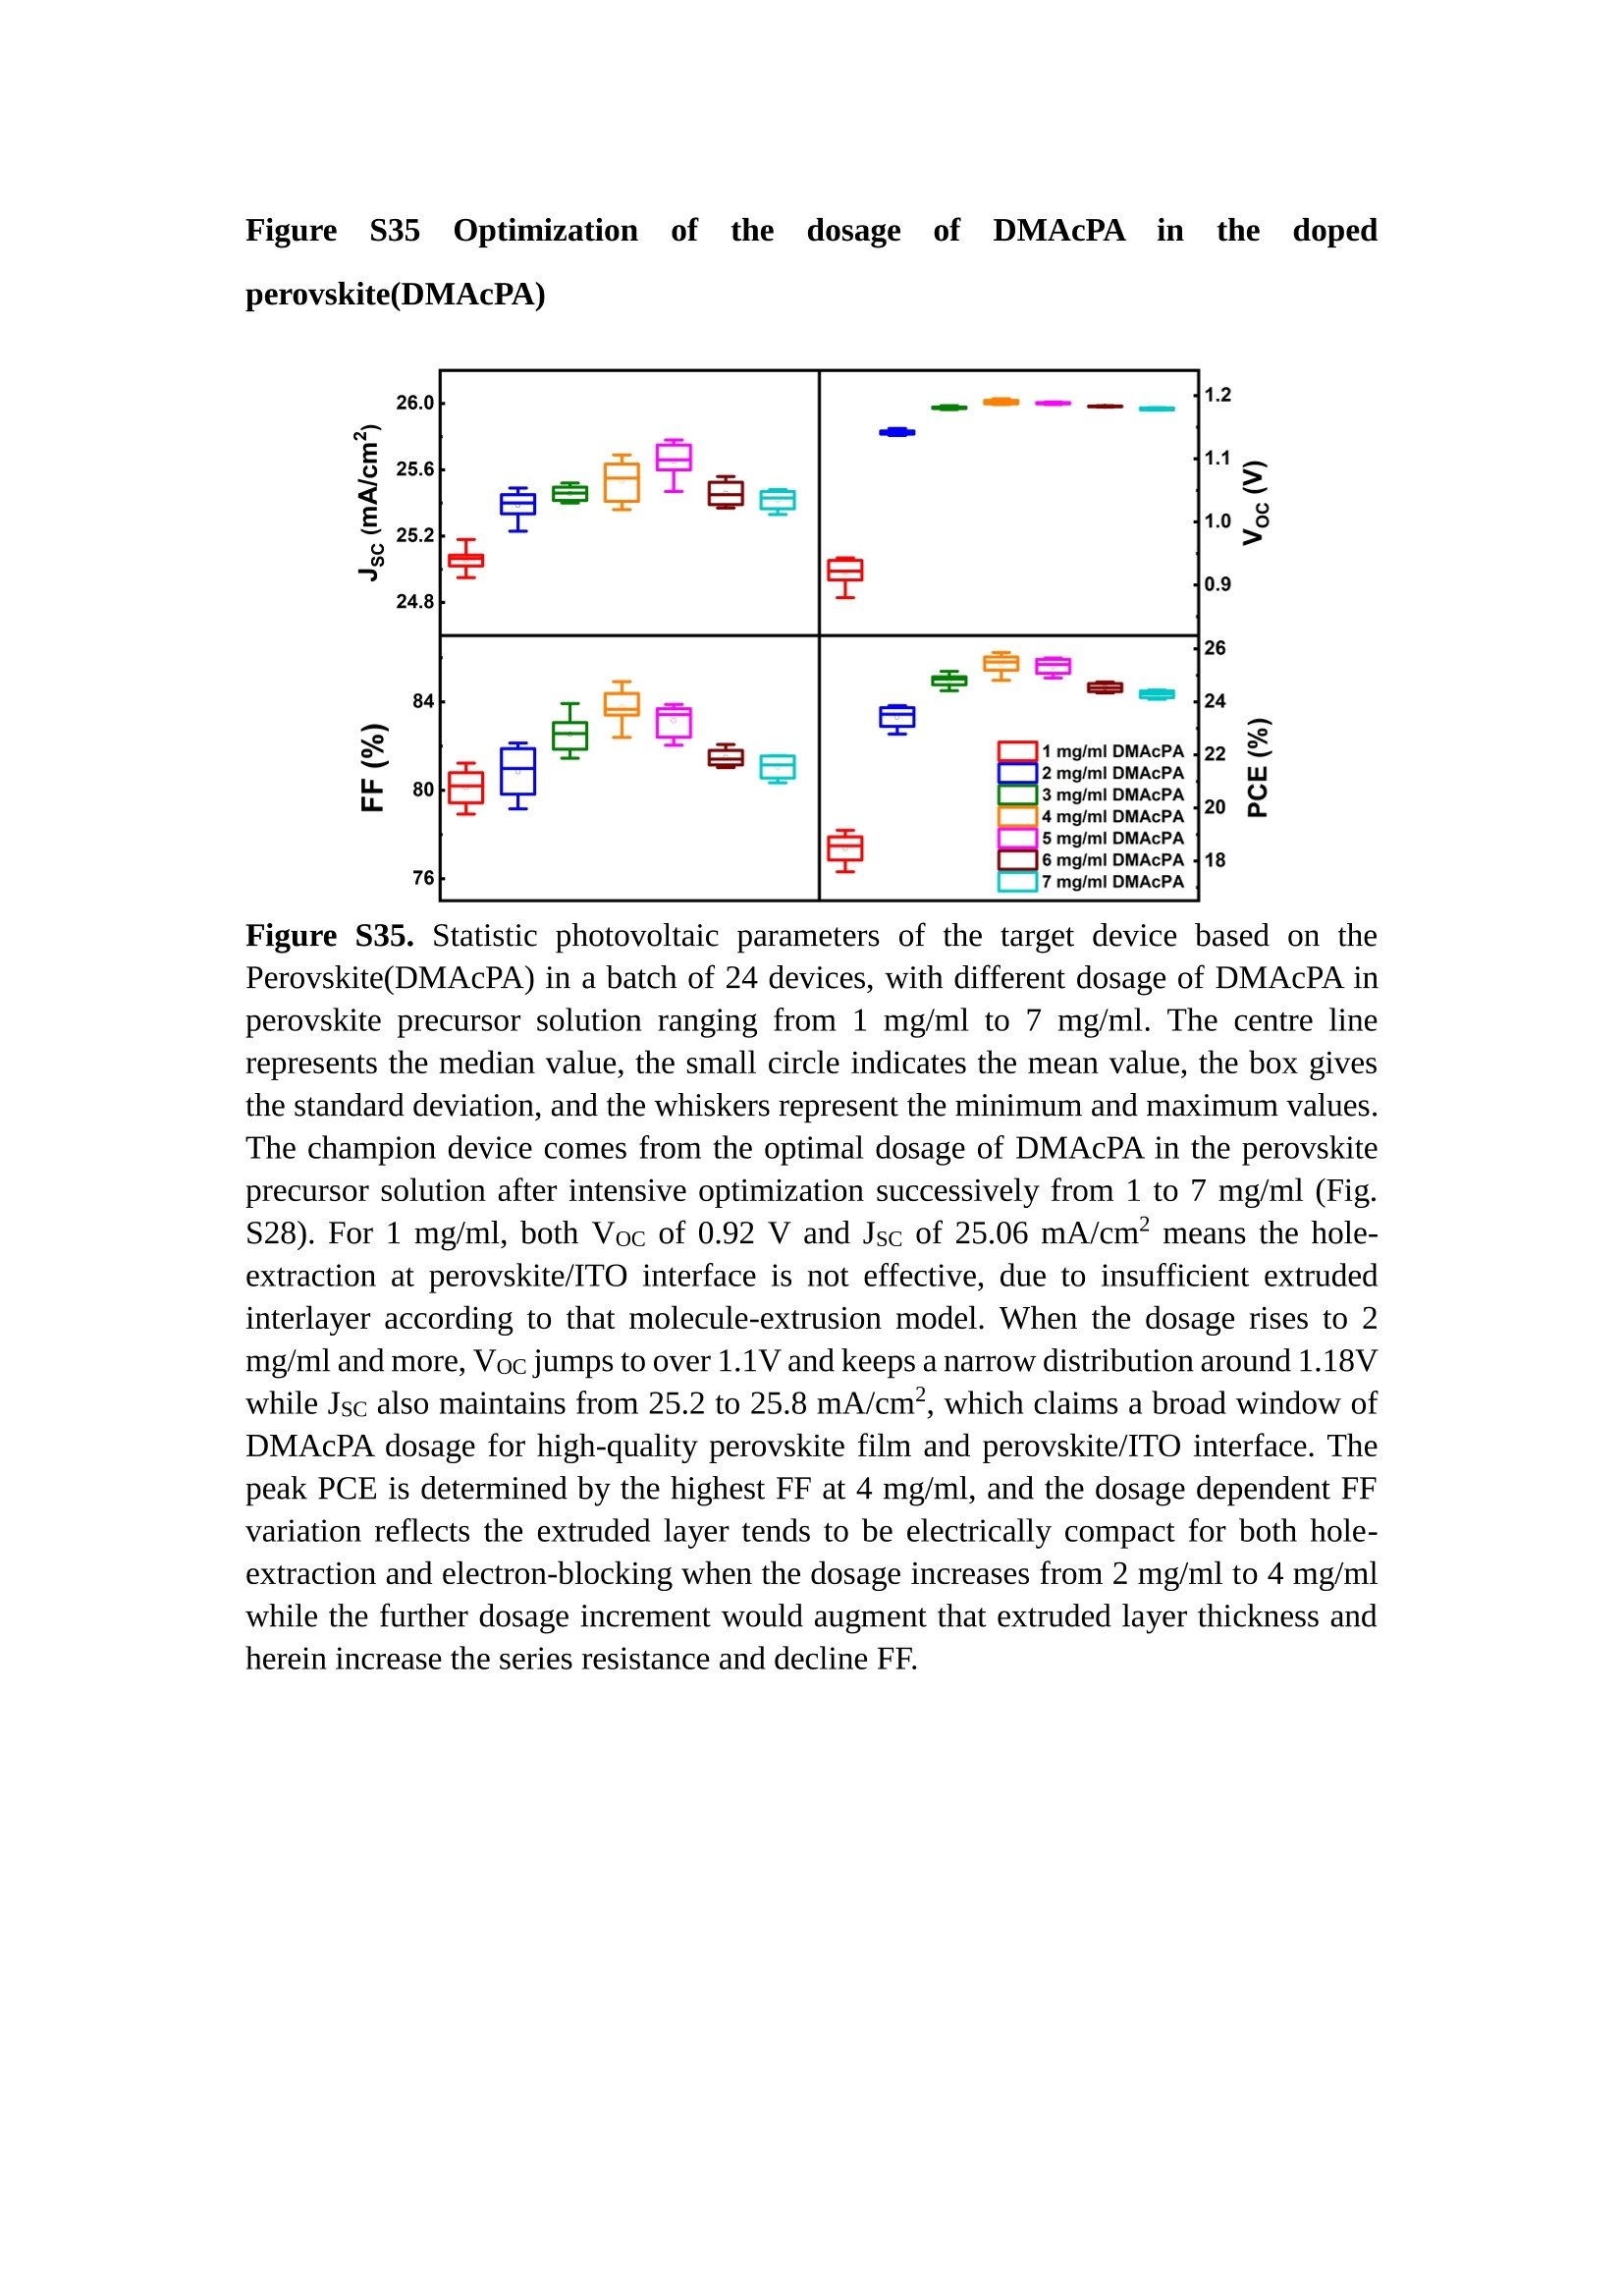
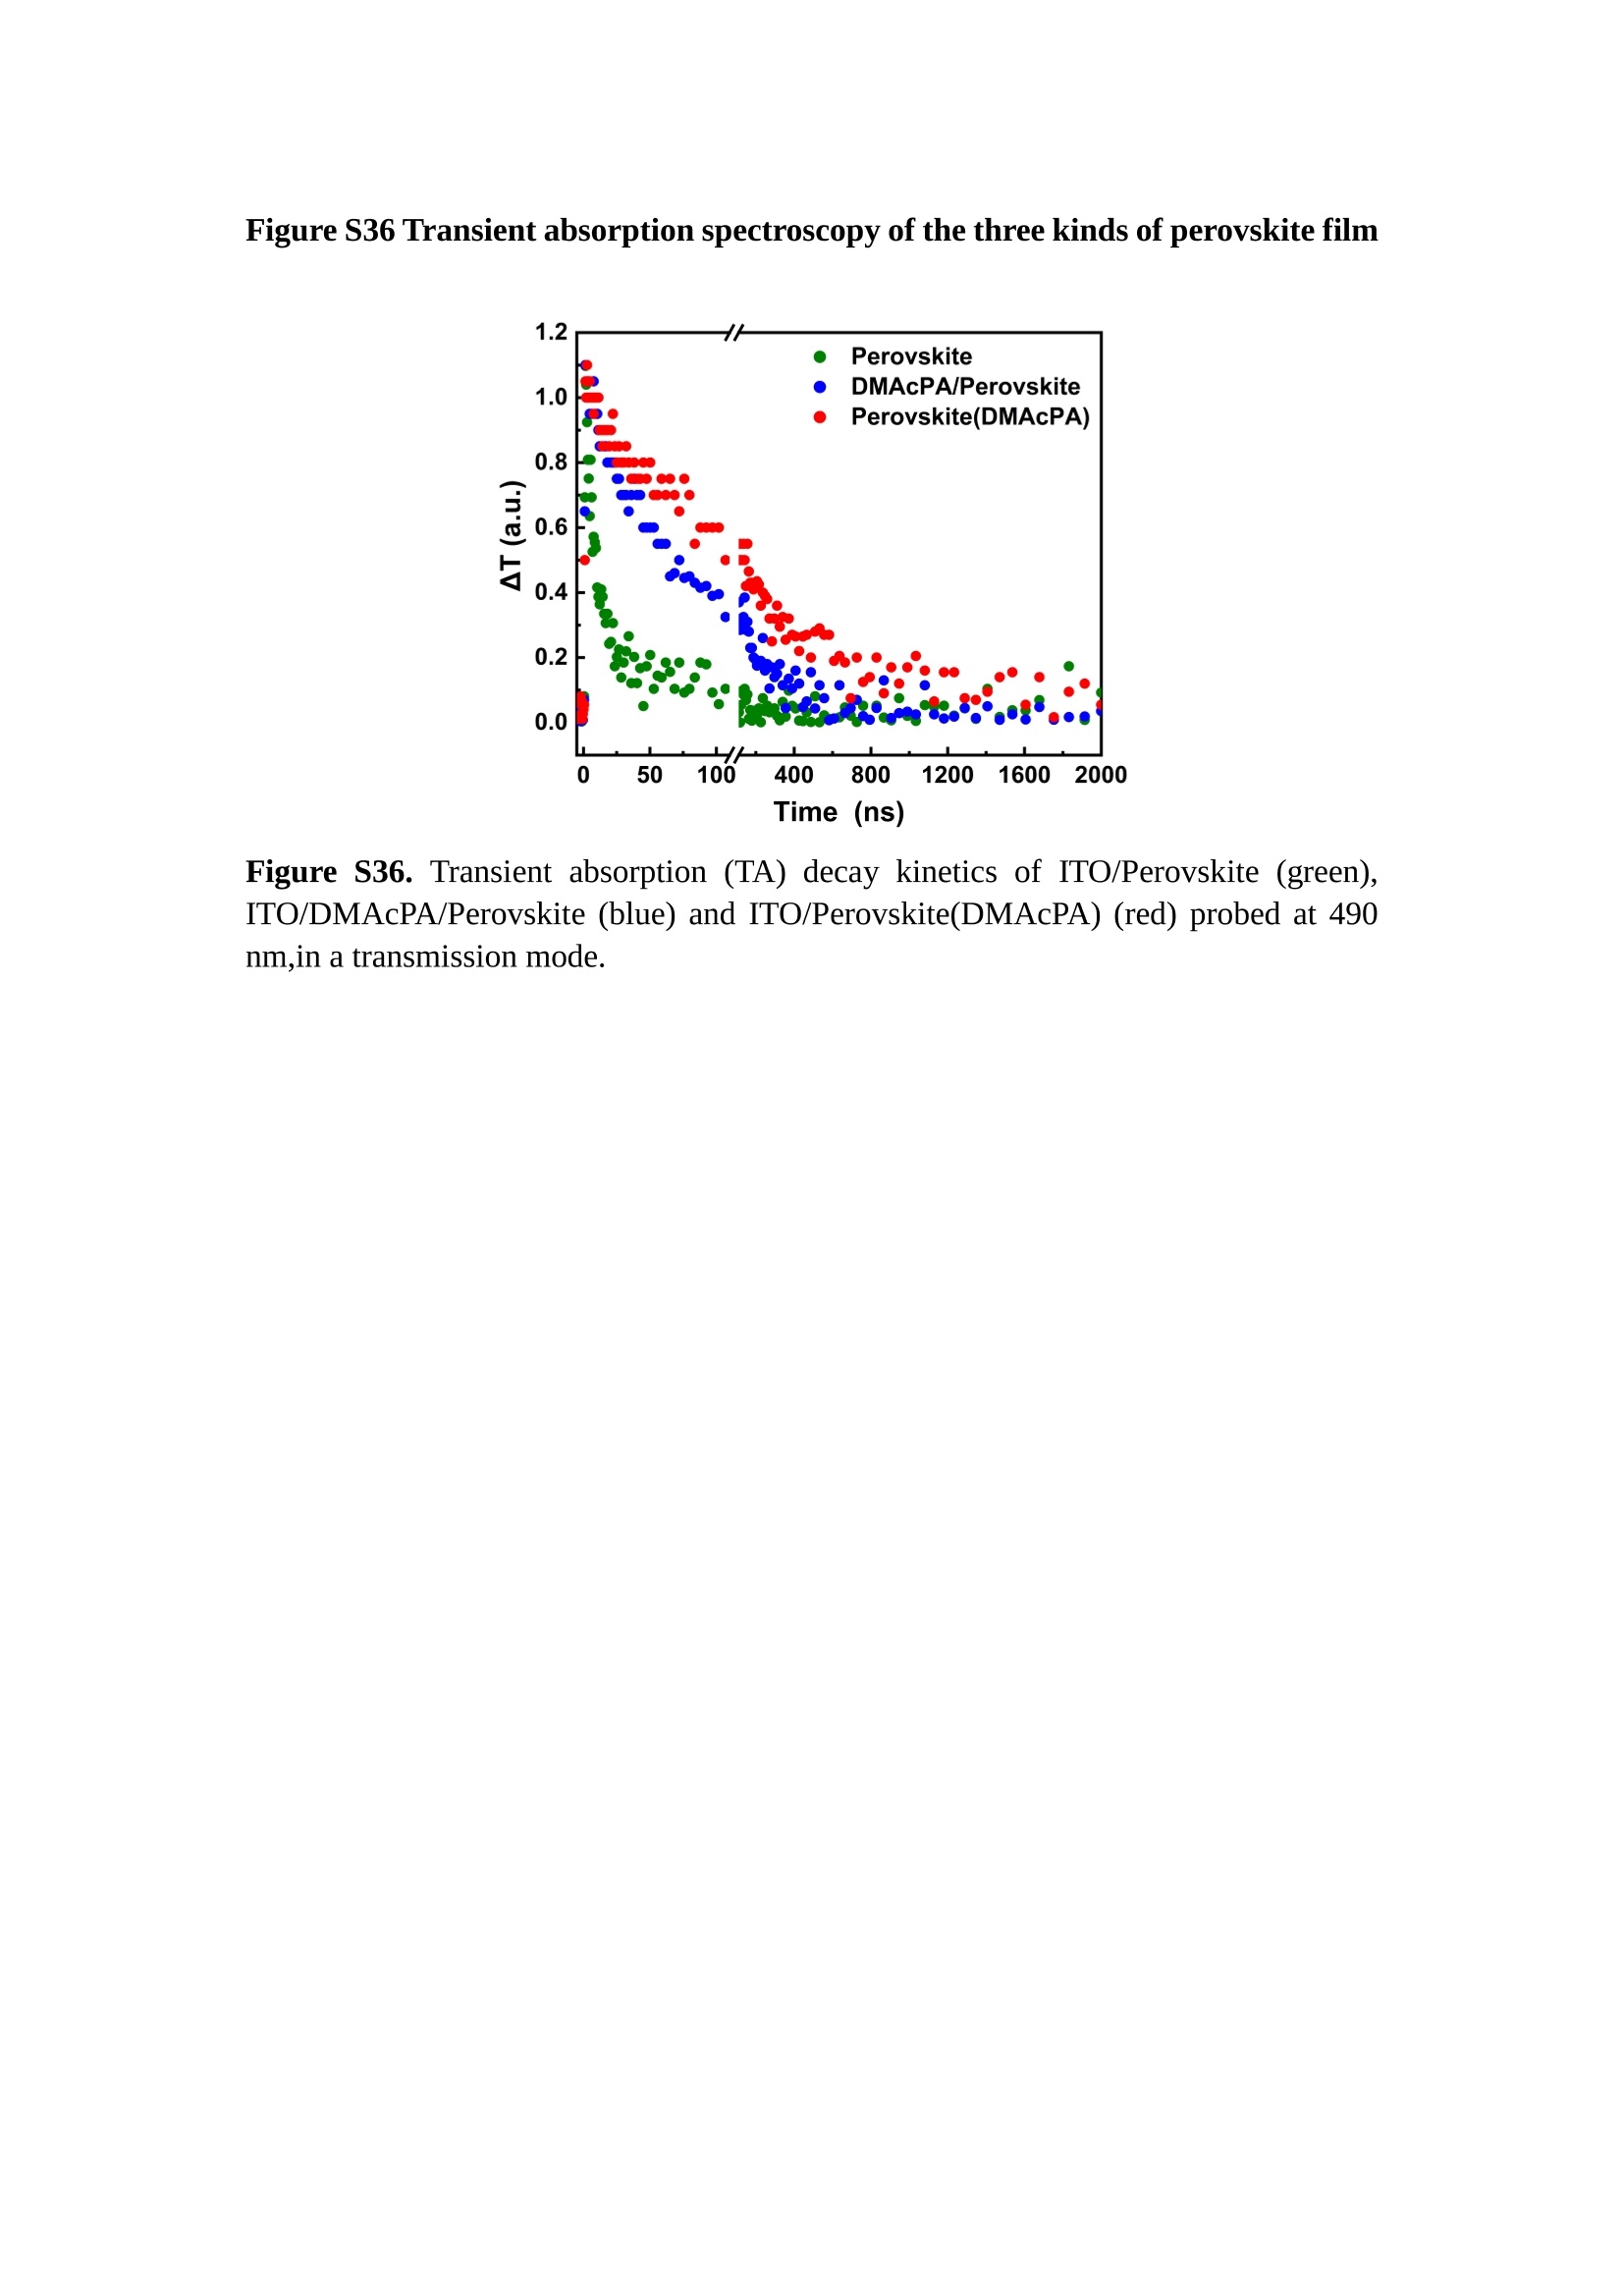
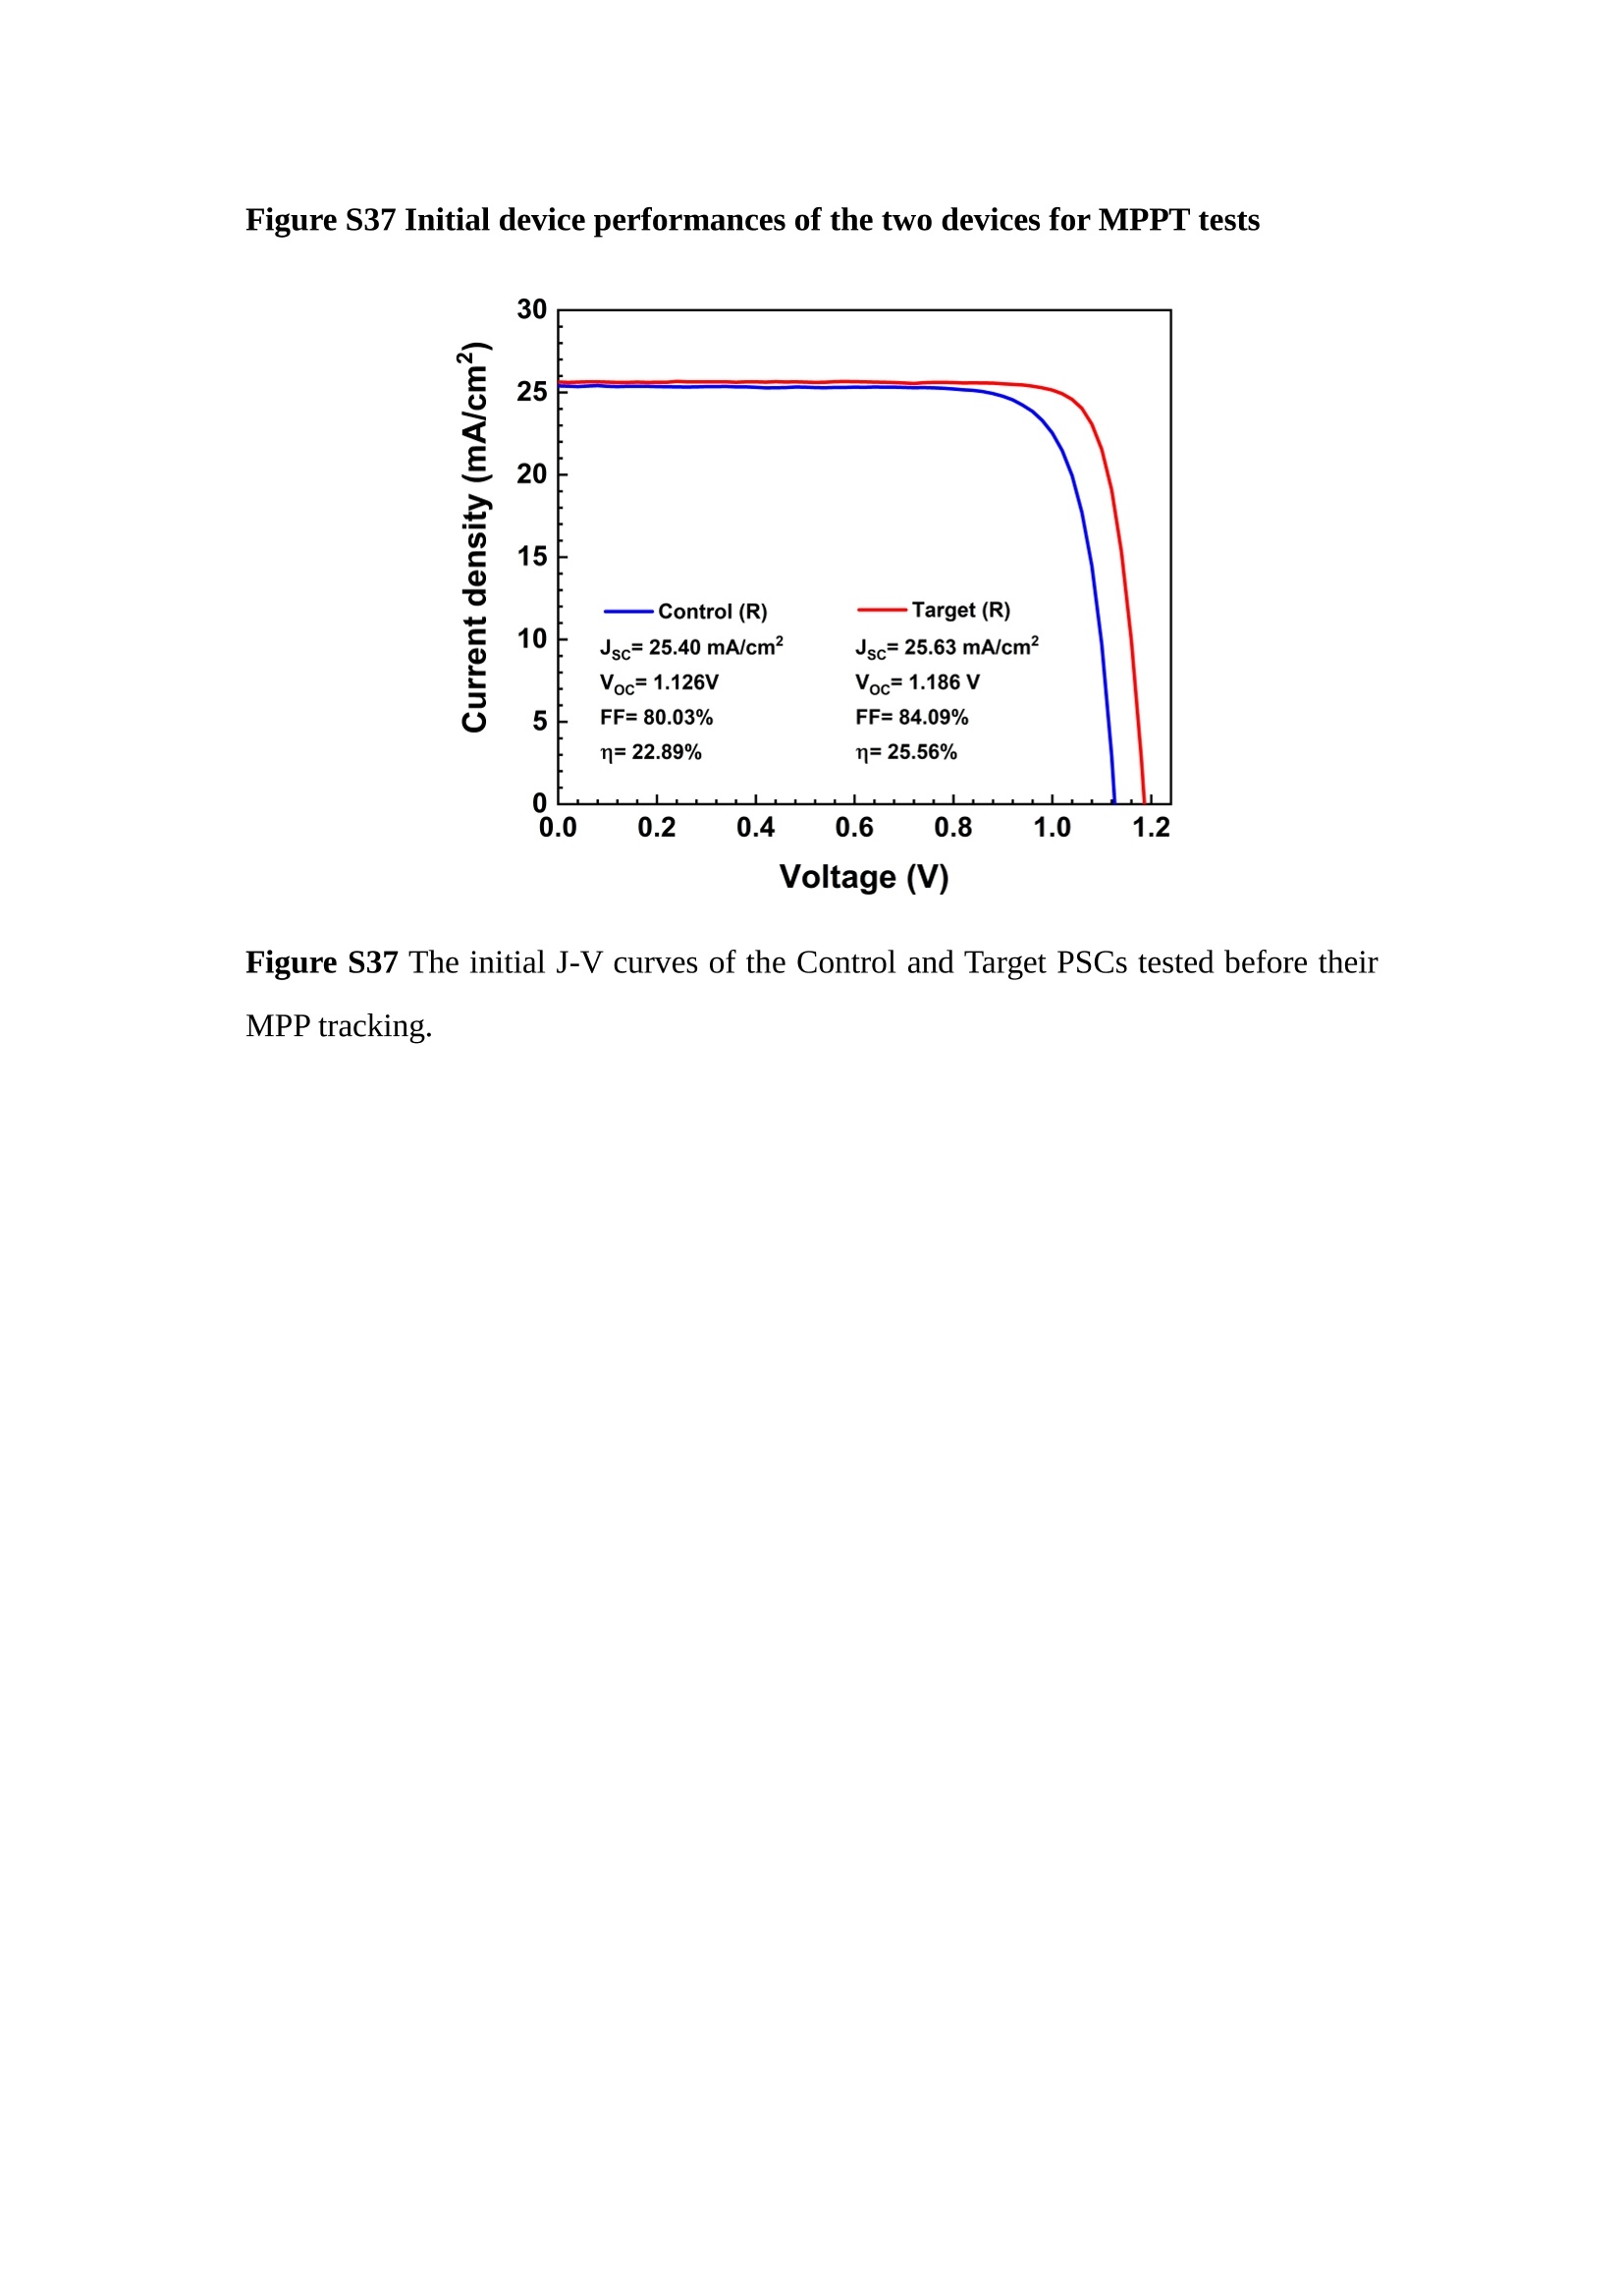
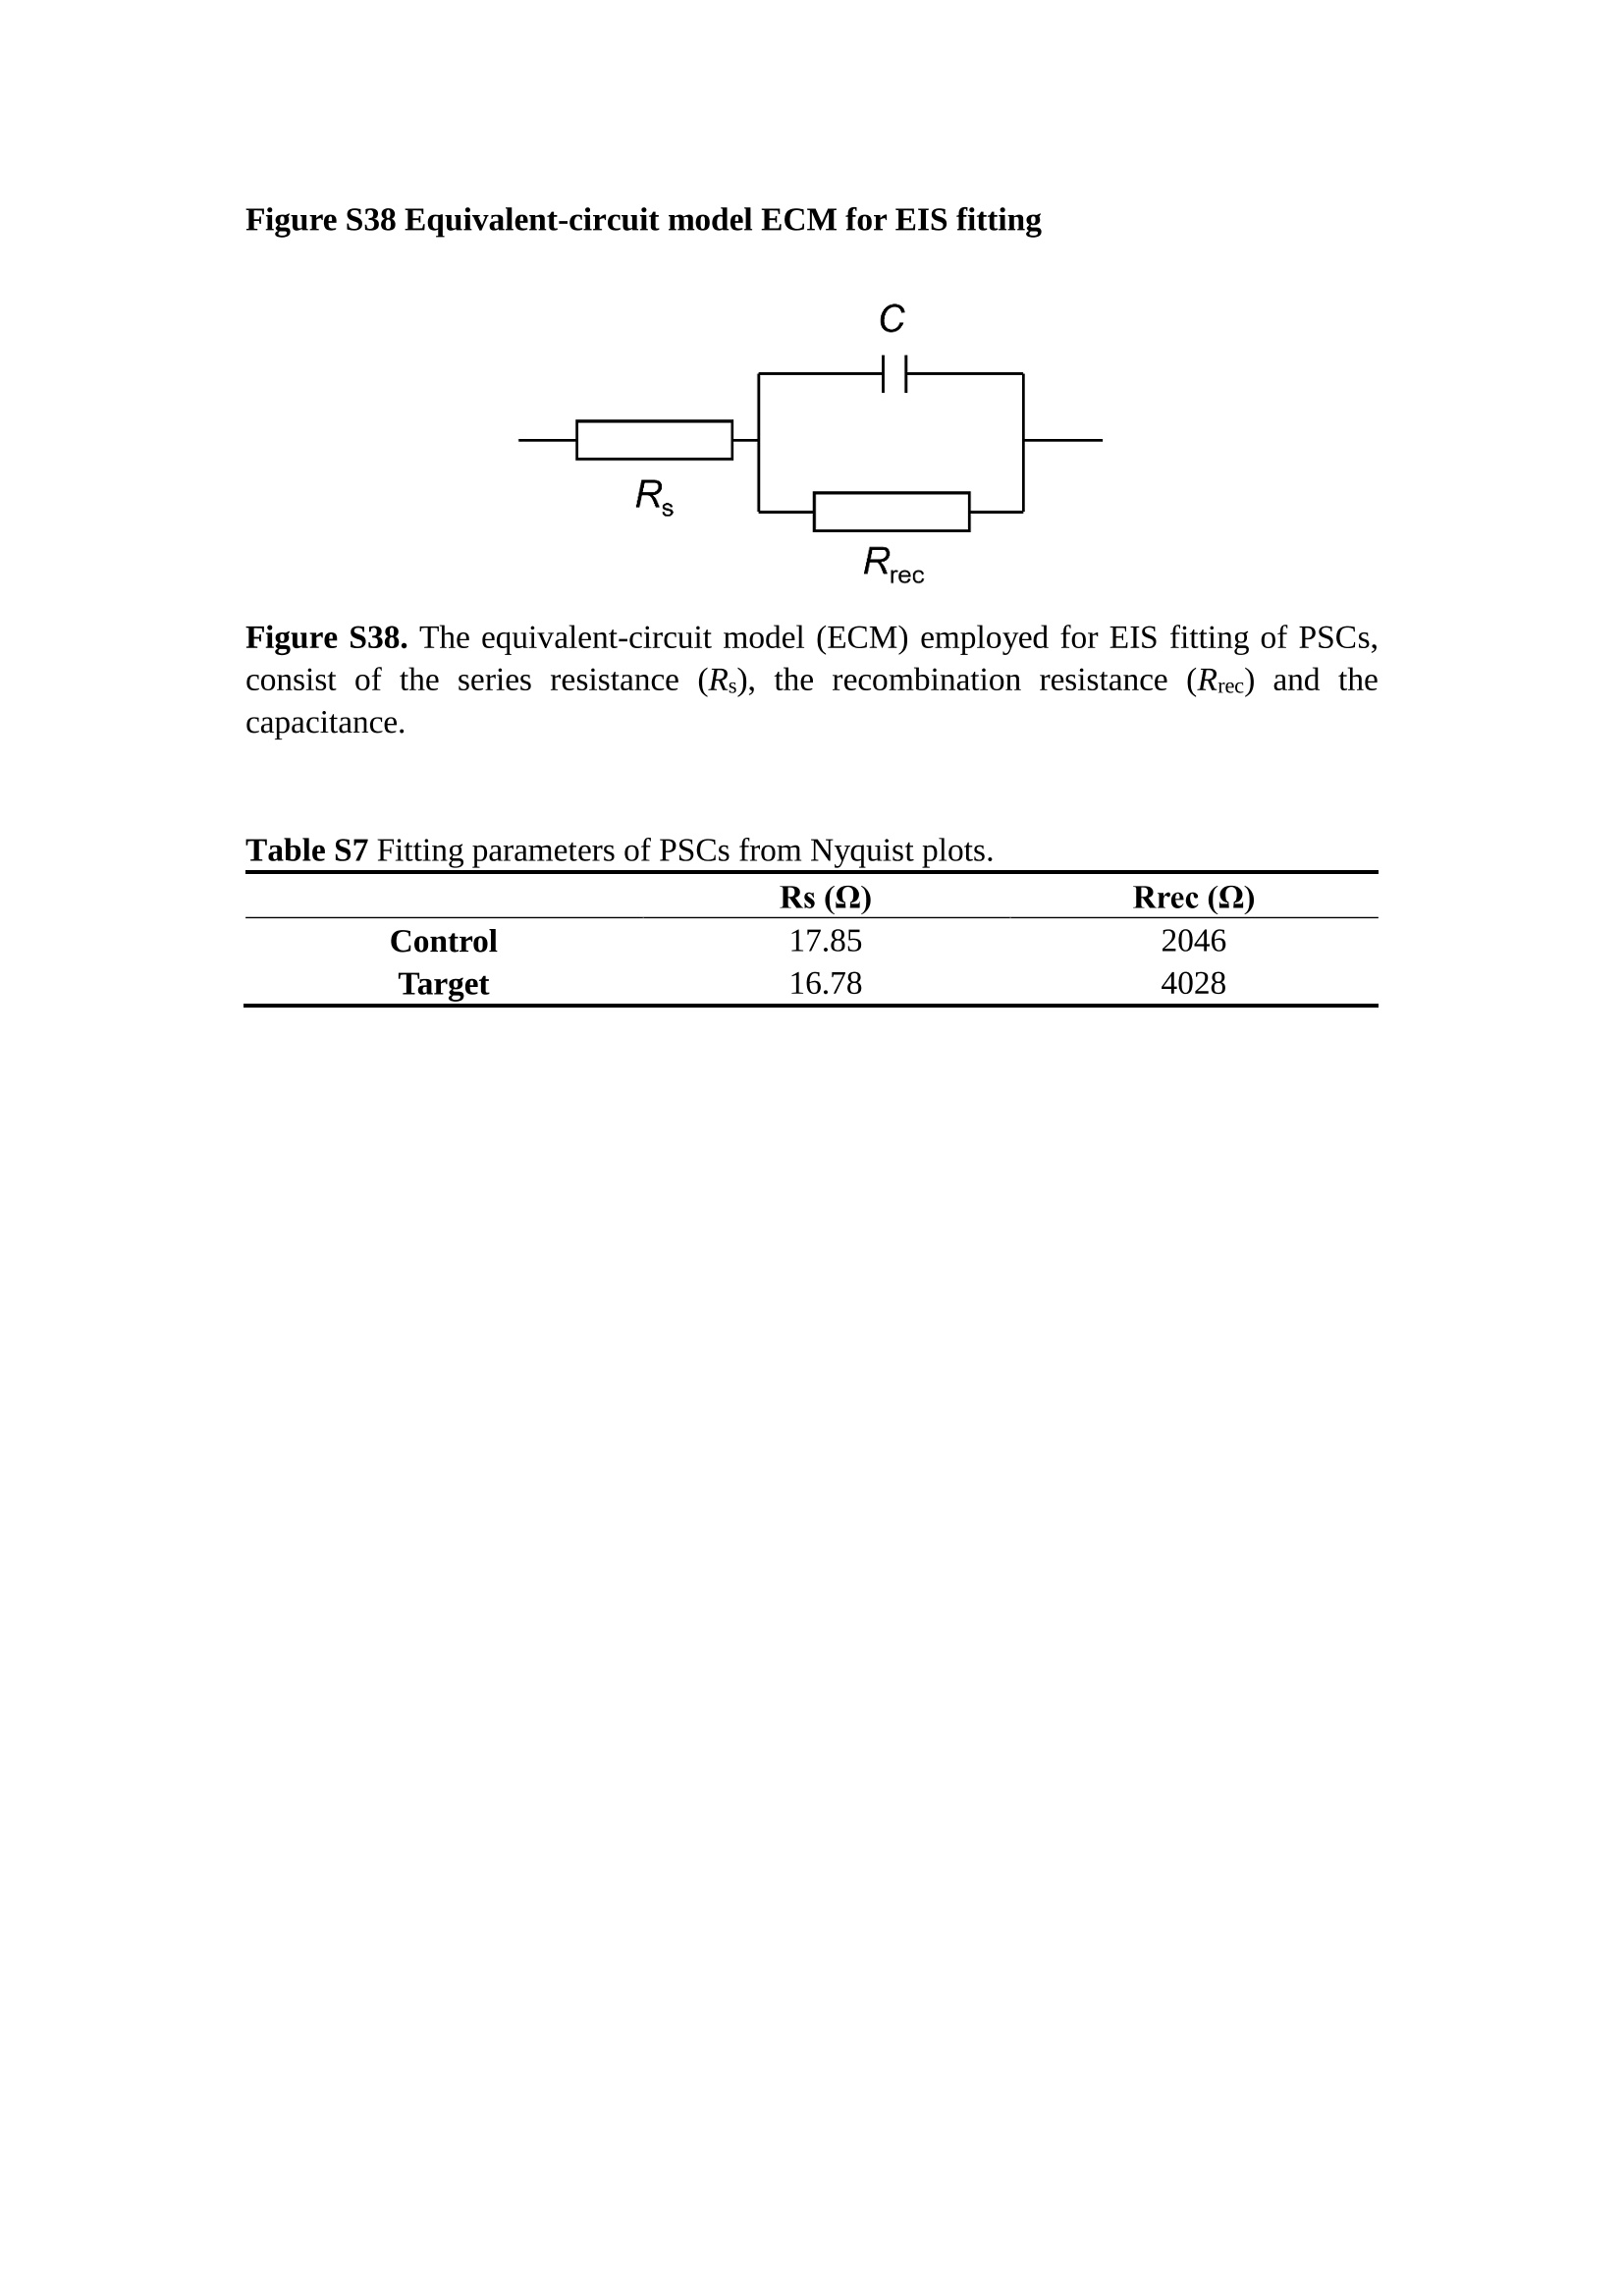
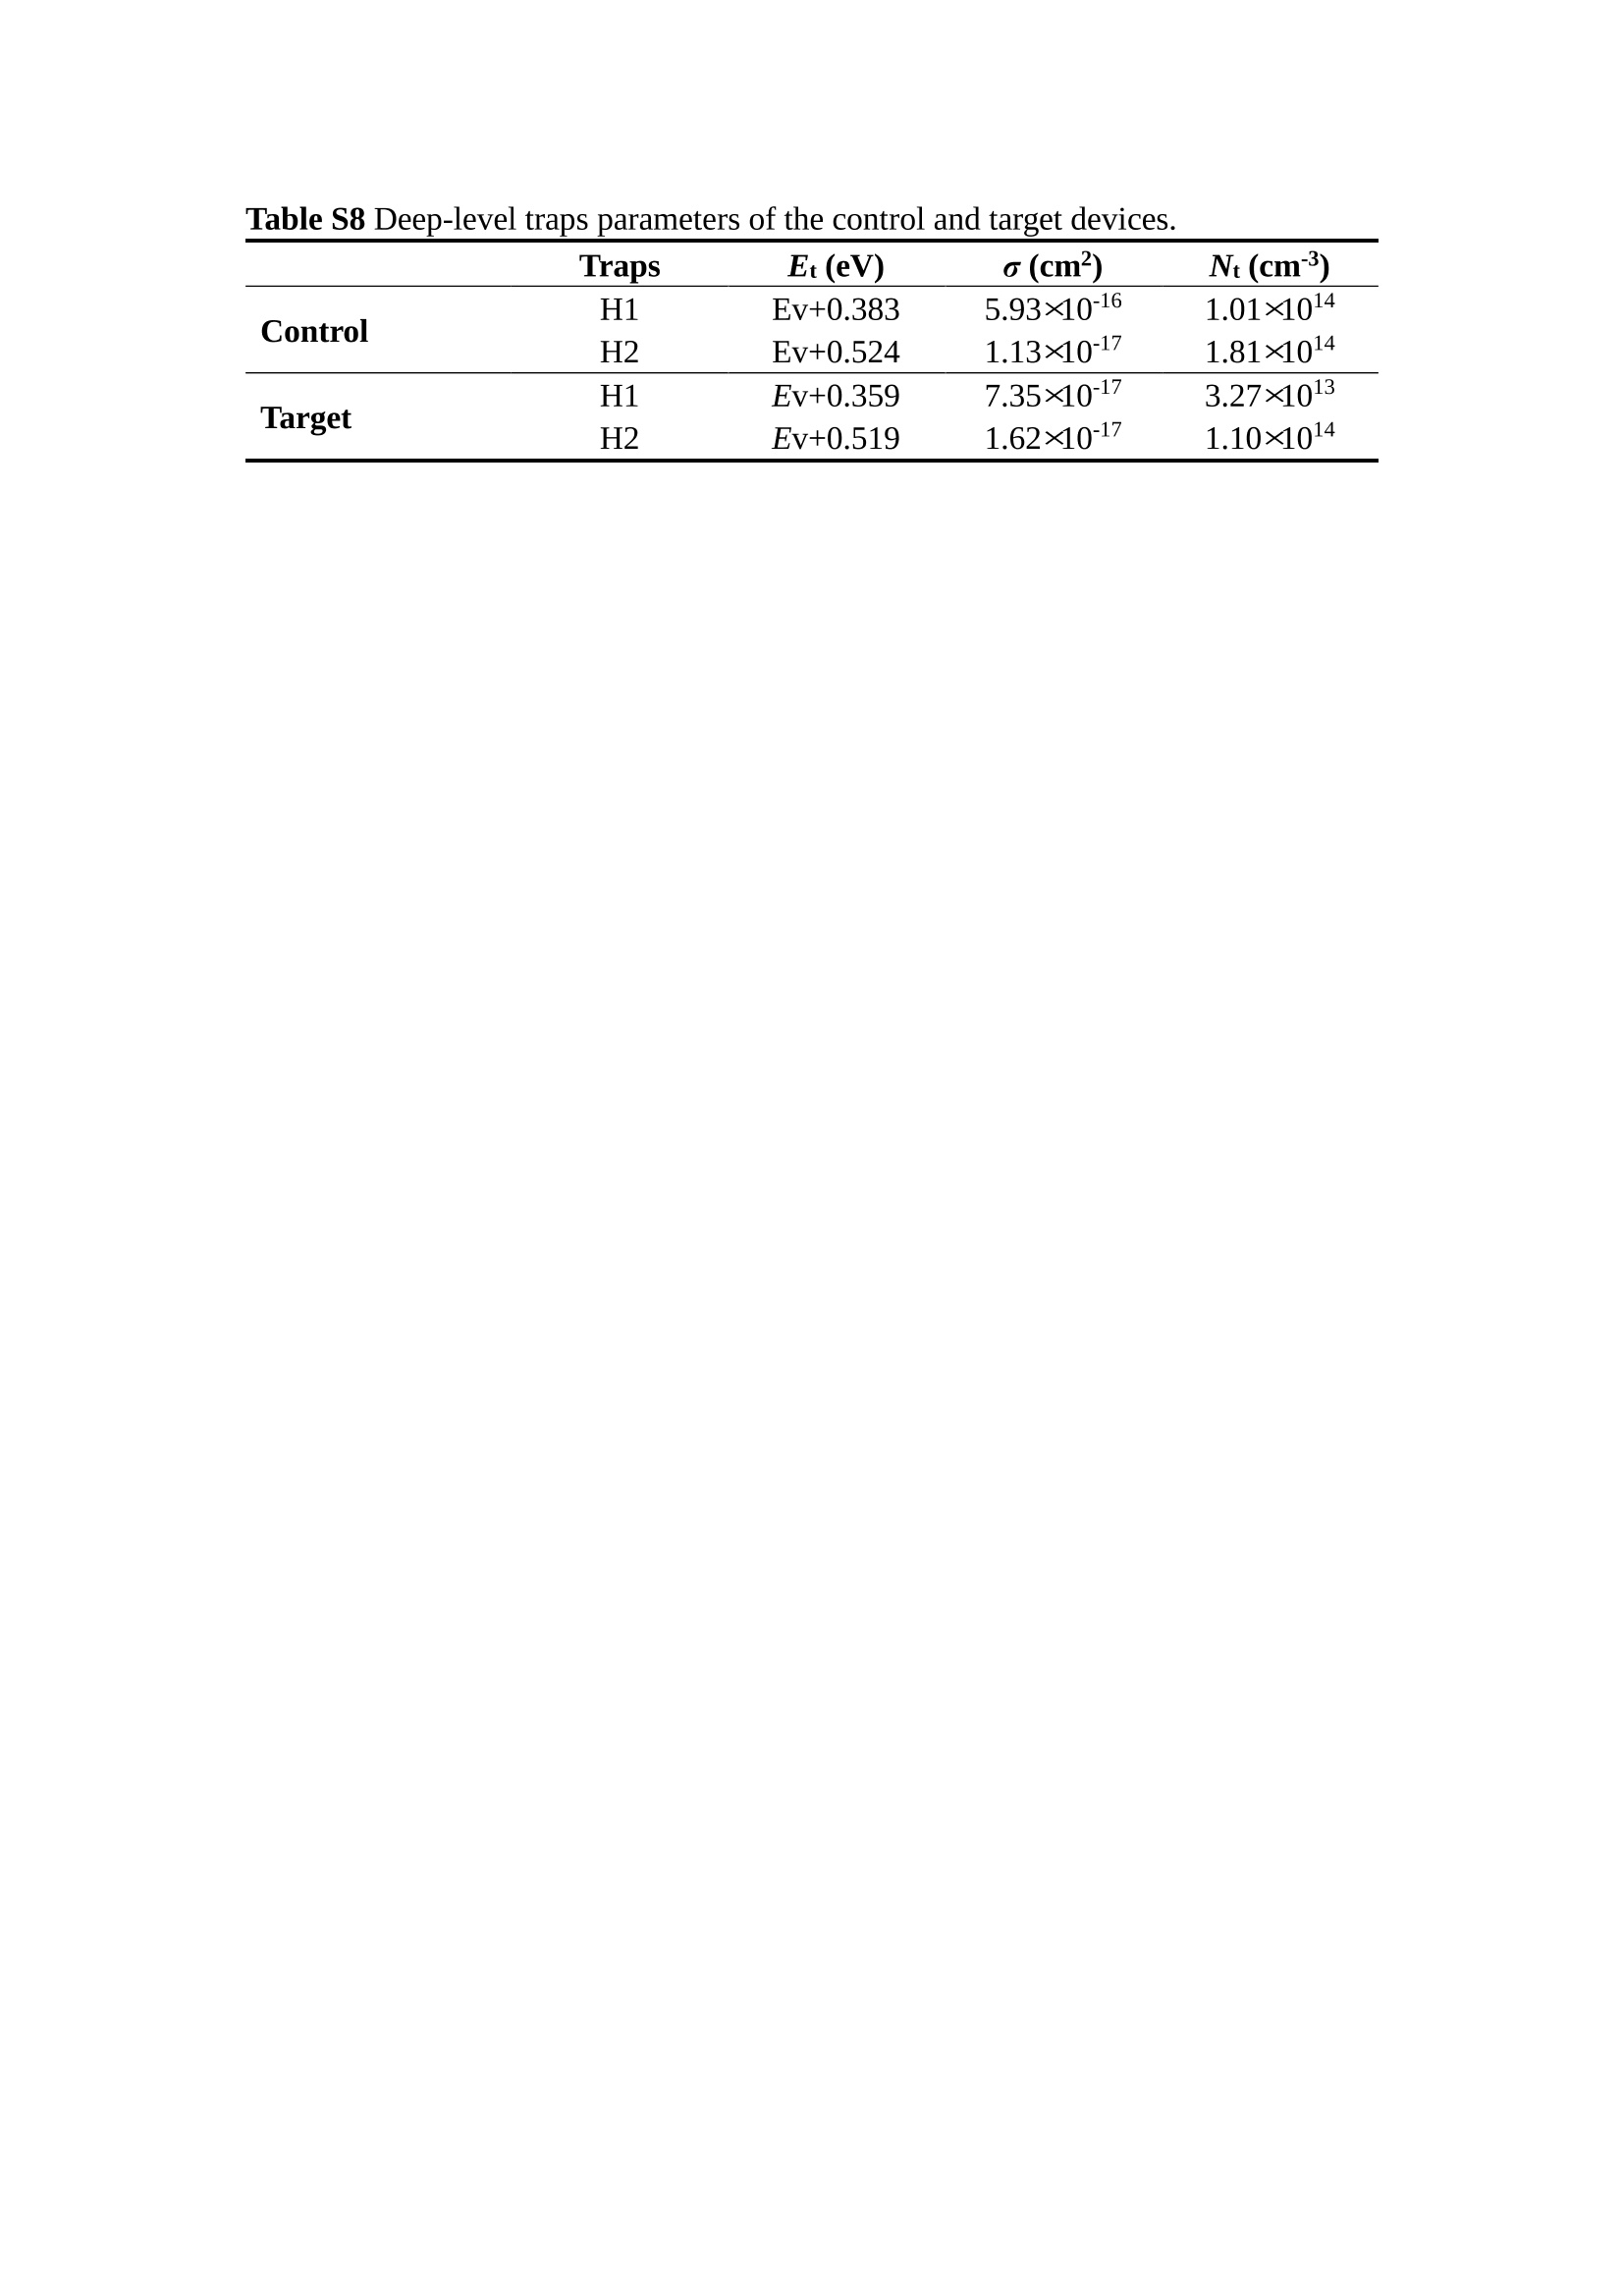
分子掺杂工艺: 研究人员引入了一种使用二甲基胺基掺杂剂的分子掺杂工艺,该工艺能够创建一个与p-钙钛矿/ITO接触良好且能够完全钝化晶界的结构。这种创新工艺提高了钙钛矿太阳能电池的功率转换效率(PCE),实现了经认证的25.39%的PCE,这是对钙钛矿太阳能电池现有标准的改进。分子挤压技术: 该工艺采用了一种独特的“分子挤压”方法,在甲苯淬灭结晶过程中将分子从前驱体溶液排出到晶界和薄膜底部。这种独特的技术导致了钙钛矿薄膜的p-掺杂,有助于提高器件的效率。长寿命和高效率: 器件在逆向扫描时实现了25.86%的效率,并表现出卓越的稳定性,即使经过1000小时的光老化,仍能保持96.6%的初始效率。这表明钙钛矿太阳能电池在性能和可靠性方面取得了显著的进步。在不断发展的光伏领域中,更有效、可持续地利用太阳能的追求是一项不懈的努力。科学家已经探索了许多途径来提高太阳能电池的效率,其中钙钛矿太阳能电池因其性能潜力和经济制造能力的结合而一直脱颖而出。今天,我们将聚焦于一支南方科技大学何祝兵团队率领杰出的研究团队所取得的重大突破,他们实现了钙钛矿太阳能电池效率的深度提高,这标志着我们共同追求更可持续和能效的未来的重要一步。这项开创性的研究提出了一种与传统方法有着根本不同的新型分子掺杂工艺,使用了一种二甲基氨基基团的掺杂剂。这种掺杂剂巧妙地用于形成和谐的p-钙钛矿/ITO接触,并精确地去除晶界缺陷,推动了钙钛矿太阳能电池功率转换效率(PCE)的革命性提升。研究团队创造出了一个惊人的世界纪录,即25.39%的认证PCE,为该行业设定了新的标准和潜力。为了达到这个非凡的成就,研究人员提出了一种被称为“分子挤压”的巧妙技术。这种创新策略迫使前体溶液中的分子在甲苯淬火晶化过程中重新分布到晶界和薄膜底部。因此,这导致了钙钛矿薄膜的p型掺杂,这是实现设备效率显著提高的关键。这种独特的工艺因此标志着一种基础性的突破,从根本上改变了可再生能源范式。然而,这项研究的胜利不仅仅局限于效率领域。该团队的冠军设备不仅在反向扫描中展示了25.86%的PCE,超越了以往的阈值,而且表现出了卓越的稳定性,在经过1000小时的光老化后仍保持了96.6%的初始效率。这项成就解决了钙钛矿太阳能电池技术中的一个主要挑战——效率和稳定性之间的平衡,并为未来旨在优化这两个重要方面的研究提供了有价值的基础。在这项开创性研究的核心是Enlitech的QE-R精密测量设备的精确利用。这种先进的设备为团队提供了准确的读数,使他们能够仔细评估他们的新方法的结果。选择Enlitech的QE-R设备,这种以精度和可靠性闻名的设备,强调了顶级资源在实现突破性成果中的重要性。此外,研究人员深入探究了p-钙钛矿/ITO界面的复杂能带对齐。通过应用紫外光电子能谱(UPS),他们阐明了促进空穴提取的带弯曲现象,这是实现高性能太阳能电池的关键过程。实验揭示了二甲基氨基基团掺杂剂以及与铅离子形成的分子复合物修改ITO基板的功函数,从而获得了有利于高效空穴提取的能带对齐。除了提高效率和稳定性外,研究团队还解决了钙钛矿太阳能电池中常见的滞后效应挑战。通过采用分子挤压技术和精确的掺杂工程,他们显著降低了滞后效应,从而使设备性能更加可靠和可重复。这一突破为实际应用和商业化钙钛矿太阳能电池提供了巨大的潜力,因为它解决了阻碍其广泛应用的主要障碍之一。此外,研究团队对电荷载流子动力学的详尽研究揭示了他们的钙钛矿太阳能电池性能异常出色的机制。通过各种分析技术,包括电荷密度差和Bader电荷分析,他们揭示了钙钛矿薄膜内电荷的重新分布,这归功于有效的分子掺杂策略。这种重新分布导致了提高空穴提取效率和提高整体设备性能的效果。总之,这项开创性的研究代表了钙钛矿太阳能电池领域的重大进展,实现了25.39%的创纪录效率和卓越的稳定性。分子掺杂工艺结合创新的分子挤压技术为实现对设备性能和稳定性的前所未有的控制铺平了道路。Enlitech的QE-R精密测量设备的利用对于准确评估制造的设备的光电性质起到了至关重要的作用。这一非凡成就将我们更接近实现钙钛矿太阳能电池的全部潜力,推动我们迈向由清洁、可再生能源驱动的未来。Figure S25 DFT calculation of neutral DMAcPA absorbed on perovskite surface Supplementary Materials for Inverted perovskite solar cells using dimethylacridine-based dopants Qin Tan t , Zhaoning Lit, Guangfu Luo , Xusheng Zhang, Bo Che, Guocong Chen,Han Gao', Dong He, Guoqiang Ma', Jiafeng Wang', Jingwei Xiu', Huqiang Yi, Tao Chen, Zhubing He * Department of Materials Science and Engineering, Institute of Innovative Materials (I2M), Shenzhen Key Laboratory of Full Spectral Solar Electricity Generation (FSSEG), Southern University of Science and Technology (SUSTech), No. 1088,Xueyuan Rd., Shenzhen, 518055, Guangdong, China. Hefei National Laboratory for Physical Sciences at the Microscale, Department of Materials Science and Engineering, University of Science and Technology of China,No. 96, Jinzhai Road, Hefei, 230026, Anhui, China. t These authors contributed equally to this work. *Corresponding author. Email: hezb@sustech.edu.cn This PDF file includes: Detailed Materials and Methods Supplementary Text Figs. S1 to S38 Tables S1 to S8 Materials and Methods Materials: Anhydrous solvents including N, N-dimethylformamide (DMF), dimethyl sulfoxide (DMSO), chlorobenzene (CB), i sopropanol (IPA), tetrahydrofuran (THF) and Cesium iodide (CsI , 99.999%) were purchased f rom Sigma-Aldrich. Lead iodide (PbI2,99.99%) and lead bromide (PbBr2,99.99%) were purchased from TCI . Formamidinium iodide (FAI , 99.99%) and methylammonium bromide (MABr, 99.99%) were purchased from Great Cel l Solar. Methylammonium chloride (MACl, 99.9%), bathocuproine (BCP, >99%), phenyl-C6i-butyric acid methyl ester (PC61BM,,>99%)and benzeneethanamine, hydrobromide (PEABr, >99.5%) were purchased from Lumtec.9,9-Dimethyl-9,10-dihydroacridine (98%), tetrabutylammonium bromide (98%),N-bromosuccinimide (98%), dibromobutane (98%), triethyl phosphite (97%) were purchased from the Energy Chemical Co. Ltd. Chloroform-d and methyl sulfoxide-d6were purchased from the J&K Scientific. ITO glass were purchased from Suzhou Shang Yang Solar Technology Co. Ltd. All materials above were used as received. (4-(2,7-dibromo-9,9-dimethylacridin-10(9H)-yl)butyl)phosphonic 2acid (DMAcPA) was synthesized in our lab, the detailed synthetic procedure was shown in the part of synthesis. Preparation of pristine and molecule-doped perovskite precursor solution: 6.7mg MABr, 8.8 mg MACl, 18.2 mg CsI, 196.1 mg FAI , 22 mg PbBr2 and 572 mg PbI 2 were dissolved in 865 pl DMF and DMSO solution (volume ratio 4:1) and stirred at 60 ℃for 1 h to prepare undoped precursor solution. For doped solution, another 1~7 mg DMAcPA was added in the preceding solution. Device fabrication: The i nverted (p-i-n) perovskite solar cell studied i n this paper with an architecture of ITO/Perovskite/PC61BM/BCP/Ag.Depending on the ITO/Perovskite(DMAcPA) Schottky contact, we built the inverted device with its device structure shown as the inset in Fig. 5A. The ITO/DMAcPA/Perovskite is taken as the control to evaluate the routine inverted device with DMAcPA as the hole selection layer16-18. The ITO glass substrate was cleaned successively with detergent (2% in deionized water), deionized water, acetone and isopropanol , each for 15 minutes in an ultrasonic bath. After that, the substrate was dried with N2 and t reated with UV-ozone (15 min). For control devices,DMAcPA with a concentration of 0.5~3 mg/mL i n THF were spin coated on the cleaned ITO substrates and annealed at 100 ℃ for 10 min.The as-prepared perovskite precursor solution was spin-coated onto the modified ITO substrate with speed of 1000 rpm for 5 s and 4000 rpm for 30 s. During the last 15 s of the spinning process, the liquid film was treated by drop-casting chlorobenzene solvent (150 pl ). For target device, the doped solution was spin-coated on cleaned ITO substrates directly. The substrates were annealed on a hot plate at 100 ℃ for 50 min,and PEABr with concentration of 1 mg/ml in IPA and DMSO solution (volume ratio 200:1) was dynamically spin-coated on top (4000 rpm, 30 s) and annealed at 100 ℃for 5 min. Then a layer of PC6iBM (20 mg/ml in chlorobenzene, 1500 rpm, 35 s) was coated and annealed at 100 ℃ for 10 min, followed by spin-coating BCP with concentration of 0.5 mg/ml in IPA on top (4000 rpm,30 s). Finally, 100 nm thick of Ag was deposited on top by thermal evaporation. Materials characterizations: NMR spectra were recorded on Bruker Avance 500 and Bruker Avance 400 spectrometer in CDCl3,DMSO-d6, CD2Cl2 and DMF-d7. High resolution mass spectra (HRMS) were recorded on Thermo Scientific Q Exactive mass spectrometer, using electro spray ionization (ESI))as ionization mode.Thermal gravimetric analysis (TGA) was recorded on Mettler TGA1 with a heating rate of 10℃/min under nitrogen flow. UV-vis spectra were recorded on a PerkinElmer Lambda 950spectrometer. The steady state and t ime resolved PL spectra were measured using a Spectrofluorometer (FS5, Edinburgh i nstruments) and 405 nm pulsed laser was used as excitation source for the measurement. Films characterization: X-ray diffraction (XRD) spectra were measured by Bruker D8ADVANCE. X-ray photoelectron spectroscopy (XPS) measurements were carried out on an Omicron ESCA Probe XPS spectrometer (Thermo Scientific ESCALAB 250Xi)using 150 eV pass energy and 1 eV step size for survey scan and 20 eV pass energy and 0.01 eV step size for the fine scan. Contact angle measurements were carried out with a KLA-Tencore D120 surface profiler. SEM was characterized by HITACHI SU8230.FTIR was characterized by Bruker Vertex 70v. Atomic force microscopy-based infrared spectroscopy (AFM-IR): AFM-IR was characterized by nanoIR2 system (Anasys instruments) and the stretching vibration of P-C at 1410 cmwas used to define DMAcPA. In addition to the main text discussion, Fig. 2A-C show the AFM surface morphologies of the top, bottom and detached ITO of the DMAcPA/Perovskite f ilm. Fig. 2D-F are the molecule plenty distribution images corresponding to the regions of Fig. 2A-C,respectively, which are in the same plenty bar and herein show the clear contrast.Brighter yellow means higher plenty of DMAcPA while the red denotes lit t le.The latter can be due to the strong coordination of Pb--O. For the Perovskite(DMAcPA) film, the molecule plenty distribution i mages of Fig 2J-L are corresponding to the morphologies of Fig . 2G-I. I ts detached ITO surface is covered with more DMAcPA molecules than that of the DMAcPA/Perovskite. Regarding the Perovskite(DMAcPA), that means DMAcPA molecules always stick firmly to the PbIz units in the perovskite crystal l ization process from top to bottom.Another interesting point is t hat the top surface of the Perovskite(DMAcPA) film also contains a certain amount of DMAcPA at the grain boundaries, in comparison of the blank background 1of the DMAcPA/Perovskite top surface. Time of Flight Secondary Ion Mass Spectrometry (ToF-SIMS):Depth profi l ing data were obtained with ToF-SIMS 5 system from ION-TOF. Biions were used as primary ions and negative ions were detected. Sputtering was performed using Cs * sputtering ions with 500 eV ion energy, 50 nA i on current and a 200×200 um’ raster size. An area of 50×50 um’ was analyzed using Bi’*ions with 30keV i on energy. To verify the above point, time-of-flight secondary ions mass spectroscopy (ToF-SIMS)was employed to characterize the distribution of DMAcPA t hroughout the perovskite film. Fig. 2M shows the in-depth PO2 distribution of the ITO/DMAcPA/Perovskite film along with PbI and In as references. For the undoped PVK, no PO2 signal ofDMAcPA turns up, which surges up sharply when encountering the pre-coated DMAcPA layer on ITO. In a clear contrast, for the ITO/Perovskite(DMAcPA) film (Fig. 2N), the PO2signal of DMAcPA exists throughout the doped PVK layer and rises sharply too at the bottom. Moreover, as the onset of the blue l ine shows, that sharp rise of PO2 signal occurred after a delay compared with the ITO/DMAcPA/Perovskite, which means the layer of the automatically extruded DMAcPA-PbIx agglomerates i s t hinner than the pre-coated DMAcPA layer on the bare ITO. The ToF-SIMS data unambiguously examine again the conclusion drawn from both SEM and AFM-IR images that DMAcPA exist at both t he grain boundaries throughout the doped perovskite film and the bottom interface with ITO. Device performance characterization: J-V measurements were carried out using a Keithley 2400 source meter in ambient environment (~20℃ and ~60% RH). The unencapsulated devices were measured both in reverse scan (1.2V→-0.2 V, step 0.01V) and forward scan (-0.2V→1.2 V, step 0.01 V) with 200 ms delay time. I l lumination was provided by an Oriel Sol3A solar simulator with AM 1.5G spectrum and the l ight intensity of 100 mW/cm’ was calibrated by a standard KG-5 Si diode. The active area (0.08 cm²) of our device was calibrated with a shadow mask during the measurements.EIS and Mott-Schottky plots were conducted on the Zahner Zennium electrochemical workstation. EQE measurements for devices were conducted with an Enli-Tech (Taiwan) EQE measurement system, and the light intensity at each wavelength was calibrated with a standard single-crystal Si photovoltaic cell. For the stabilized power output (SPO) tests under illumination , bias voltage was fixed at the maximum power point voltage (Vmax), and the current density variation in ambient environment was recorded without controll i ng the device temperature. The long-term operational stabi l ity was conducted by applying the encapsulated devices under 1 sun equivalent LED lamp in ambient environment (~25℃and~50%RH). The maximum power point was recorded every minute. Ultraviolet photo-electron spectroscopy (UPS): To measure work function, ultraviolet photoelectronspectroscopy (UPS)spectra were recordedwithan Imaging Photoelectron Spectrometer (AxisUltra, Kratos AnalyticalLtd), with a non-monochromated He Io photon source (hv=21.22 eV). Au is taken as a reference. Deep-level transient spectroscopy (DLTS): The DLTS measurement was performed via a Phystech FT-1230 HERA-DLTS system. The modified Boonton 7200 capacitance meter (1-75 kHz) was used to examine dynamic capacitance. The effective test area is about 0.14 cm. Then the samples were placed in a liquid-helium cryostat (Lakeshore 335,336). The DLTS temperature scan range was from 370 to 205 K at 2 K intervals.The Arrhenius equation for the hole traps is, Here, te is the emission time constant; Vth,p i s the thermal velocity; Ny is the effective density of states of holes; Er is the energy level of the trap center; Ev is t he energy level of VBM; Xh is the entropy factor for holes; oh is the capture cross-section for holes. Transient absorption (TA)spectroscopy: The femtosecondTAAS spectra were characterized by a setup based on a regenerative amplified Ti:sapphire laser system from Coherent (800 nm, 35 fs, 6 mJ pulse-1, and 1 kHz repetition rate), nonlinear frequency mixing techniques and the Femto-TA100 spectrometer (Time-Tech Spectra). pH measurements The pH of precursor solution was collected using Rex Electric Chemical E-301-QC pH meter. The pH meter was calibrated with three standard solutions before each test. After calibration, the pH count was washed several t i mes with the pure solvents. Then, each solution was tested. Hall measurements Hall measurements were performed on HL5500 Hall system from Nanometrics Co. Ltd.at room temperature and dark conditions. Samples were prepared in Van der Pauw geometry. Connections of silver wires for the electrical measurements were made by conductive silver paste. After drying process of the paste, the ohmic behavior of the metal contacts was S4 checked by the linear variation of the current-voltage (I-V)characteristics which was observed to be independent of the polarity of the applied current and the contact combinations for each sample. Measurements were done under 0.5T magnetic field. The sample size was 15 ×15 mm. The DMAcPA doped perovskite is tested to be of positive Hall coefficient and herein p-type, which is consistent to the UPS test results discussed in our work. Density functional theory (DFT) calculation: All the first-principles calculations were carried out based on the density functional theory (DFT), as implemented in the Vienna Ab-initio Simulation Package (1). The Perdew-Burke-Ernzerhof form of exchange-correlation functional (2) were utilized. The plane-wave energy cutof f was 290 eV,together with the projector augmented wave pseudopotentials. A single gamma point was used for the k-point sampling for molecular systems and a 1×2×1 k-point mesh for the slabs. The structures were optimized with an energy and force tolerance of 10eV and 0.02 eV/A, respectively. The surface adsorption was carried out on a PbI-terminated FAPbI; slab with a size of 19.2×12.8 ×11.3 A, together with a vacuum layer of 21 A in the out-of-plane direction. The binding energy Es of is defined by Eb =E(complex) -ZE(component). The Van der Waals interactions in the dimers are simulated using the DFT-D3 approach (3). All the DFT calculat i ons were carried out on t he Taiyi cluster supported by t he Center for Computational Science and Engineering of Southern University of Science and Technology. Chemical structure and synthesis of DMAcPA Figure S1. The chemical structure and synthesis procedure of DMAcPA. Synthesis of 2,7-dibromo-9,9-dimethyl-9,10-dihydroacridine (2) A 100 mL round bottom flask was charged with 9,9-dimethyl-9,10-dihydroacridine (1)(0.89 g, 4.24 mmol) and dichloromethane (10 mL) in ice bath, then N-bromosuccinimide (1.51 g, 8.48 mmol) was added in portion. The mixture was warmed up to room temperature and stirred overnight. The reaction was quenched with water and extracted with dichloromethane, the organic layers were combined and dried with anhydrous magnesium sulfate, then removed t he organic solvent with rotary evaporator to give t he crude product. A flash column chromatography with eluent as petroleum ether/dichloromethane of 10/1 was used to further puri f ication. The title compound 2was white solid (1.40 g, yield 90%). 'H NMR (400 MHz, DMSO-d6) 8 9.17 (s, 1H), 7.45 (d, J=2.3 Hz, 2H), 7.21 (dd,J =8.5,2.2 Hz, 2H), 6.73 (d,J=8.5 Hz, 2H), 1.46 (s, 6H) ppm. 13C NMR (101 MHz,DMSO-d6)8137.99, 130.54,130.02,128.64,115.99,111.54,36.59,31.42. Synthesis of 2,7-dibromo-10-(4-bromobutyl )-9,9-dimethyl-9,10-dihydroacridine (3)A 100 mL two neck flask was charged with intermediate2 (1.00 g, 2.72 mmol) and tetrabutylammonium bromide (0.32 g, 0.27 mmol)were dissolved i n dibromobutane (15mL), then 50% KOH aqueous solution (5 mL) was added dropwise. The mixture was heated to 65℃ and stirred overnight. The reaction was quenched with water and extracted with dichloromethane, the organic layers ware combined and dried with anhydrous magnesium sulfate, then removed the organic solvent with rotary evaporator to get the crude product. Silica gel column chromatography was used for further puri f ication with eluant as petroleum ether/dichloromethane = 10/1 to give the title compound (3) as colorless oi l (1.20 g, yield 89%). 'H NMR (400 MHz, CDCl3) 8 7.48 (d,J=2.3 Hz, 1H), 7.32 (dd,J=8.7, 2.3 Hz,1H), 6.82 (d, J=8.8 Hz, 1H), 3.97-3.83(m,1H),3.48 (t, J=6.1 Hz, 1H),2.14-1.90(m, 1H), 1.50 (s, 3H) ppm. 13C NMR (101 MHz, CDCl3) 8 139.29,134.15,129.57,127.55, 114.21,113.42,45.05,36.57,32.84,30.12,28.57, 24.44 ppm.Synthesis of (4-(2,7-dibromo-9,9-dimethylacridin-10(9H)-yl)butyl)phosphonic acid (DMAcPA) A 100 mL Schlenk t ube was charged with intermediate 3 (1.20 g, 2.39 mmol ) and triethyl phosphite (10 mL), then the mixture was heated to 160℃ and stirred overnight under nitrogen atmosphere. The extra triethyl phosphite was removed by reduced pressure distil l ation to give a l ight-yellow oil without further purification. The light-yellow oil was dissolved in anhydrous 1,4-dioxane (10 mL) at room temperature and trimethylbromosilane (3.66 g, 23.90 mmol) was added dropwise, then the mixture was st i rred overnight. The 1,4-dioxane was removed with rotary evaporator to give a white solid. The white solid was dissolved in methanol (10 mL) at room temperature, then deionized water was added dropwise until the mixture became opaque and st i rred for another 12 h. The crude product was collected by f iltration and washed with deionized water. The crude product was dissolved in THF (5mL) andreprecipitate in acetone (20mL) and f iltrated to give t he f inal product as white solid (0.94 g, yield 78%). H NMR (400 MHz,DMSO-d6)87.48 (d,J=2.4 Hz,2H), 7.33 (dd,J=8.8, 2.3 Hz,2H), 7.03 (d,J=8.9 Hz,2H), 3.89 (t, J=7.6 Hz,2H), 1.74 (td,J=9.7,7.2,3.1Hz,2H),1.66-1.54 (m, 4H), 1.42 (s, 6H) ppm. I3C NMR (101 MHz,DMSO-d6) 8 139.44, 134.00,129.99,127.53,115.56,112.76,45.33, 39.56,39.36, 36.59,29.06, 28.28,26.92,26.53,26.38,20.79,20.74 ppm. 3IP NMR (202 MHz, DMSO-d6) 8 26.42 ppm. HRMS (m/z):[M+H]* calcd. forC19H23Br2NO3P501.9777, found: 501.9779. Elemental analysis: calcd. for C19H22Br2NO3P, %: C 45.35, H 4.41, N 2.78,found,%: C 45.65, H 4.47, N 2.66. Figure S2 DFT calculation of steric effect (e) Figure S2. DFT calculation of steric effect. (a) (b) (c) (d) are the chemical structures,(e) (f) (g) (h) are the optimized molecular structure, and (i ) () (k) (l ) are the corresponding dimers of DHAcPA, DMAcPA, DEAcPA and MeO-2PACz. That steric effect can be predicted by Density Functional Theory (DFT) calculation on T-丁 stacking of molecules. Basing on a dimer model, AcPA molecules with different branch chain sizes from dihydrogen (DHAcPA), dimethyl (DMAcPA) to diethyl (DEAcPA) were screened. DHAcPA show the lowest binding energy and easily to stack and aggregate. The DHAcPA has the smallest l ayer distance of ~3.68 A and the lowest binding energy (set as 0 meV for comparison) of three materials, which indicates that DHAcPA is easily aggregate in the perovskite f i l m deposition process. Moreover, the aggregate organic molecules would be a potential defect in the perovskite film and become a recombination center, and f inally result in a bad photovoltaic performance and poor device stability. With dimethyl group (Fig. S2 j ), the binding energy of DMAcPA dimer is 31 meV higher than DHAcPA, larger than the thermal fluctuation energy (~26 meV). I ts distance~4.07A i s also far from 3.35 A of typical 兀-冗 stacking.For DEAcPA, the layer distance is ~4.22 A and the binding energy of dimer is 500 meV.The largest layer distance and binding energy indicate that DEAcPA is difficult to form intermolecular interaction and probably suppress charge transport process. Besides, the DEAc is not a commercial chemical product and difficult to synthesis. Compared to DHAcPA and DEAcPA, DMAcPA with l ayer distance of ~4.01 A and binding energy of 31 meV, the appropriate steric effect would be beneficial for DMAcPA dispersion in perovskite precursor solution and restrain the molecular aggregation. The excellent dispersibility of DMAcPA with relatively lower dissolution rate would finally distribute on the grain boundary and is brought to the bottom sur f ace of perovskite i n the anti-solvent assisted film deposition process. We also calculate the MeO-2PACz as a benchmark, which is a commercial material with phosphonic acid group and widely used in perovskite solar cells. As shown i n figure S11, MeO-2PACz dimer with t he smallest layer distance of ~3.53 A and a small binding energy of 14 meV, which indicate that MeO-2PACz has strong intermolecular interaction and is easy to aggregate in perovskite precursor solution. NMR spectra 10.510.0 9.5 9.0 8.5 8.0 7.5 7.0 6.5 6.0 5.5 5.0 4.5 4.0 3.5 3.0 2.5 2.0 1.5 1.0 0.5 0.0 f1 (ppm) Figure S3. H NMR spectrum of intermediate 2. OO O O O SS S OS S OS WW W W W W心O O a O Q 8::瓦 0品 导 号: f1 (ppm) Figure S4. 13C NMR spectrum of intermediate 2. F i gure S5. 'H NMR spectrum of intermediate 3. Figure S6. 1’C NMR spectrum of intermediate 3. f1 (ppm) Figure S7. 'H NMR spectrum of DMAcPA. Figure S8. 13C NMR spectrum of DMAcPA. -140 -160 -180 -200 -220 -240-6020 -80 -100 0 -20 -120140 120 100 80 60 40 -40f1 (ppm) Figure S9.3P NMR spectrum of DMAcPA. Figure S10 TGA of DMAcPA Temperature (℃) Figure S10. Thermal gravimetric analysis (TGA) curve of DMAcPA with a heating rate of 10 ℃ /min.The thermal decomposition temperature (Ta, 5% weight loss) of DMAcPA at 217.8 ℃ represents a good thermal stability. Figure S11 UV-vis absorption spectra of DMAcPA. Figure S11. UV-vis spectra of DMAcPA i n THF solution (10M) and films. The optical bang gap (Eg=3.65 eV) of DMAcPA was calculated from the equation of Eg=1240/Aonset (eV), where theonset wavelength of absorption spectra is 340 nm. Figure S12 DFT calculation of HOMO and LUMO (a) Figure S12. DFT calculation of DMAcPA based on B3LYP/6-311G*. Electron cloud distributions of (a) HOMO and (b) LUMO. Figure S13 UPS of DMAcPA Figure S13. The (a) cut-off region and (b) onset region of ultraviolet photoelectron spectroscopy (UPS) of DMAcPA fi l ms. The work function (WF) of DMAcPA was calculated by the equation of WF=21.22 eV-Ecut-off=5.48 eV. The HOMO of DMAcPA was calculated by the equation of HOMO=-[21.22 eV-(Ecut-off-Er)] = -5.98 eV. By combining t he opt i cal band gap (Eg=3.65 eV) of DMAcPA in Figure S10, t he LUMO of DMAcPA was calculated as -2.33 eV by the equation of LUMO=HOMO+Eg.DMAcPA with a high LUMO energy level would effectively suppress the electron transporting to the ITO electrode and decrease the recombination energy loss at the interface. Figure S14 UV-vis absorption spectra and tauc plots of the three kinds of perovskite films Wavelength (nm) Figure S14. UV-vis spectra of the three kinds of perovskite f ilms deposited on ITO substrates. The Perovskite means the pristine undoped perovskite film directly deposited on ITO substrate. The DMAcPA/Perovskite means the prist i ne undoped perovskite film deposited on a DMAcPA layer coated ITO substrate. The Perovskite(DMAcPA) means t he DMAcPA doped perovskite f ilm directly deposited on ITO substrate. Al l the three kinds of perovskite films exhibit the same absorption edge of 803 nm in wavelength, which indicates that large-size DMAcPA can ’t enter the lattice and change the phase. Figure S15 PL spectra of the three kinds of perovskite films Wavelength (nm) Figure S15. Steady state photoluminescence (PL) spectra of the three kinds of perovskite f i lms deposited on glass.Compared with thePerovskite sample, the PL intensity of DMAcPA/Perovskite and Perovskite(DMAcPA) with a little and huge enhancement, respectively, represented higher crystall i nity and lower trap state density.The steady state PL result was in good agreement with the XRD and SEM results i n the main body of manuscript. Table S1 Fitting results of the TRPL spectra of Perovskite, DMAcPA/Perovskite and Perovskite(DMAcPA) films deposited on glass substrate. A1 ti(ns) A2 T2(ns) Tavge (ns) Perovskite 743.11 14.88 387.77 524.56 498.28 DMAcPA/Perovskite 147.39 31.42 1295.12 949.80 946.38 Perovskite(DMAcPA) 204.96 5.04 1115.19 1927.75 1926.83 The TRPL decay spectra were fitted by a biexponential function: and the average decay l ifetime was calculated with function: Figure S16 XRD patterns of PbI2 films with different dosage of DMAcPA 20 (degree) Figure S16. The XRD patterns of pristine PbIz f ilm and doped PbIz film with different molar ratio DMAcPA. As shown, the peak intensity declined significantly when the fi l ms were doped by DMAcPA. Figure S17 Peel-off method for the buried bottom surfaces of Perovskite films Figure S17. The photography of perovskite film for bottom surface characterization.The bottom surface sample of perovskite film was fabricated with the following method:the top surface of prepared perovskite f ilm was partly pasted together with a glass slide through UV glue. After the glue is solidified, the film was peeled off from the ITO substrate, then the bottom surface of perovskite film for characterization was got. Figure S18 EDX characterization between PbIz flakes and common grains of prinstine perovskite films Figure S18. Energy dispersive X-ray spectroscopy (EDX) collected from the bright (PbI2 flakes, A) and dark region (common grain, B) i n the SEM of pristine perovskite fi l m. The element analysis results are summarized in table S2 and S3, respectively. Table S2 Data of EDX of position A Element Weight percentage Atomic percentage CK 4.81 39.16 Pb M 41.87 19.76 IL 53.32 41.08 Total 100.00 Table S3 Data of EDX of position B Element Weight percentage Atomic percentage CK 6.43 45.93 Pb M 35.15 14.56 IL 58.42 39.51 Total 100.00 Figure S19 Contact angle of substrate surfaces Figure S19. Contact angles of perovskite precursor solution on (a) ITO and (b)ITO/DMAcPA substrates, and (c) perovskite precursor solution with DMAcPA on ITO substrate. The contact angle of perovskite precursor solution on ITO and ITO with DMAcPA are 10.10°and 39.40, respectively, indicating a poor wettability of the latter.However, the perovskite precursor solution doped with DMAcPA has a contact angle of 16.00, which is close to the bare ITO substrate with pure perovskite precursor solution. The above results demonstrate that the DMAcPA doped perovskite precursor solution has the suitable wetting ability with bare ITO to grow compact perovskite crystalline films. Figure S20 FTIR spectra of DMAcPA and pristine undoped perovskite films Wavenumber (cm1) Figure S20. FTIR spectra of pristine undoped perovskite and DMAcPA films. I n order to i nvestigate the distribution of DMAcPA at i nterfaces, AFM-IR was employed i n this work. A feature peak ofP-C stretching vibration ofDMAcPA at 1415 cm-1 was selected for AFM-IR measurements to exclusively display DMAcPA on the perovskite film surfaces. Figure S21 XPS of two kinds of detached ITO surfaces. Figure S21. XPS spectra of Pb 4f (a), I 3d (b) and P 2p (c) at the detached ITO surface from ITO/DMAcPA/Perovskite (blue) and ITO/Perovskite(DMAcPA) (red) samples. Figure S22 SEM images of the DMAcPA doped perovskite film with the dosage of 10mg/ml 500n m Figure S22. SEM i mages of the doped perovskite film with a dosage of 10 mg/mL DMAcPA: (a) top surface, (b) cross section and (c) buried bottom surface. Obviously,the grain boundaries are expanded with i mpressive gaps in both the top (a) and bottom surfaces (b). The grain surfaces at the bottom become much rougher further prove an autogenic layer ofDMAcPA and PbIx coordinated agglomerates extruded to the bottom surface owing to the molecule-extrusion process. Table S4 pHtest results of DMF/DMSO (4:1) mixed solvent, FAI, PbIz and Perovskitecontained solutions with the identical composition and concentration,without (Left) and with 10 mg DMAcPA molecules (Right) dissolved in. Solution Kind pH Solution Kind pH DMF/DMSO 8.40 +DMAcPA 6.25 FAI 7.80 FAI+DMAcPA 4.30 PbI2 9.44 PbI2+DMAcPA 3.34 Perovskite 7.57 Perovskite+ DMAcPA 4.12 pH test is a good method to reveal the concentration of solvated protons2. Table S4 shows the pH test results of DMF/DMSO (4:1) mixed solvent, FAI, PbI2 and PVK contained solutions with the identical composition and concentration to our process.The data show clearly the dissolution of DMAcPA molecules results in the increase of solvated [H*] in each solution, which ambiguously reflects the deprotonating of DMAcPA happens in its dissolving process. Both PbI and FAI can stimulate the ionization degree of DMAcPA. In the PVK solution, the solvated [H*] can increase by over 3 orders after dissolving DMAcPA, with the pH value rising from 7.57 to 4.12. Figure S23 PbIz concentration dependent shift of active hydrogen of DMAcPA in DMF-d7 Figure 23. PbI2 concentration dependent shift of active hydrogen of DMAcPA i n DMF-d7. PbI z dosage increase sucessively from bottom to top, and the active hydrogen peak moves consectively to low chemical shift or highfield. Larger shift caused by PVK can be attributed to higher concentration of iodine ions input, which is i n agreement with the enhanced ionization of DMAcPA by iodine ions in the above pH tests. Figure S2413P NMR results of DMAcPA invovled solutions 28.5 28.2Chemical shift (ppm) F i gure S24. 3lP NMR results of DMAcPA invovled solutions. DMAcPA-only in DMF-d7 (red); DMAcPA+PbI2 in DMF-d7 (blue); DMAcPA+FAI in DMF-d7 (yellow);DMAcPA+FAI+PbI2 i n DMF-d7 (green). The up-field shift of 3P resonance signal from 28.06 ppm to 27.93 ppm in DMF solution with dissolving those iodides,demonstrates the deprotonated PA group i s probably influenced by t he H--I hydrogen bond. Figure S25. DFT calculation of neutral DMAcPA absorbed on perovskite surface. Stable adsorption structure on the PbIz-terminated FAPbI 3 surface by the P=O--Pb dative bond. Since the negative charge of the adsorbed deprotonated DMAcPA must be balanced in real experiments, we add a Hnear the adsorption site to mimic the spat i al effect of solvated cations, e.g. H*[DMF ]x or H*[DMSO]x, which prevents a direct contact with the deprotonated DMAcPA. Table S5 The bond length variation of original DMAcPA and the ionized DMAcPA absorbed on perovskite crystal surface (Fig. 3B) after optimization. Neutral DMAcPA Ionized DMAcPA absorbed on perovskite Bond type Bond length (A) Bond type Bond length (A) P-O(2-3) 1.63 Pb-O (1-2) 2.18 P-O (3-4) 1.62 P-O(2-3) 1.57 P=O(3-5) 1.49 P-O (3-4) 1.64 P=O (3-5) 1.49 I-H(6-7) 1.88 I-H(7-8) 1.98 Figure S26 XPS of buried bottom surfaces of two kinds of perovskite films Binding Energy (eV) Figure S26. XPS spectra of Pb 4f (a), I 3d (b) and survey (c), detected at the bottom surfaces of pristine (red) and DMAcPA dopped (blue)perovskite f i l ms, ident i cal to the fabrication process reported in the main text. The red shift in binding energy of Pb detected at the buried bottom surface of perovskite (Fig. S26a) can also i ndicate the O--Pb dative bond weakens the binding energy of the main-flow Pb-I covalent bond and herein accounts for the red shift of Pb. Regarding the I shift (Fig. S26b), it can be attributed to hydrogen bonding of P-O-H--I, which has been well discussed and examined by the above down-field chemical shift of 'H NMR signal (Fig. 3A). Figure S27 Photovoltaic performance of the device based on the ITO/Perovskite Voltage (V) Figure S27. J-V curves and photovoltaic performance parameters of the champion PSC with ITO/Perovskite/PC61BM/BCP/Ag structure. A champion PCE of 7.75% was achieved when reverse scan, with a Jsc of 20.22 mA/cm’, a Voc of 0.523 V and an FF of 73.28%. Figure S28 Optimization of the concentration of DMAcPA modified ITO Figure S28. Photovoltaic performance of PSCs s w w i i t t h h d d i i f ff fe e r rent concentration of DMAcPA modified ITO substrate. The centre line represents the median value, the smal l circle indicates the mean value, the box gives the standard deviation, and the whiskers represent the minimum and maximum values. In t he stat i stics, 24 devices were used for each kind of devices. The thickness of DMAcPA film coating on ITO substrate was optimized by turning t he concentration of DMAcPA in dry THF solution. With the increasement of DMAcPA from 0.5 mg/mL to 3 mg/mL, the Voc was gradually increased whi l e the FF was decreased. The Jsc of devices represented a significant enhancement when the concentration of DMAcPA increased from 0.5 mg/mL to 1mg/mL, then keep t he same value. Above all, the champion PCE (23.03%, average PCE of 22.50%) of the DMAcPA/Perovskite device was achieved with optimal 1 mg/mL DMAcPA. Figure S29 Steady Power Output (SPO) of the target and the control PSCs Time (s) Figure S29. Steady power output (SPO)testedfor at a duration of 500 s at 0.96 eV and 1.04V for the DMAcPA/Perovskite (Control) and the Perovskite(DMAcPA)(Target)based champion devices, respectively.This results confirms the reliability of our J -V measurements. Figure S30 Statistic device parameters of the target and the control PSCs Figure S30. Statistic photovoltaic parameters of PSCs based on DMAcPA/Perovskite (Control) and Perovskite(DMAcPA) (Target) in each batch of 24 devices. The center line represents the median value, the box gives the standard deviation, and the whiskers represent the minimum and maximum values). Table S6 Corresponding numbers of the above statistic plots of the Control and Target PSCs. Parameters of the champion devices were listed in the parentheses. Jsc (mA/cm²) Voc (V) FF(%) PCE (%) Control 25.41±0.07 (25.45) 1.128±0.004 (1.133) 78.43±1.11 (79.87) 22.50±0.38 25.54±0.10 (23.03) Target (25.69) 1.189±0.003 (1.194) 83.79±0.68 (84.91) 25.45±0.28 (25.86) The photovoltaic performance parameters of Control and Target devices have a narrow distribution, which demonstratesgood reproducibi l ity of our fabrication process. Figure S31 Certification report 三三二 ,c an d Ca libra tion Cen tei Repor t No.22TR112401 Figure S31. Certification report of the target device based on the Perovskite(DMAcPA)by Shanghai Institute of Microsystem and Information Technology (SIMIT). Figure S32 Device performances of the devices based on MeO-2PACz Voc(V) Figure S32. J-V curves (reverse scan) and photovoltaic performance parameters of the champion PSCs with ITO/Perovskite(MeO-2PACz)/PC61BM/BCP/Ag and ITO/MeO-2PACz/Perovskite(undoped)/PC61BM/BCP/Ag structures. The champion PCE of 19.46%was achieved (reverse scan) with a Jsc of 23.83 mA/cm’, a Voc of 1.081 V and an FF of 75.54% for device based on MeO-2PACz doped perovskite. While the champion PCE of device based on the structure ofITO/MeO-2PACz/Perovskite is 22.26% with a Jsc of 24.9 mA/cm², a Voc of 1.122 V and an FF of 79.68%. FigureS33(Optimization off tthe dosage off N MeO-2PACz in the doped Perovskite(MeO-2PACz) Figure S33. Statistic photovoltaic parameters of the target device based on the Perovskite(MeO-2PACz) in a batch of 24 devices, with different dosage ofMeO-2PACz in perovskite precursor solut i on ranging from 2 mg/ml to 5 mg/ml. The peak PCE i s determined by the highest FF and Voc at 3 mg/ml. Figure S34 Development summary of so called“HTL-free”PSCs Year Figure S34. The PCE progress of so called“HTL-free”PSCs.(9-17) FigureS335Optimization of the dosage of DMAcPA in the doped perovskite(DMAcPA) Figure S35. Statistic photovoltaic parameters of the target device based on the Perovskite(DMAcPA) in a batch of 24 devices, with different dosage of DMAcPA in perovskite precursor solution ranging from 1 mg/ml to 7 mg/ml. The centre line represents the median value, the small circ l e i ndicates the mean value, the box gives the standard deviation, and the whiskers represent the minimum and maximum values.The champion device comes from the optimal dosage of DMAcPA in the perovskite precursor solution after intensive opt i mization successively from 1 to 7 mg/ml (Fig.S28). For 1 mg/ml, both Voc of 0.92 V and Jsc of 25.06 mA/cm’ means the hole-extraction at perovskite/ITO interface is not effective, due to insufficient extruded interlayer according to that molecule-extrusion model. When the dosage rises to 2mg/ml and more, Voc jumps to over 1.1V and keeps a narrow distribution around 1.18V while Jsc also maintains from 25.2 to 25.8 mA/cm’, which claims a broad window of DMAcPA dosage for high-quality perovskite film and perovskite/ITO interface. The peak PCE i s determined by the highest FF at 4 mg/ml, and the dosage dependent FF variation reflects the extruded layer tends to be electrically compact for both hole-extraction and electron-blocking when the dosage i ncreases from 2 mg/ml to 4 mg/ml while the further dosage increment would augment that extruded layer thickness and herein increase the series resistance and decline FF. Figure S36 Transient absorption spectroscopy of the three kinds of perovskite film Figure S36. Transient absorption (TA) decay kinetics of ITO/Perovskite (green),ITO/DMAcPA/Perovskite (blue) and ITO/Perovskite(DMAcPA) (red) probed at 490nm.in a transmission mode. Figure S37 Initial device performances of the two devices for MPPT tests Figure S37 The initial J-V curves of the Control and Target PSCs tested before their MPP tracking . Figure S38 Equivalent-circuit model ECM for EIS fitting Figure S38. The equivalent-circuit model (ECM) employed for EIS f itting of PSCs,consist of the series resistance (Rs), the recombination resistance (Rrec) and the capacitance. Table S7 Fitting parameters of PSCs from Nyquist plots. Rs (Q) Rrec (Q) Control 17.85 2046 Target 16.78 4028 Table S8 Deep-level traps parameters of the control and target devices. Traps Et(eV) s(cm²) Nt (cm) Control H1 Ev+0.383 5.93×10⁻¹⁶ 1.01×10¹⁴ H2 Ev+0.524 1.13×10⁻¹⁷ 1.81×10¹⁴ Target H1 Ev+0.359 7.35×10⁻¹⁷ 3.27×10¹³ H2 Ev+0.519 1.62×10⁻¹⁷ 1.10×10¹⁴ References 1. G. Kresseet al., Efficient i terative schemes for ab initio total-energy calculations using a plane-wave basis set . Phys. Rev. B 54, 11169 (1996). 2. J. P. Perdew et al., K. Burke, M. Ernzerhof. Generalized gradient approximation made simple . Phys. Rev. Lett. 77,3865(1996). 3. S. Grimme et al., A consistent and accurate ab initio parametrization of density functional dispersion correction (DFT-D) for the 94 elements H-Pu. J. Chem.Phys. 132, 154104(2010). 4. J. J. Sun et al., NiOx-Seeded Self-Assembled Monolayers as Highly Hole-Selective Passivating Contacts for Efficient Inverted Perovskite Solar Cells.Solar RRL 5, 2100663(2021). 5. K. Wapner et al., Structure and stability of adhesion promoting aminopropyl phosphonate layers at polymer/aluminium oxide i nterfaces. Int. J. Adhes. Adhes.28,59(2008). 6 L. Mao et al, Fully Textured, Production-Line Compatible Monolithic Perovskite/Silicon Tandem Solar Cel l s Approaching 29% Efficiency. Adv.Mater: 34, 2206193 (2022). / S. D. Alexandratos et al., Through-bond communication between polymer-bound phosphinic acid ligands and trivalent metal ions probed with FTIR spectroscopy. Vib. Spectrosc. 95,80(2018). 8 X. Li et al., Improved performance and stability of perovskite solar cells by crystal crosslinking with alkylphosphonic acid ω-ammonium chlorides. Nat.Chem. 7,703(2015). 9. L. Etgar et al., Mesoscopic CH3NH3PbI3/TiO2 heterojunction solar cells. J.Am. Chem. Soc. 134, 17396 (2012). 10. W. A. Laban, L. Etgar, Depleted hole conductor-free lead halide iodide heterojunction solar cells. Energy Environ. Sci. 6, 3249(2013). 11. S. Aharon, S. Gamliel, B. El Cohen, L. Etgar, Depletion region effect of highly efficient hole conductor free CH3NH3PbI3 perovskite solar cel l s. Phys. Chem.Chem. Phys. 16,10512(2014). 12. Y. Li et al., Hole-conductor-free planar perovskite solar cells with 16.0%efficiency. J. Mater. Chem. 4 3, 18389(2015). 13. S. Ye et al., A Strategy to Simplify the Preparation Process of Perovskite Solar Cells by Co-deposition of a Hole-Conductor and a Perovskite Layer. Adv. Mater 28,9648(2016). 14. S. Ye et al., A Breakthrough Efficiency of 19.9% Obtained i n Inverted Perovskite Solar Cel l s by Using an Efficient Trap State Passivator Cu(thiourea)I.J. Am. Chem. Soc. 139, 7504 (2017). 15. W. Q. Wu et al., Molecular doping enabled scalable blading of efficient hole-transport-layer-free perovskite solar cells. Nat. Commun. 9, 1625(2018). 16. J. Xie et al., Perovskite Bifunctional Device with Improved Electroluminescent and Photovoltaic Performance through Interfacial Energy-Band Engineering.Adv. Mater: 31, 1902543 (2019). 17. X. Zhou et al., Highly efficient and stable hole-transport-layer-free inverted perovskite solar cells achieved 22% efficiency through p-type molecular synergistic doping. Nano Energy104,107988 (2022).
确定


还剩46页未读,是否继续阅读?

产品配置单

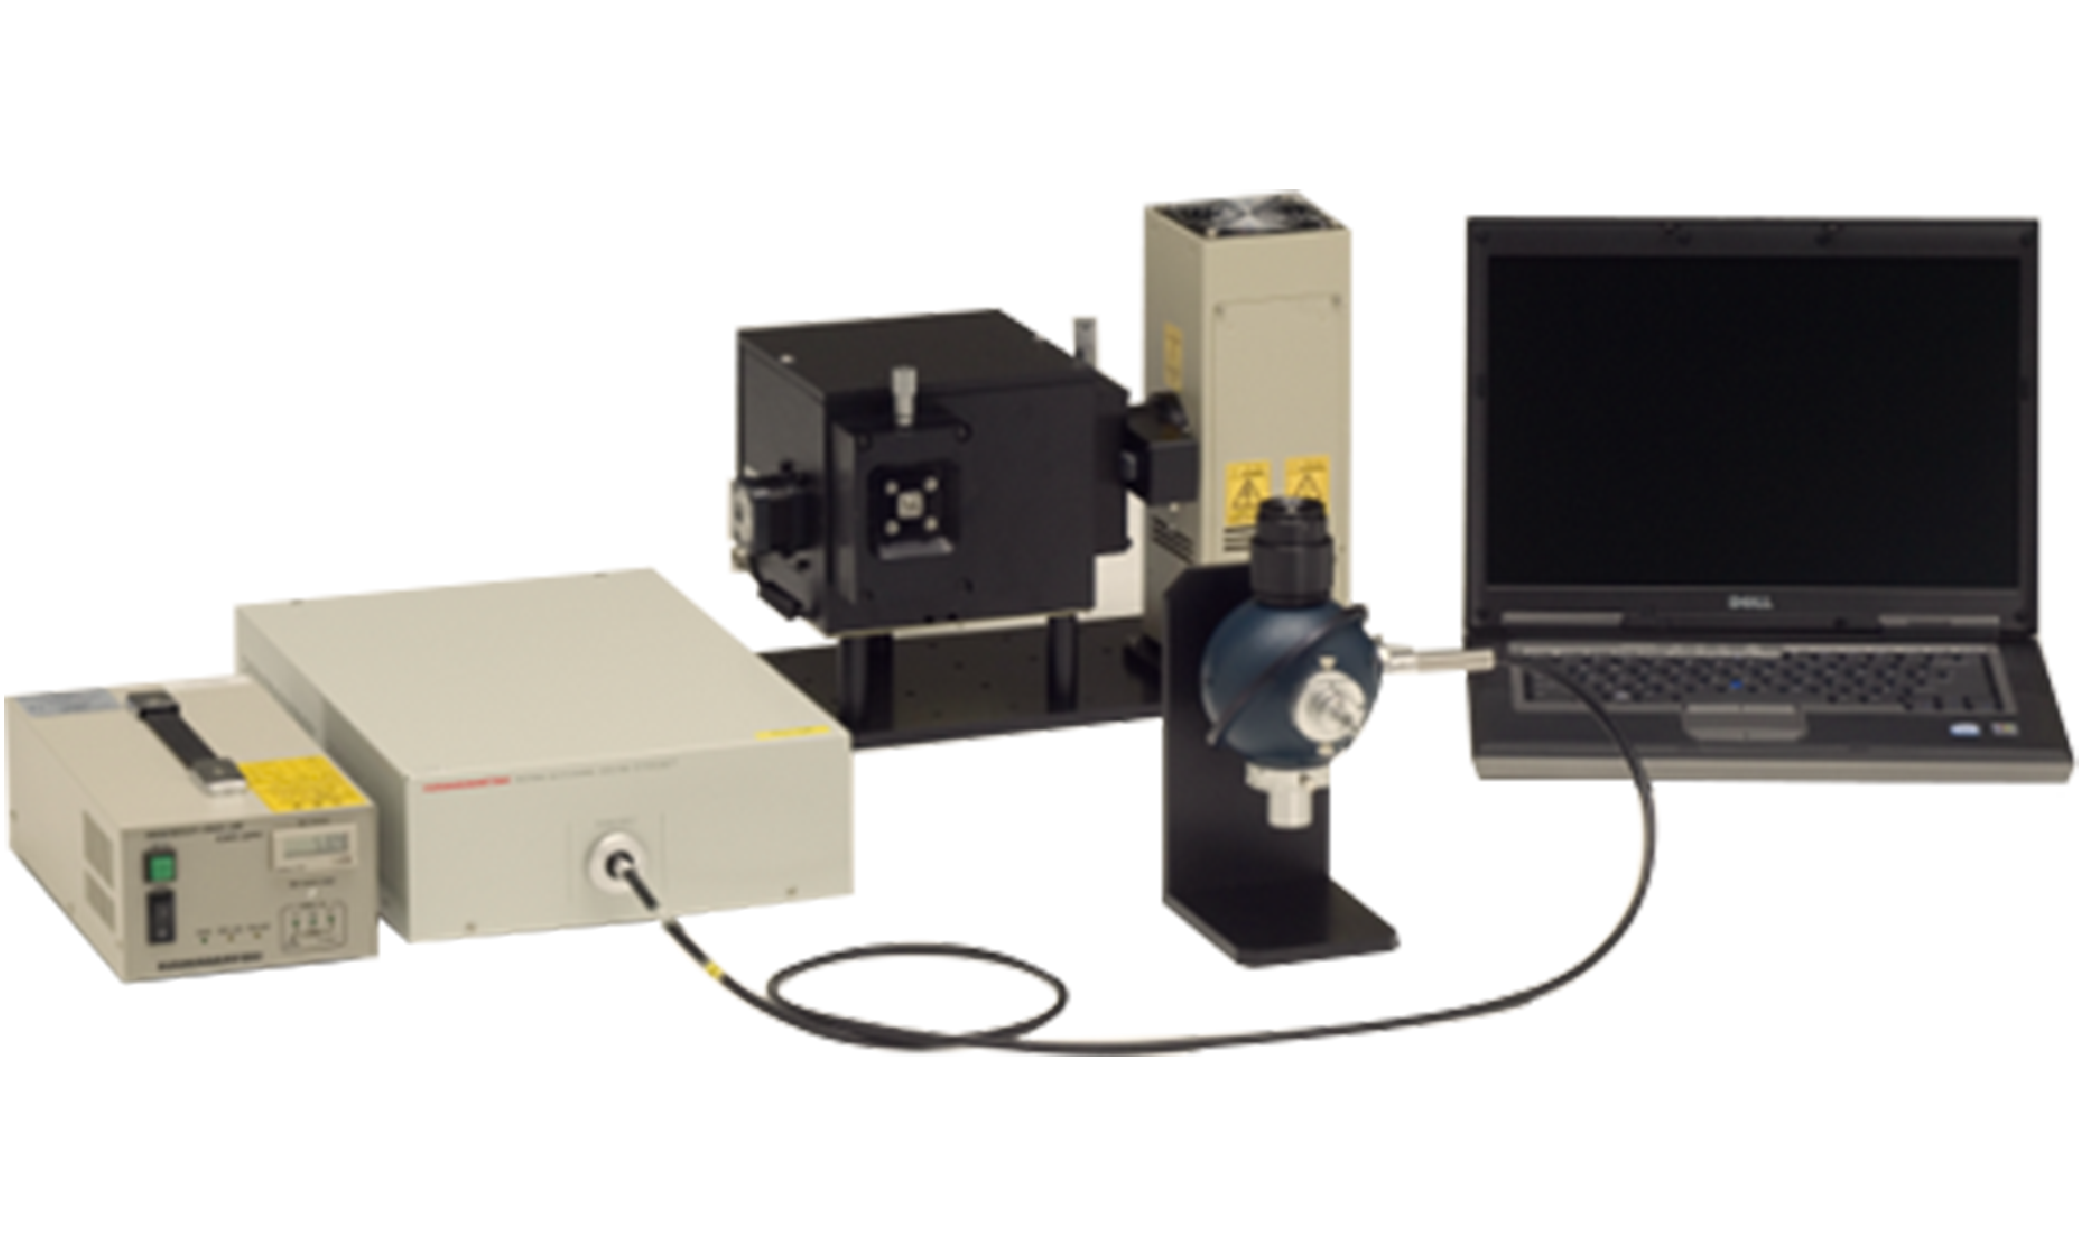
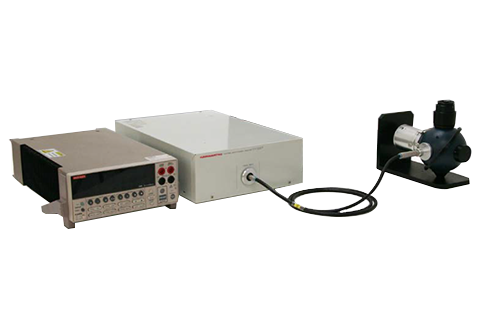
光焱科技股份有限公司为您提供《Nature:突破障碍 - 何祝兵团队在甲胺掺杂的倒钙钛矿太阳能电池中达成25.86%的效率》,该方案主要用于太阳能中量子效率量测检测,参考标准--,《Nature:突破障碍 - 何祝兵团队在甲胺掺杂的倒钙钛矿太阳能电池中达成25.86%的效率》用到的仪器有光焱科技QE-R量子效率系统
推荐专场
相关方案
更多
该厂商其他方案
更多