


Analysis of the hydrogen and oxygen stable isotope ratios of beverage waters without prior water extraction using isotope ratio infrared spectroscopy
Hydrogen (d2H) and oxygen (d18O) stable isotope analysis is useful when tracing the origin of water in beverages, but traditional analytical techniques are limited to pure or extracted waters. We measured the isotopic composition of extracted beverage water using both isotope ratio infrared spectroscopy
(IRIS; specifically, wavelength-scanned cavity ring-down spectroscopy) and isotope ratio mass spectrometry (IRMS). We also analyzed beer, sodas, juices, and milk ‘as is’ using IRIS. For IRIS analysis, four sequential injections of each sample were measured and data were corrected for sample-to-sample memory using injections (a) 1-4, (b) 2-4, and (c) 3-4. The variation between d2H and d18O values calculated using the three correction methods was larger for unextracted (i.e., complex) beverages than for waters. The memory correction was smallest when using injections 3-4. Beverage water d2H and d18O values generally fit the Global Meteoric Water Line, with the exception of water from fruit juices. The beverage water stable isotope ratios measured using IRIS agreed well with the IRMS data and fit 1:1 lines, with the exception of sodas and juices (d2H values) and beers (d18O values). The d2H and d18O values of waters extracted from beer, soda, juice, and milk were correlated with complex beverage d2H and d18O values (r¼0.998 and 0.997, respectively) and generally fit 1:1 lines. We conclude that it is possible to analyze complex beverages, without water extraction, using IRIS although caution is needed when analyzing beverages containing sugars, which can clog the syringe and increase memory, or alcohol, a known spectral interference.
方案详情

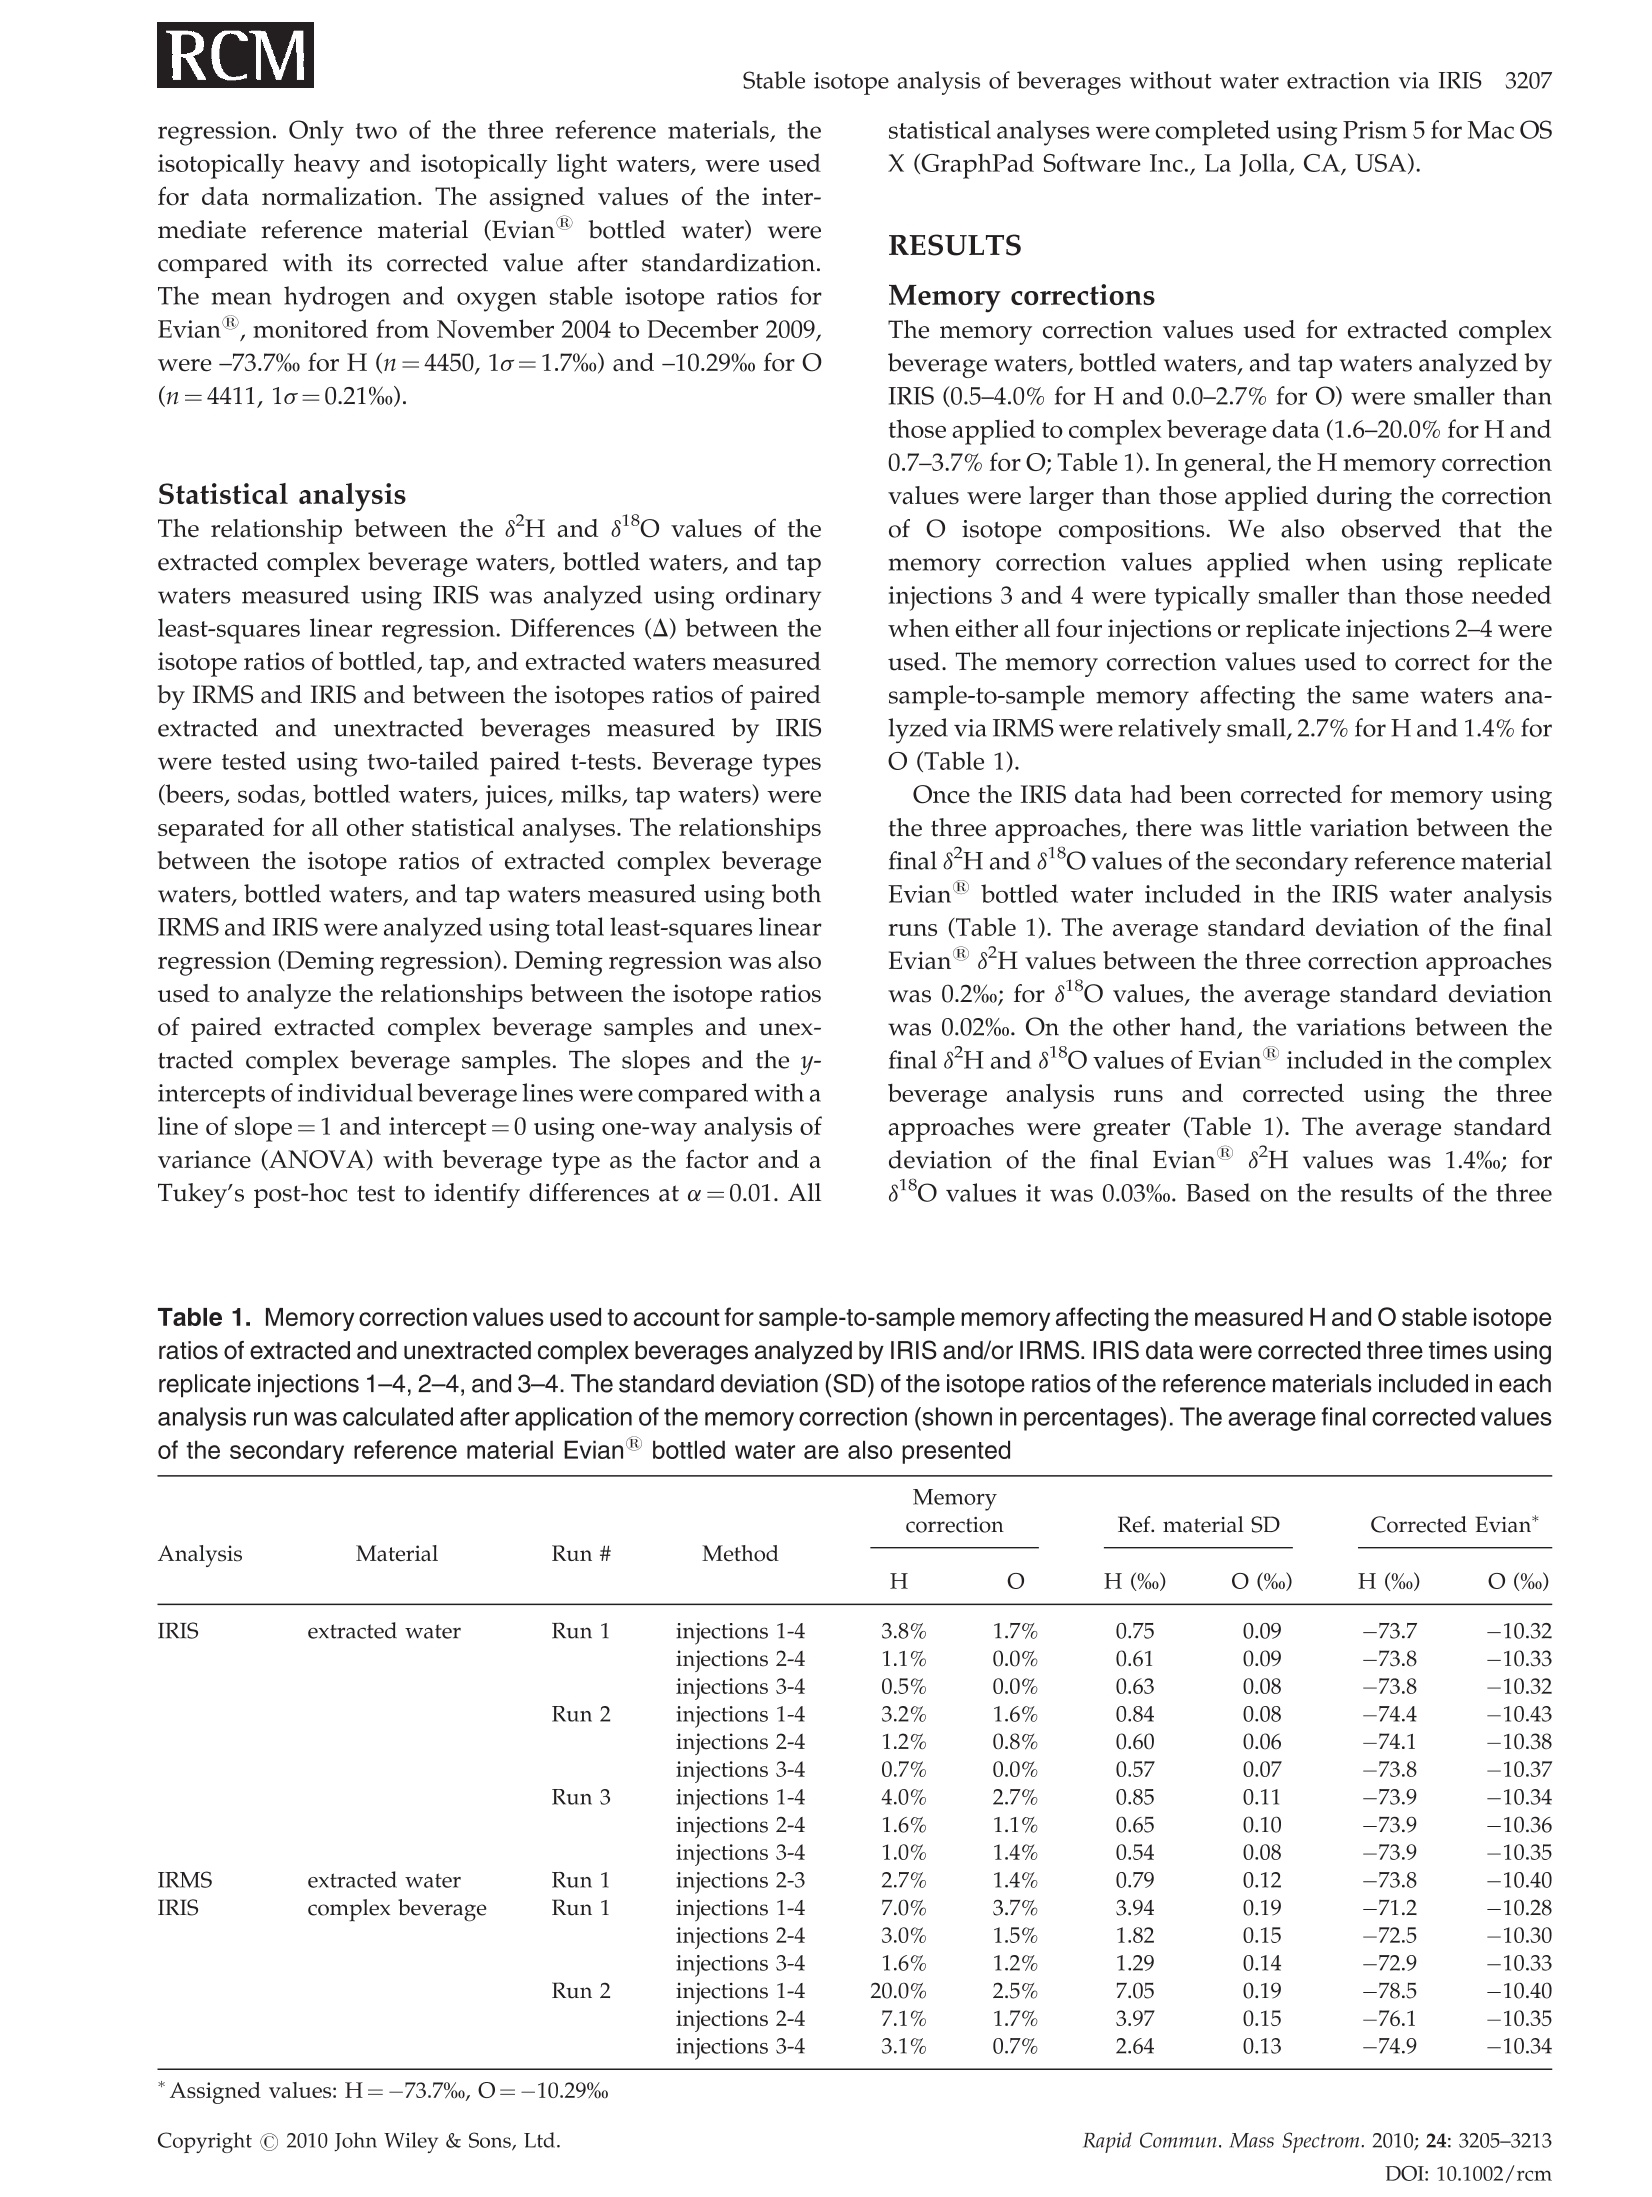
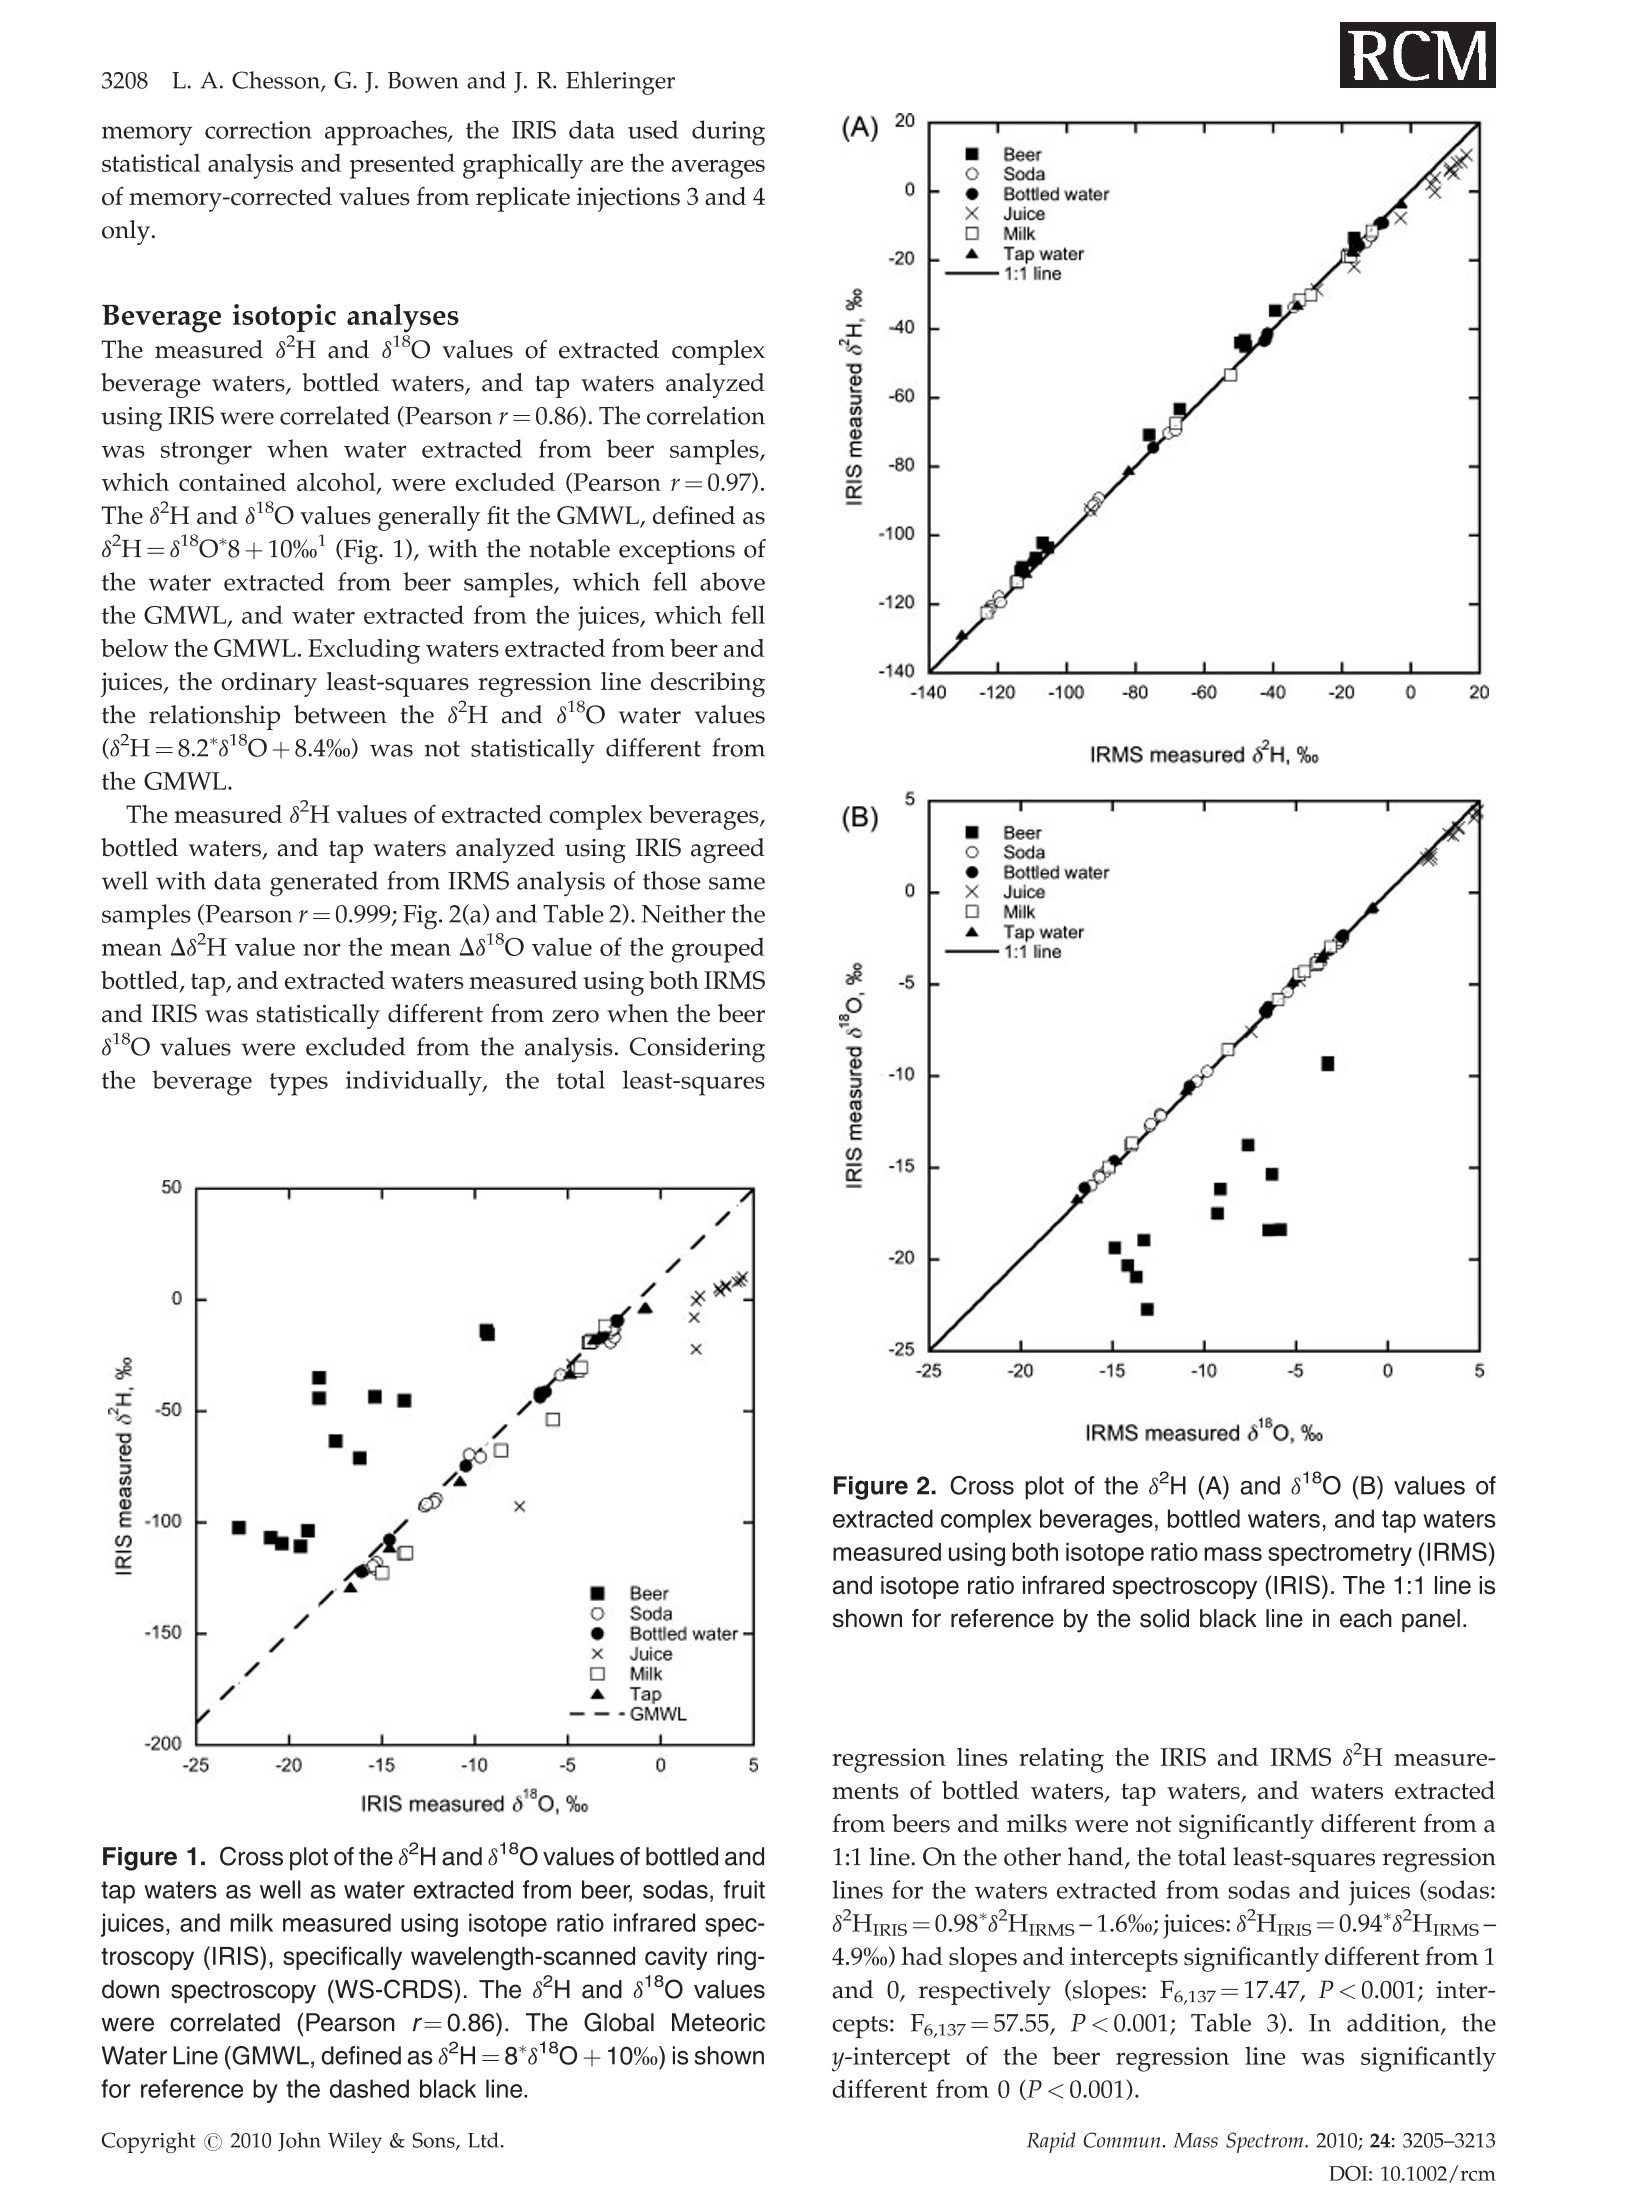
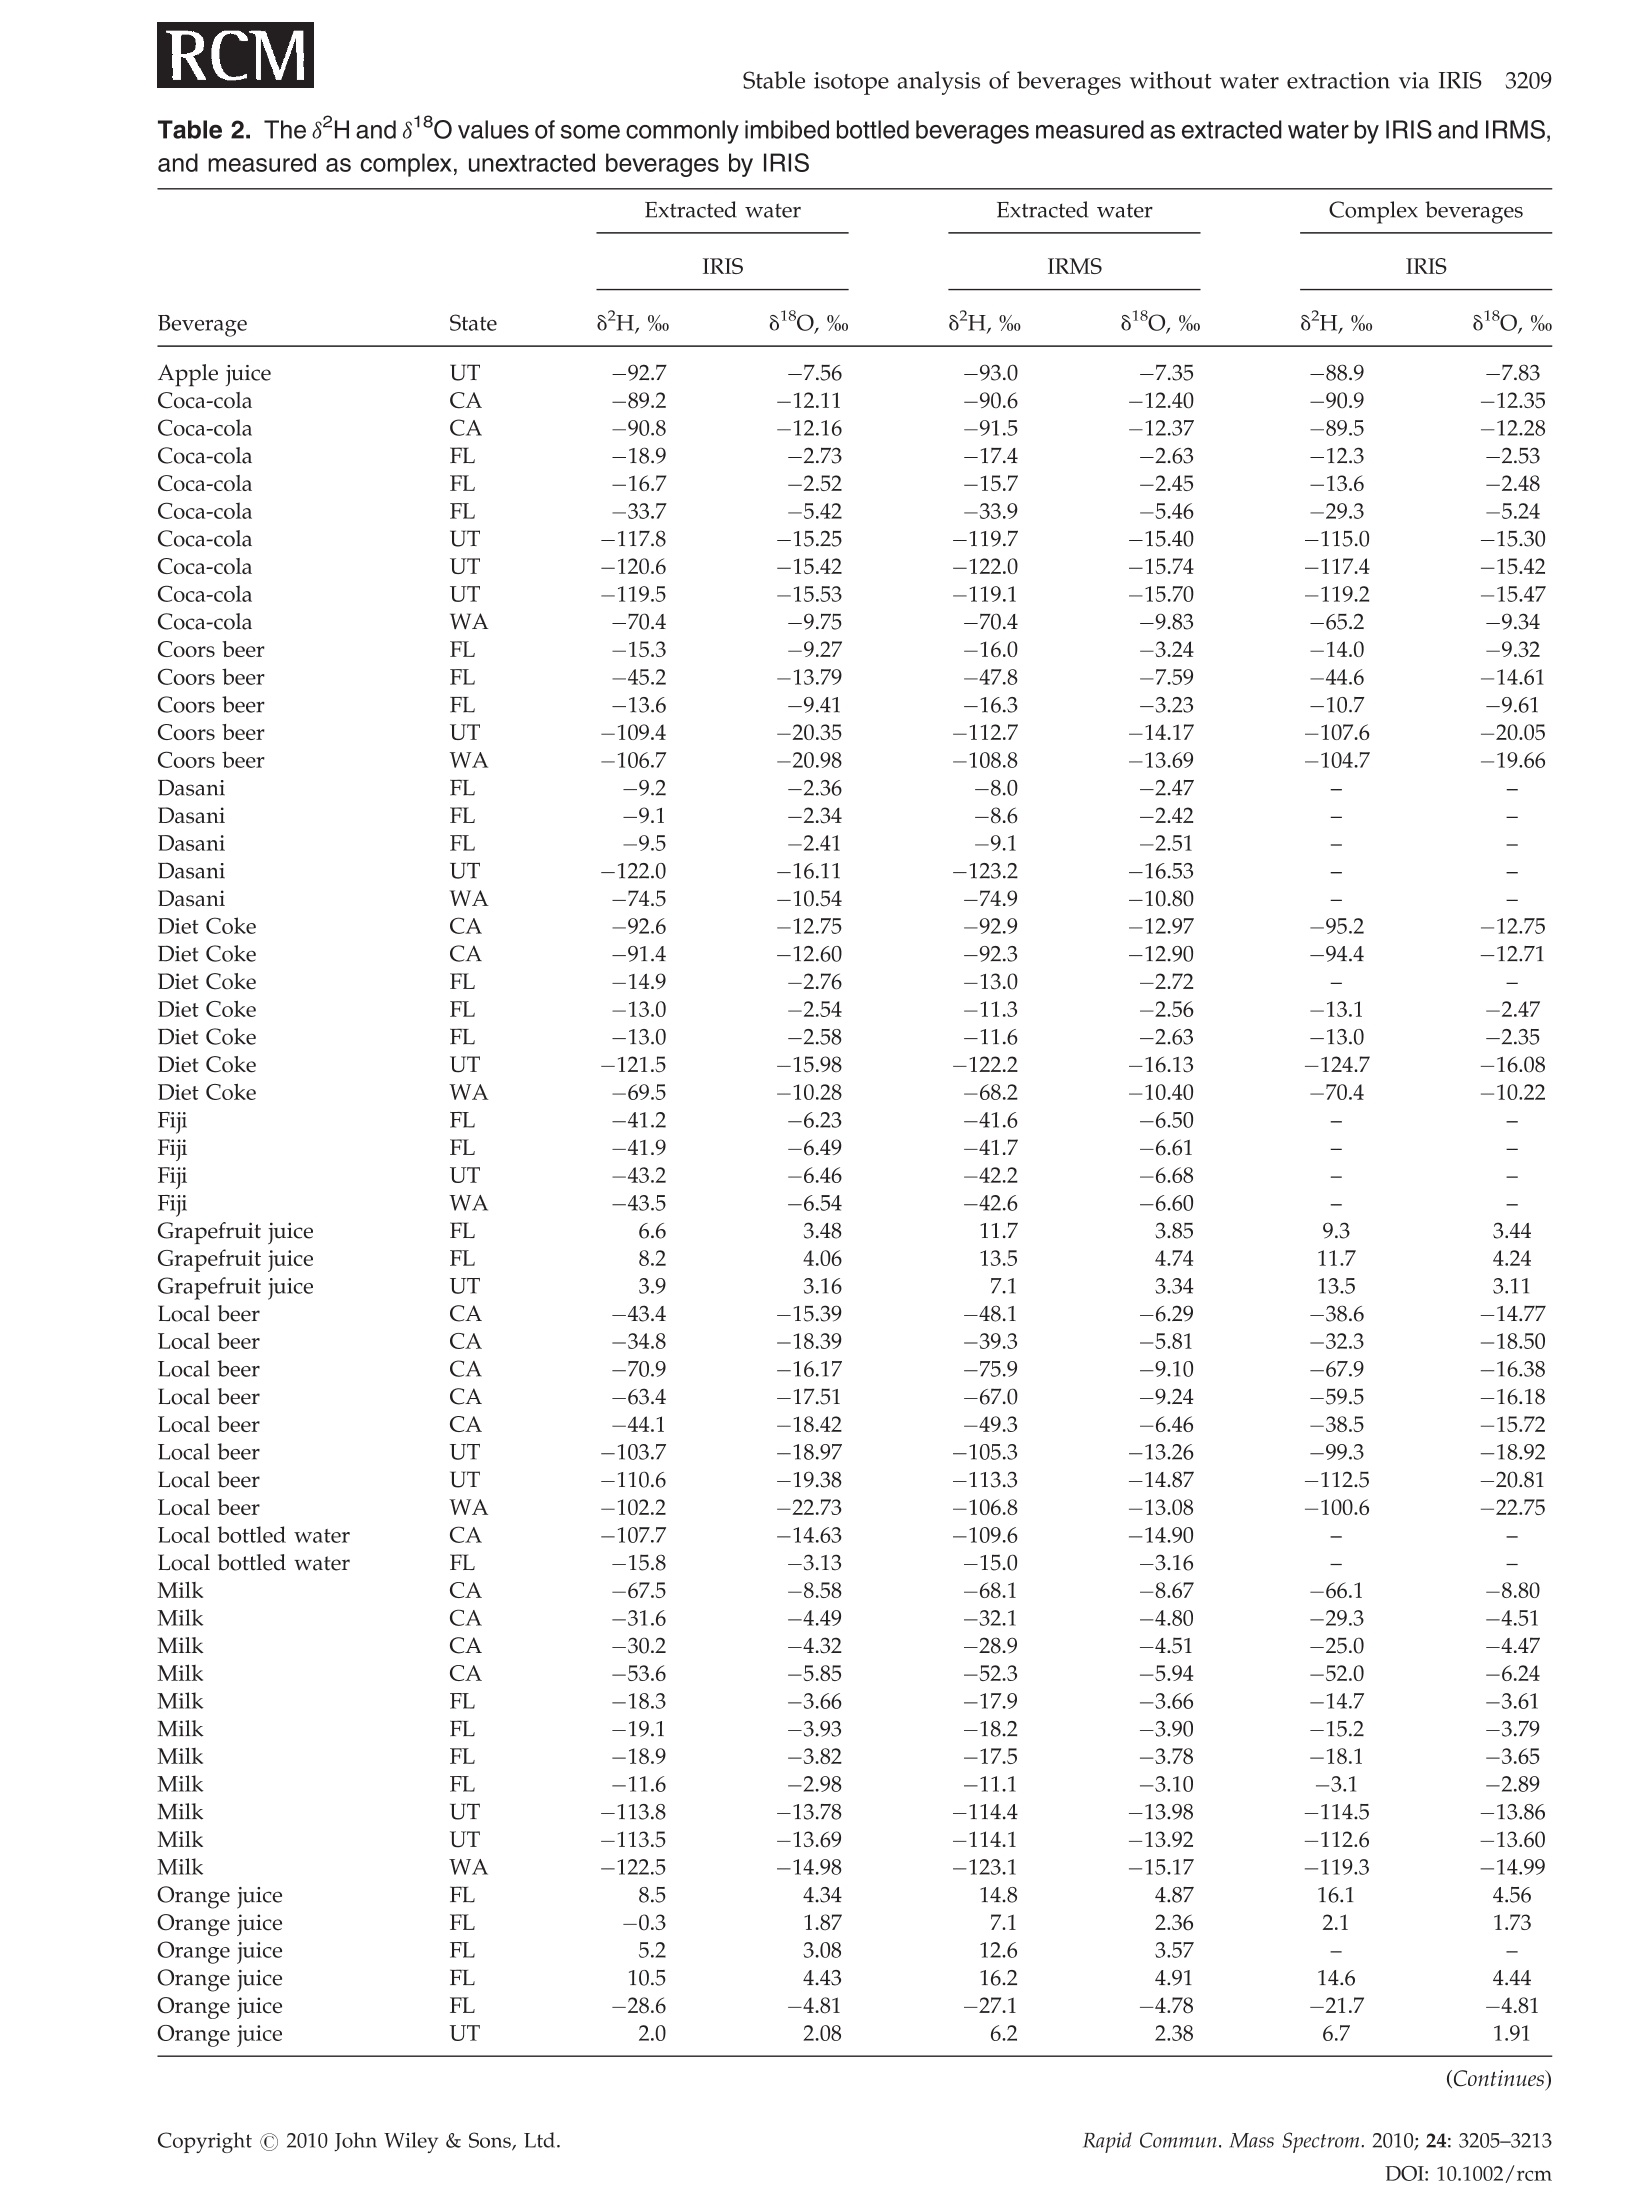
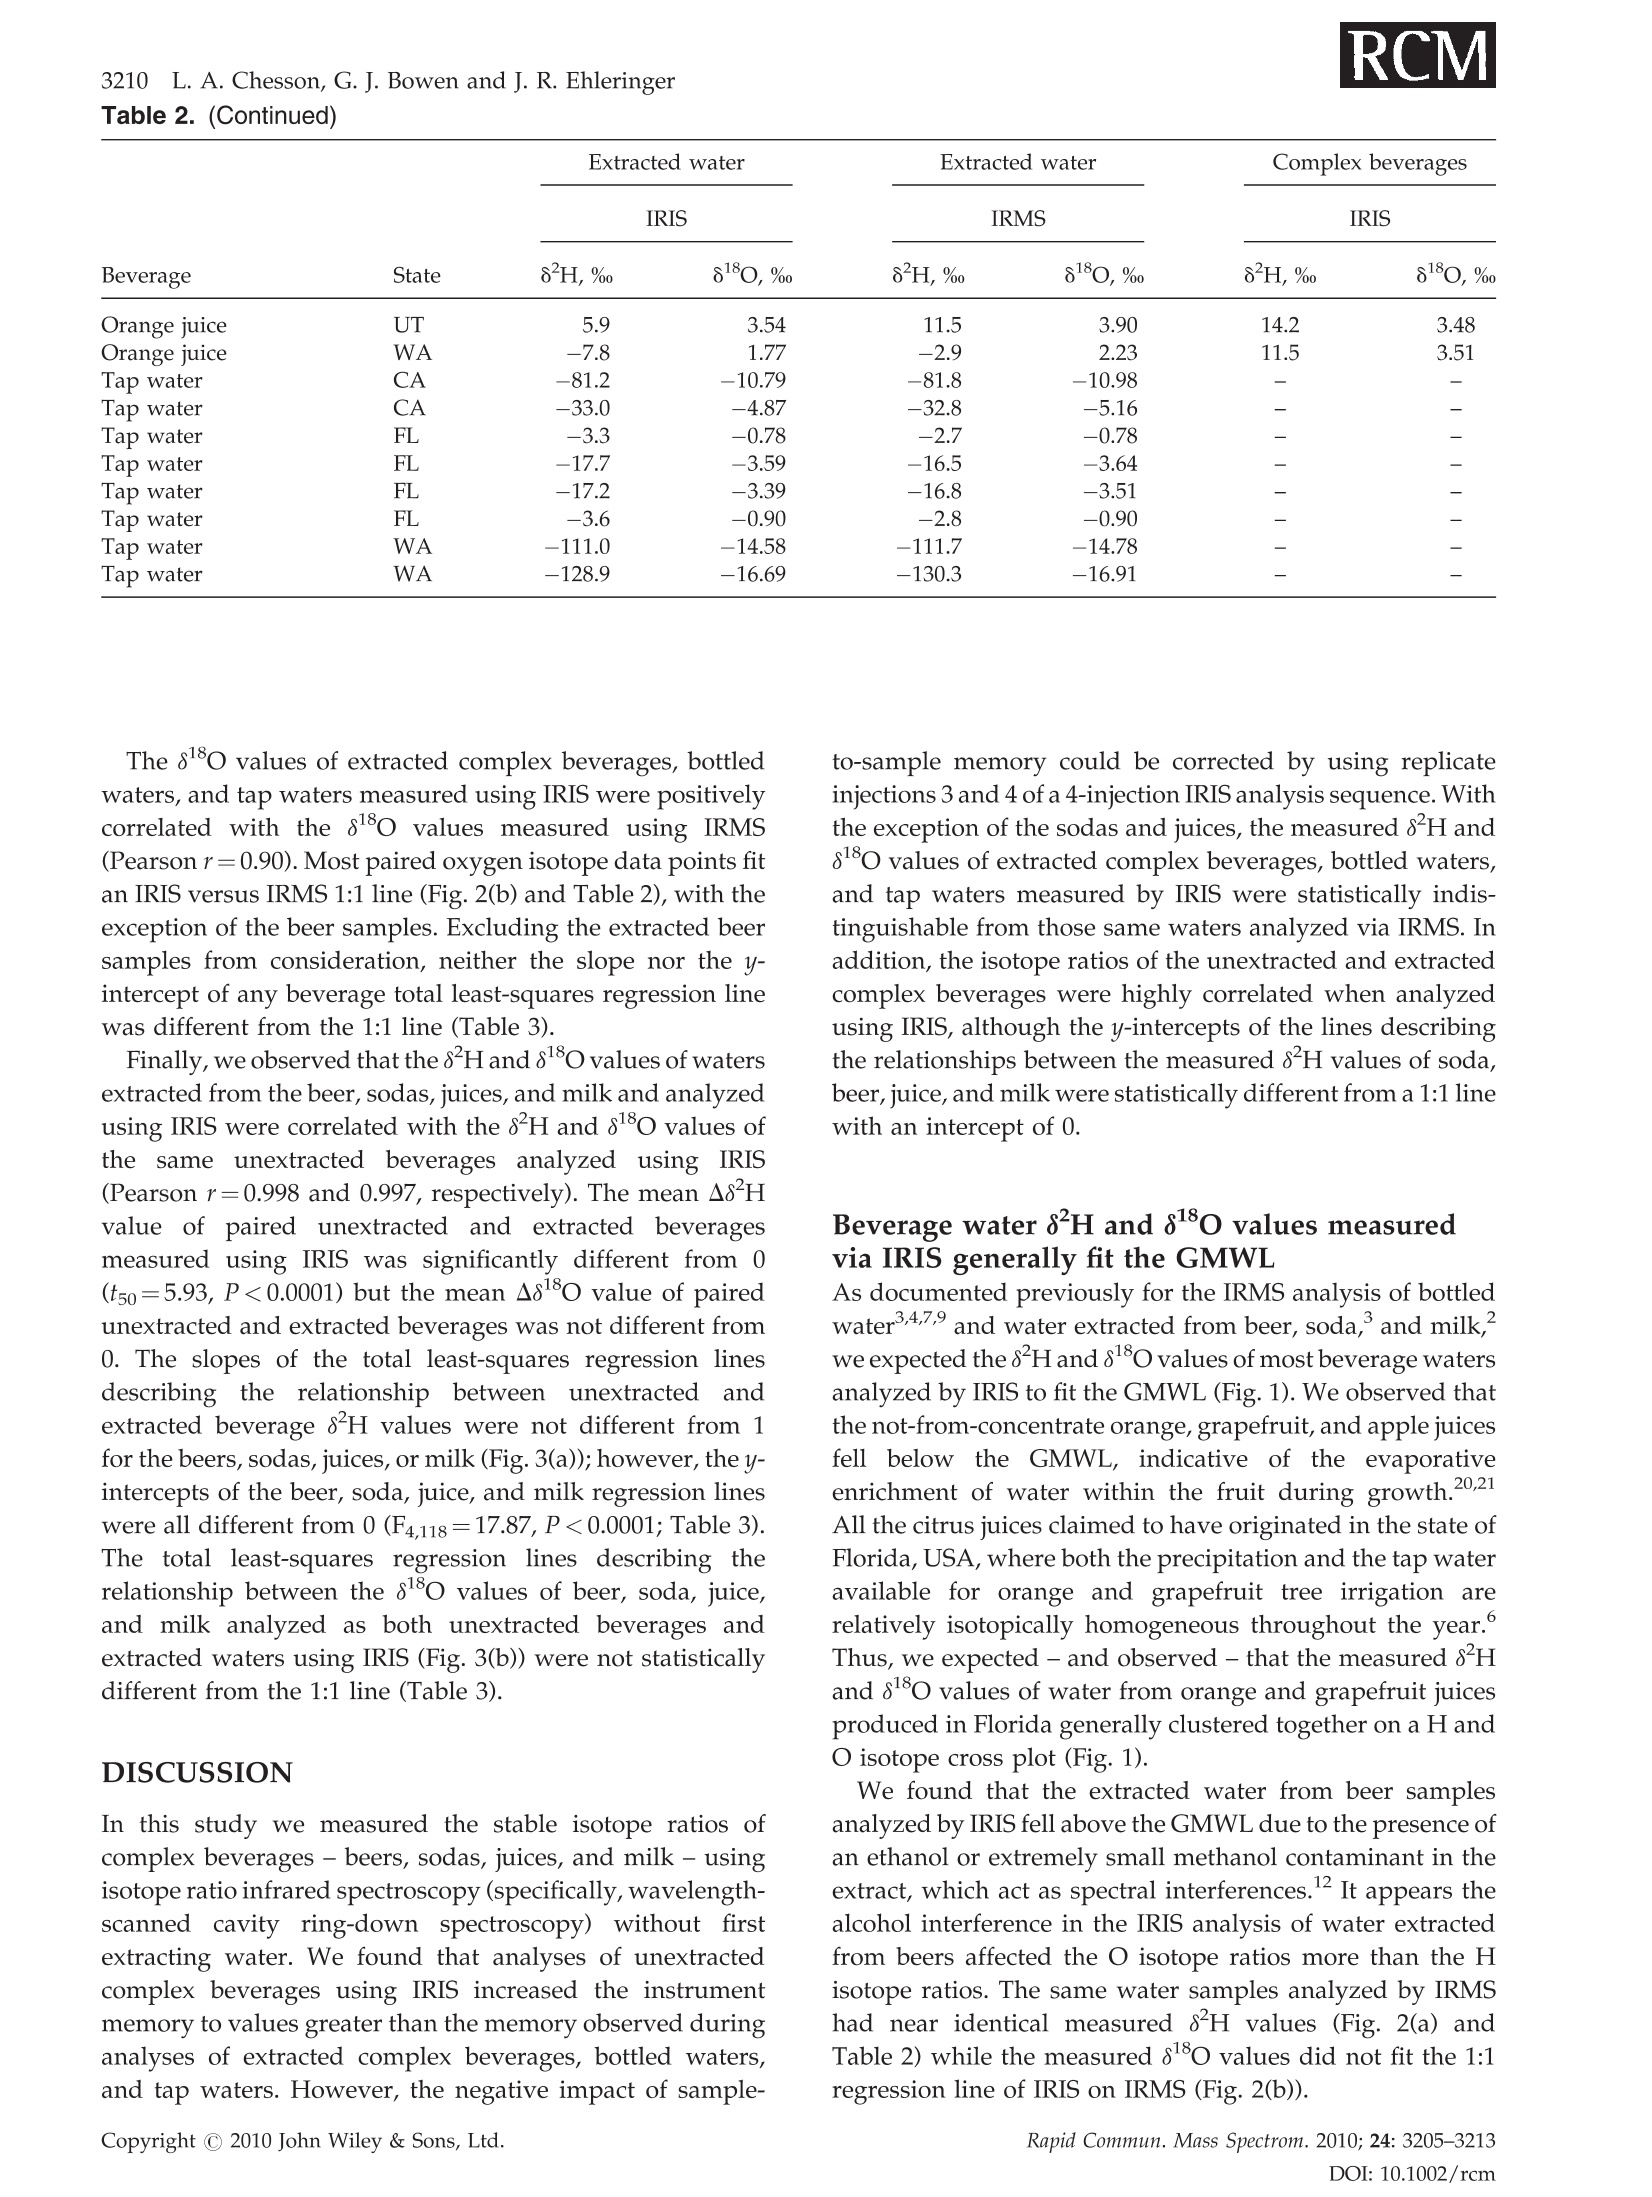
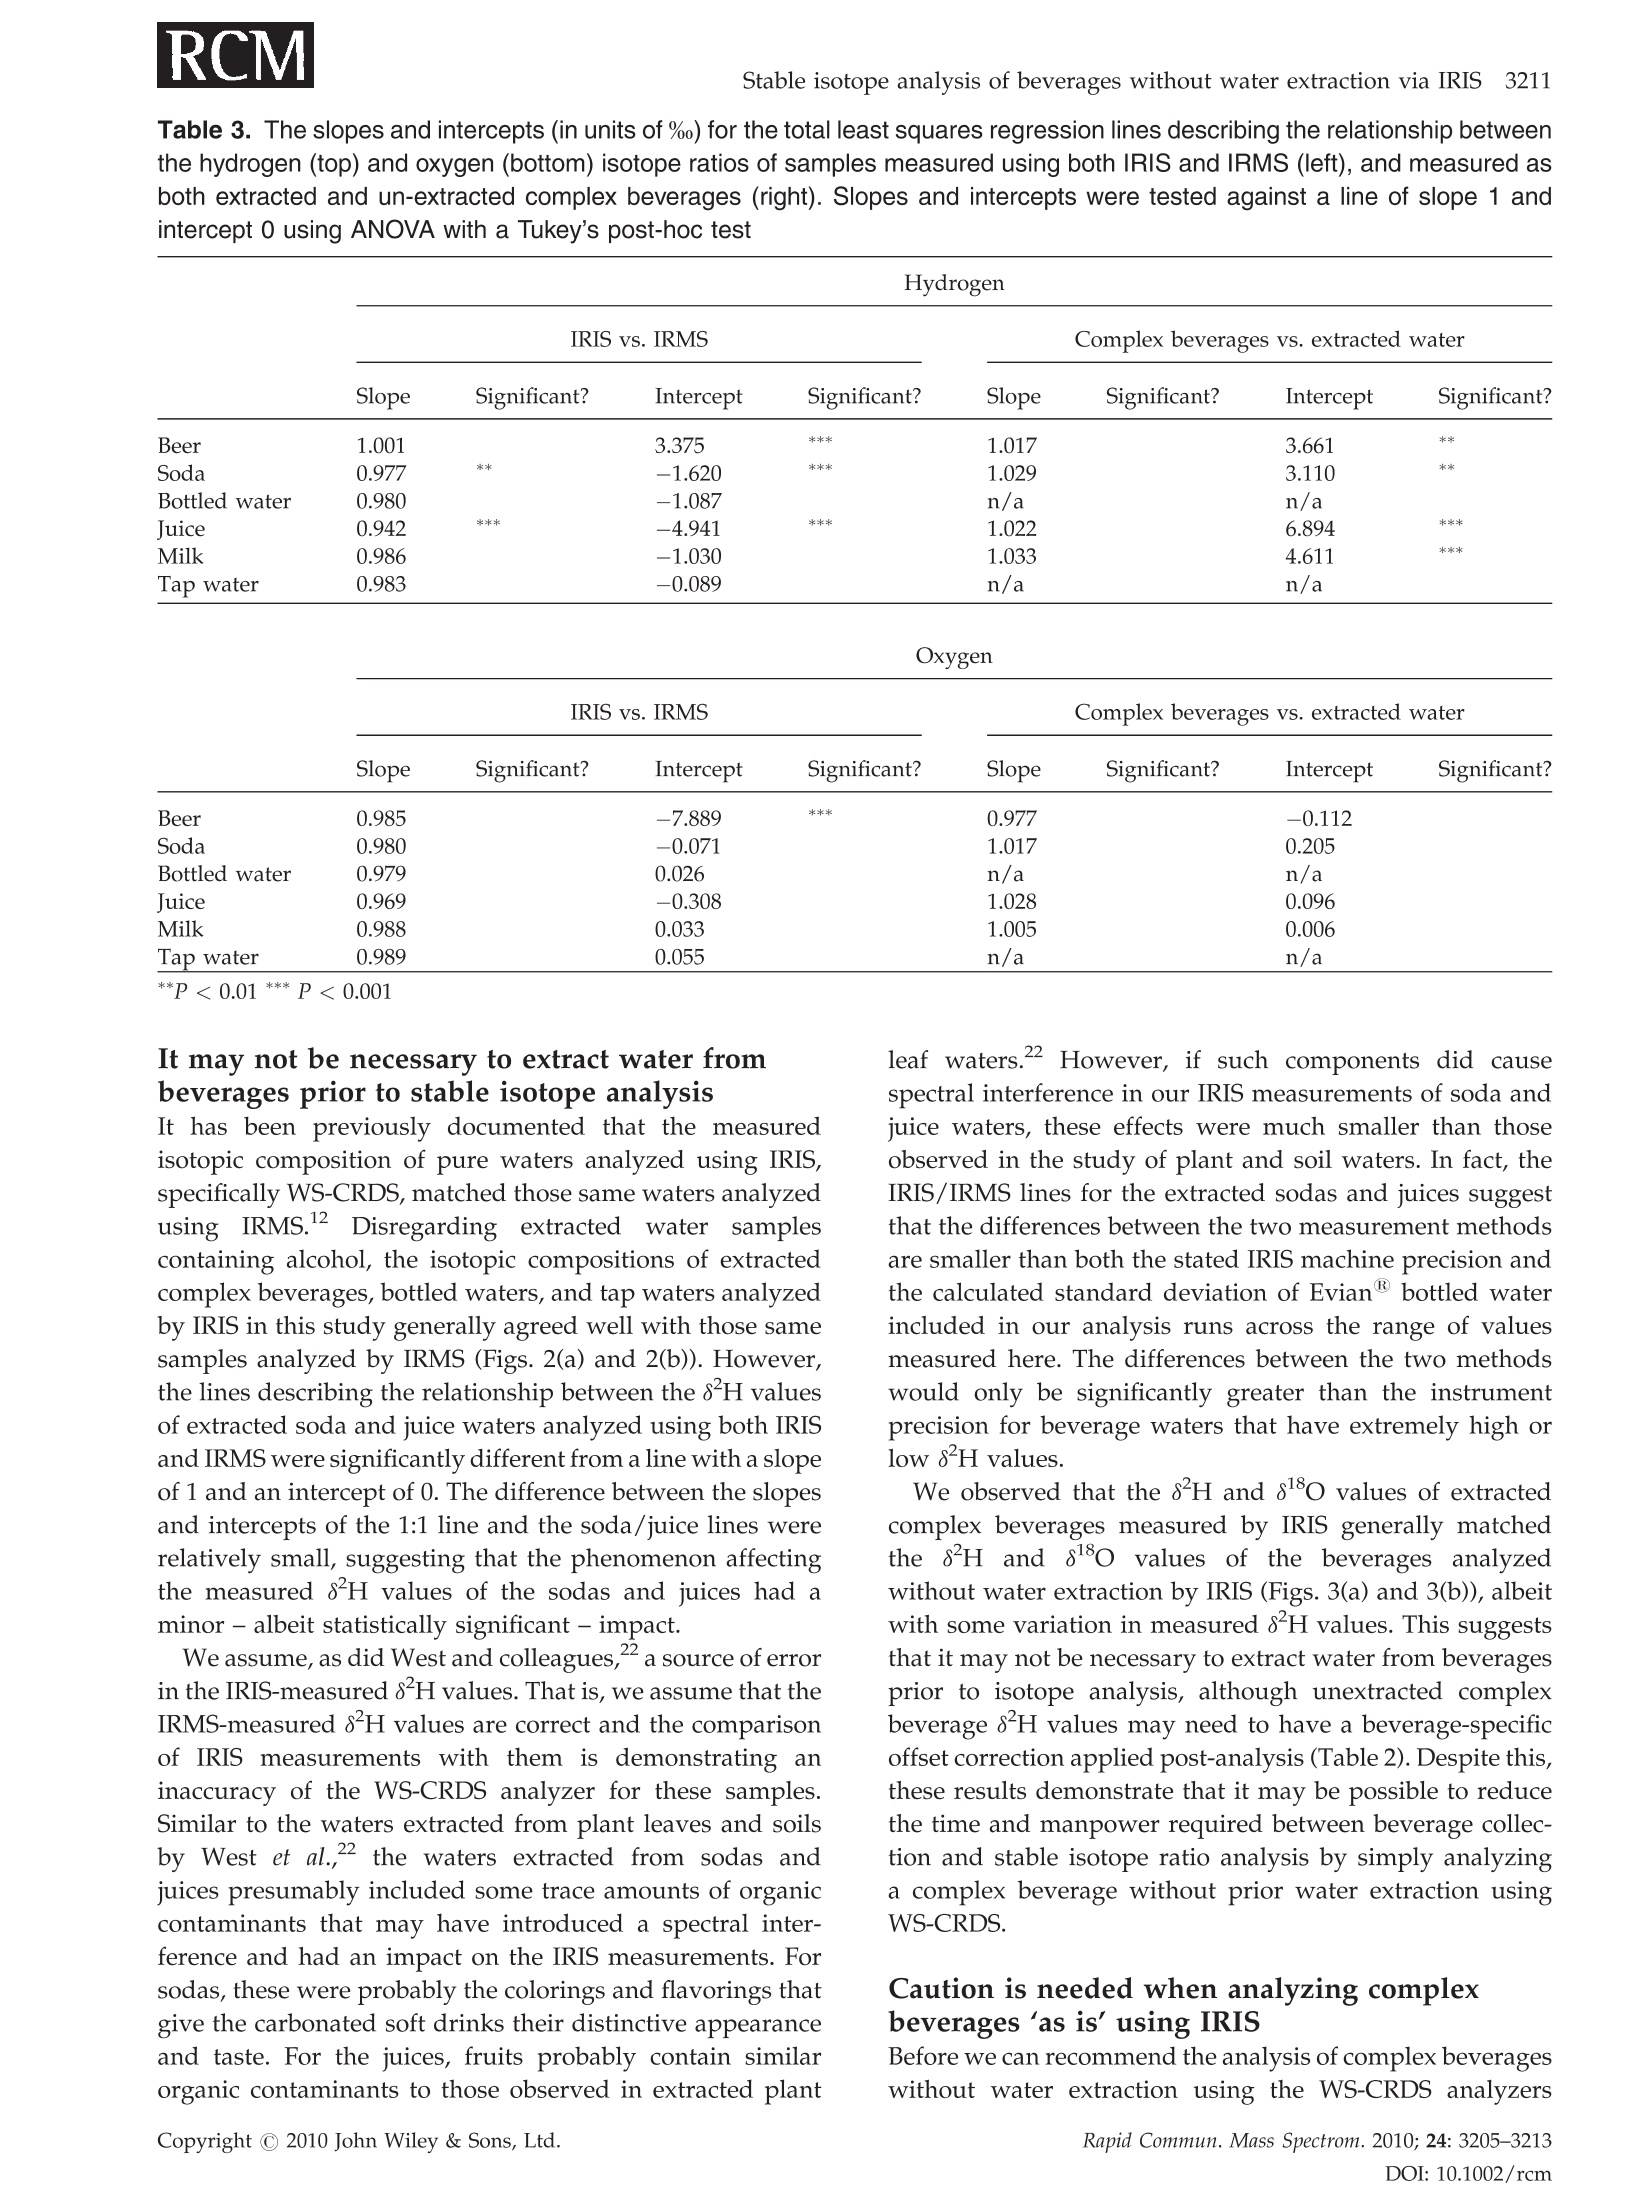
RAPID COMMUNICATIONS IN MASS SPECTROMETRYRapid Commun. Mass Spectrom. 2010;24:3205-3213Published online in Wiley Online Library (wileyonlinelibrary.com) DOI: 10.1002/rcm.4759 3206L. A. Chesson, G. J. Bowen and J. R. Ehleringer Analysis of the hydrogen and oxygen stable isotoperatios of beverage waters without prior water extractionusing isotope ratio infrared spectroscopy Lesley A. Chesson1,2*, Gabriel J. Bowen’ and James R. Ehleringer1:2 'IsoForensics Inc., 423 Wakara Way, Suite 205, Salt Lake City, UT 84108, USA Department of Biology, University of Utah, 257 S 1400 E, Salt Lake City, UT 84112, USA Earth and Atmospheric Sciences, Purdue University, 550 Stadium Mall Drive, West Lafayette, IN 47907, USA Received 12 July 2010; Revised 6 August 2010; Accepted 23 August 2010 Hydrogen (8H) and oxygen (880) stable isotope analysis is useful when tracing the origin of water inbeverages, but traditional analytical techniques are limited to pure or extracted waters. We measuredthe isotopic composition of extracted beverage water using both isotope ratio infrared spectroscopy(IRIS; specifically, wavelength-scanned cavity ring-down spectroscopy) and isotope ratio massspectrometry (IRMS). We also analyzed beer, sodas, juices, and milk 'as is’ using IRIS. For IRISanalysis, four sequential injections of each sample were measured and data were corrected forsample-to-sample memory using injections (a) 1-4, (b) 2-4, and (c) 3-4. The variation between 8H and88o values calculated using the three correction methods was larger for unextracted (i.e., complex)beverages than for waters. The memory correction was smallest when using injections 3-4. Beveragewater 8H and 8180 values generally fit the Global Meteoric Water Line, with the exception of waterfrom fruit juices. The beverage water stable isotope ratios measured using IRIS agreed well with theIRMS data and fit 1:1 lines, with the exception of sodas and juices (8H values) and beers (8Ovalues). The 8H and 88O values of waters extracted from beer, soda, juice, and milk were correlatedwith complex beverage 8H and 80 values (r=0.998 and 0.997, respectively) and generally fit 1:1lines. We conclude that it is possible to analyze complex beverages, without water extraction, usingIRIS although caution is needed when analyzing beverages containing sugars, which can clog thesyringe and increase memory, or alcohol, a known spectral interference. Copyright C 2010 JohnWiley & Sons, Ltd. Recent studies have documented that the hydrogen andoxygen stable isotope ratios of some widely available bottledbeverages co-vary and that the relationships between the 8Hand 810values closely resemble the Global Meteoric WaterLine (GMWL, defined as 8H=8*880+10%), suggestingthat the water within a beverage (i.e., beverage water)records the isotopic composition of the water used toproduce the beverage.2-4 Because the stable isotope ratios ofmeteoric waters vary predictably spatially,5.6 it may bepossible to measure the 8Hand 818o values of water within abeverage and infer the beverage's original water source orlocation of production. The rapid analysis of a suspectbeverage such as bottled water, milk, or wine to indepen-dently verify its geographic origin would be a major boon toinvestigations of beverage authenticity./-11 Until very recently the stable isotope ratios of hydrogenand oxygen in water had been exclusively measuredusing stable isotope ratio mass spectrometry (IRMS).Water cannot be directly analyzed using mass spectrometry.Instead, it must first either be converted into H2 and CO gases ( *Correspondence to: L. A. Chesson, IsoForensics Inc., 4 23 Wakara Way, Suite 205, Salt Lake City, UT 84108, USA. ) ( E-mail: lesley@isoforensics.com ) or equilibrated with H2 and CO2 gases so that it can beanalyzed in a gaseous form. To analyze water containedwithin a material of interest (e.g., a beverage) by the classicIRMS analysis method, water must first be collected usingtime-consuming offline extraction methods. The introduction of isotope ratio infrared spectroscopy(IRIS) analyzers, based on wavelength-scanned cavity ring-down spectroscopy (WS-CRDS; Picarro Inc.) or off-axisintegrated cavity output spectroscopy (OA-ICOS; Los GatosResearch), has provided a new technique to rapidly measurethe stable isotope ratios in water.14-17 Because of their smallersize and weight, it is possible to use WS-CRDS and OA-ICOSwater analyzers in a field setting.18,19 The analytical precisionand accuracy of IRIS-based approaches are similar to thatof IRMS.12,17,8 However, similar to IRMS, the conventionalapplications for IRIS are the analyses of pure waters orwaters extracted from samples of interest. In this study we investigated the possibility of analyzingbeverage water hydrogen and oxygen isotopic compositionswithout prior water extraction using IRIS. The beveragesconsidered included several bottled drinks widely availableto and commonly imbibed by the modern consumer: beer,carbonated soft drinks (sodas), citrus juices, and milk. Wefirst compare the analysis of bottled waters, tap waters, and waters extracted from beverages using both the traditionalIRMS analytical technique and a recently introduced IRISanalytical technique, wavelength-scanned cavity ring-downspectroscopy.We then demonstrate the feasibilityy ofmeasuring the stable isotope ratios of beverages'as is’(i.e., unextracted) using IRIS, and finally discuss some of thepotential complications and analytical interferences thatarise from the analysis of complex, unextracted beveragesby IRIS. EXPERIMENTAL Beverage collection and preparation Beverages were collected in four regions of the contiguousUnited States: in Santa Clara and Marin Counties, CA; theOrlando metropolitan area, FL; the Salt Lake City metropo-litan area, UT; and the Spokane metropolitan area, WA.Collected beverages included Coors Lighttbeer, beersproduced by breweries local to the collection regions,Coca-Cola Classic soda, Diet Cokesoda,Dasanibottledwater, Fijibottled water, not-from-concentrate orange andgrapefruit juices, whole milks from commercial dairies in thecollection areas,and tap water. In addition, a single sample oflocal freshly squeezed apple juice was purchased in the SaltLake City metropolitan area. The collected beverages wereimmediately sub-sampled into 2- or 4-oz plastic watertightbottles. The bottles were half filled, then frozen and storedfrozen until processed. In the laboratory, frozen beverages were thawed and a1-mL sub-sample of each beer, soda, juice, and milk sample(hereafter.r,‘complex’beverages)wasstransferred ontoclean glass wool, frozen, and cryogenically extracted.8,13The extracted waters were not filtered, processed, or treatedfurther. The extracted beverage waters as well as the bottledand tap water samples were transferred (0.5 mL) into 1.8-mLcrimp-top vials, sealed, and stored in a cool, dark locationprior to analysis. Sub-samples (0.5mL) of the complexbeverages were also transferred into crimp-top vials foranalysis 'as is’, with no additional filtration, treatment, orprocessing. Stable isotope analysis The stable isotope abundances are reported in 8-notation inparts per thousands (%o), where and RA and Rs are the molar ratios of the rare to abundantisotope(e.g.,H/'Hor180/160) in the sample of interest andan international standard, respectively. The internationalstandard for both hydrogen and oxygen stable isotopeanalysis is Vienna Standard Mean Ocean Water (VSMOW). The stable isotope abundances of water samples werefirst analyzed at IsoForensics Inc. by IRIS (WS-CRDS) on amodel L1102-i waterr analyzer (Picarro, Sunnyvale, CA,USA).18 Water samples were introduced into the vaporiza-tion chamber using an attached PAL autosampler (LeapTechnologies, Carrboro, NC, USA). Each sample wasanalyzed four times (four consecutive replicate injections)alongside a set of three laboratory reference materials, whichhad previously been calibrated to the VSMOW scale. After IRIS analysis, the crimp-top caps on sample vials werereplaced and samples were analyzed a second time byIRMS at the Stable Isotope Ratio Facility for EnvironmentalResearch (SIRFER) on the University of Utah campus (SaltLake City,UT, USA). The stable isotope compositions weremeasured on a ThermoFinnigan Delta+ XL isotope ratiomass spectrometer (Bremen, Germany) with a high-tempera-ture conversion elementall analyzer (TC/EA; CostechAnalytical, Valencia, CA, USA) attached. During IRMSanalysis samples were injected in triplicate (three consecu-tive replicate injections) into the TC/EA using a PALautosampler. The samples were analyzed alongside the samelaboratory water reference materials as were used duringIRIS analysis. The measurement precision for H and O, asdefined for the analytical instrumentation used, was 0.5%oand 0.1% for IRIS and 1.2%o and 0.1%o for IRMS. Once all water analyses were complete, unextractedcomplex beverage sub-samples were analyzed by IRIS.The unextracted complex beverageswere deliberatelyanalyzed after the extracted, bottled, and tap water samplesas we expected that the water analyzer's vaporizationchamber would be dirty with particulates, mainly sugarsand lipids, from the injected complex beverages. Thesedeposits, which were visible to the naked eye as a caramel-colored coating in the chamber inlet, could increaseinstrument memory as molecules of water from one sampleinjection adhered to the deposits and had an impact on themeasured isotopic composition of the following sample.Unextracted complex beverage samples were sorted ran-domly both between and within beverage types; that is, wedid not analyze all the beer samples before analyzing all thesoda samples. The unextracted complex beverages were notanalyzed by IRMS. Memory effect calculations and data correction Theisotopic compositionssofsamplesandreferencematerials measured using IRIS and IRMS were correctedfor sample-to-sample memory prior to normalization ofthe sample data to the reference materials. For memorycorrections, the measured isotope value of the previoussample injection (S1) was used to correct for its impact on themeasured isotope value of the current injection (S2).Corrected isotope values were calculated using the equation: where Xiiistheememory correctionnvalue (fractionalcontribution) of S1 to the measured isotope value of S2.Data were corrected using a template built in MicrosoftExcel 2004 for Mac. Fractional memory correction valueswere manually entered into the data template until thecombined average standard deviation of the three referencematerials was minimized. The isotope data generated by IRIS were corrected formemory using three approaches: using all four replicatesample injections, using replicate injections 2-4, and usingreplicate injections 3 and 4 only. The isotope data generatedby IRMS were corrected for sample-to-sample memory once,using replicate sample injections 2 and 3. After memorycorrection, the sample data were normalized to the waterreference materials included in the analysis run using linear regression. Only two of the three reference materials, theisotopically heavy and isotopically light waters, were usedfor data normalization. The assigned values of the inter-mediate reference material (Evian bottled water) werecompared with its corrected value after standardization.The mean hydrogen and oxygen stable isotope ratios forEvian, monitored from November 2004 to December 2009were -73.7%o for H (n=4450,1o=1.7%o) and -10.29%o for O(n=4411,1o=0.21%0). Statistical analysis The relationship between the 8H and 88o values of theextracted complex beverage waters, bottled waters, and tapwaters measured using IRIS was analyzed using ordinaryleast-squares linear regression. Differences (A) between theisotope ratios of bottled, tap, and extracted waters measuredby IRMS and IRIS and between the isotopes ratios of pairedextracted and unextracted beverages measured by IRISwere tested using two-tailed paired t-tests. Beverage types(beers, sodas, bottled waters, juices, milks, tap waters) wereseparated for all other statistical analyses. The relationshipsbetween the isotope ratios of extracted complex beveragewaters, bottled waters, and tap waters measured using bothIRMS and IRIS were analyzed using total least-squares linearregression (Deming regression). Deming regression was alsoused to analyze the relationships between the isotope ratiosof paired extracted complex beverage samples and unex-tracted complex beverage samples. The slopes and the y-intercepts of individual beverage lines were compared with aline of slope=1 and intercept=0 using one-way analysis ofvariance (ANOVA) with beverage type as the factor and aTukey's post-hoc test to identify differences at a=0.01. All statistical analyses were completed using Prism 5 for Mac OSX (GraphPad Software Inc., La Jolla, CA, USA). RESULTS Memory corrections The memory correction values used for extracted complexbeverage waters, bottled waters, and tap waters analyzed byIRIS (0.5-4.0% for H and 0.0-2.7%for O) were smaller thanthose applied to complex beverage data (1.6-20.0% for H and0.7-3.7% for O;Table 1). In general, the H memory correctionvalues were larger than those applied during the correctionof O isotope compositions. We also observed that thememory correction values applied when using replicateinjections 3 and 4 were typically smaller than those neededwhen either all four injections or replicate injections 2-4 wereused. The memory correction values used to correct for thesample-to-sample memory affecting the same waters ana-lyzed via IRMS were relatively small, 2.7% for Hand 1.4% forO (Table 1). Once the IRIS data had been corrected for memory usingthe three approaches, there was little variation between thefinal 8Hand 8ovalues of the secondary reference materialEvian bottled water included in the IRIS water analysisruns (Table 1). The average standard deviation of the finalEvian"8H values between the three correction approacheswas 0.2%; for 81o values, the average standard deviationwas 0.02%o.On the other hand, the variations between thefinal8H and 818O values of Evianincluded in the complexbeverage analysis runs and corrected using the threeapproaches were greater (Table 1). The average standarddeviation of the final Evian8H values was 1.4%; for18o values it was 0.03%. Based on the results of the three Table 1. Memory correction values used to account for sample-to-sample memory affecting the measured H and O stable isotoperatios of extracted and unextracted complex beverages analyzed by IRlS and/or IRMS. IRIS data were corrected three times usingreplicate injections 1-4, 2-4, and 3-4. The standard deviation (SD) of the isotope ratios of the reference materials included in eachanalysis run was calculated after application of the memory correction (shown in percentages). The average final corrected valuesof the secondary reference material Evian bottled water are also presented Memory Analysis Material Run # Method correction Ref. material SD Corrected Evian* H H (%o) O(%o) H(%o) O(%o) IRIS extracted water Run 1 injections 1-4 3.8% 1.7% 0.75 0.09 -73.7 -10.32 injections 2-4 1.1% 0.0% 0.61 0.09 -73.8 -10.33 injections 3-4 0.5% 0.0% 0.63 0.08 -73.8 -10.32 Run 2 injections 1-4 3.2% 1.6% 0.84 0.08 -74.4 -10.43 injections 2-4 1.2% 0.8% 0.60 0.06 -74.1 -10.38 injections 3-4 0.7% 0.0% 0.57 0.07 -73.8 -10.37 Run 3 injections 1-4 4.0% 2.7% 0.85 0.11 -73.9 -10.34 injections 2-4 1.6% 1.1% 0.65 0.10 -73.9 -10.36 injections 3-4 1.0% 1.4% 0.54 0.08 -73.9 -10.35 IRMS extracted water Run 1 injections 2-3 2.7% 1.4% 0.79 0.12 -73.8 -10.40 IRIS complex beverage Run 1 injections 1-4 7.0% 3.7% 3.94 0.19 -71.2 -10.28 injections 2-4 3.0% 1.5% 1.82 0.15 -72.5 -10.30 injections 3-4 1.6% 1.2% 1.29 0.14 -72.9 -10.33 Run 2 injections 1-4 20.0% 2.5% 7.05 0.19 -78.5 -10.40 injections 2-4 7.1% 1.7% 3.97 0.15 -76.1 -10.35 injections 3-4 3.1% 0.7% 2.64 0.13 -74.9 -10.34 ( * Assigned values:H= - 73.7%,O=-1 0 .29%o ) memory correction approaches, the IRIS data used duringstatistical analysis and presented graphically are the averagesof memory-corrected values from replicate injections 3 and 4only. Beverage isotopic analyses The measured 8H and8o values of extracted complexbeverage waters, bottled waters, and tap waters analyzedusing IRIS were correlated (Pearsonr=0.86). The correlationwas stronger when water extracted from beer samples,which contained alcohol, were excluded (Pearson r=0.97).The 8H and 8o values generally fit the GMWL, defined as8H=880*8+10% (Fig. 1), with the notable exceptions ofthe water extracted from beer samples, which fell abovethe GMWL, and water extracted from the juices, which fellbelow the GMWL. Excluding waters extracted from beer andjuices, the ordinary least-squares regression line describingthe relationship between the 8H and 8o water values(8H=8.2*8180+8.4%) was not statistically different fromthe GMWL. The measured 8H values of extracted complex beverages,bottled waters, and tap waters analyzed using IRIS agreedwell with data generated from IRMS analysis of those samesamples (Pearson r=0.999; Fig. 2(a) and Table 2). Neither themean A8 H value nor the mean 80 value of the groupedbottled, tap, and extracted waters measured using both IRMSand IRIS was statistically different from zero when the beer8180 values were excluded from the analysis. Consideringthe beverage types individually, the total least-squares Figure 1. Cross plot of the 8H and 818o values of bottled andtap waters as well as water extracted from beer, sodas, fruitjuices, and milk measured using isotope ratio infrared spec-troscopy (IRIS), specifically wavelength-scanned cavity ring-down spectroscopy (WS-CRDS). The 8H and 8180 valueswere correlated (Pearson r=0.86). The Global MeteoricWater Line (GMWL, defined as 8H=8*8180+10%) is shownfor reference by the dashed black line. IRMS measured 8H, % IRMS measured 80,%。 Figure 2. Cross plot of the 8H (A) and 810 (B) values ofextracted complex beverages, bottled waters,and tap watersmeasured using both isotope ratio mass spectrometry (IRMS)and isotope ratio infrared spectroscopy (IRIS). The 1:1 line isshown for reference by the solid black line in each panel. regression lines relating the IRIS and IRMS 8H measure-ments of bottled waters, tap waters, and waters extractedfrom beers and milks were not significantly different from a1:1 line. On the other hand, the total least-squares regressionlines for the waters extracted from sodas and juices (sodas:8Hnis=0.98*8HRMs-1.6%o; juices:8HRis=0.94*8HnRMs-4.9%o) had slopes and intercepts significantly different from 1and 0, respectively (slopes: F6,137=17.47, P<0.001; inter-cepts: F6,137=57.55, P<0.001; Table 3). In addition, they-intercept of the beer regression line was significantlydifferent from 0 (P <0.001). Table 2. The 8H and 8180 values of some commonly imbibed bottled beverages measured as extracted water by IRIS and IRMS,and measured as complex, unextracted beverages by IRIS 3210 L. A. Chesson, G. J. Bowen and J. R. EhleringerTable 2. (Continued) Beverage Extracted water Extracted water Complex beverages IRIS IRMS IRIS State 8H,% 8180,% 8H,% 810, 8H,% 8180,% Orange juice UT 5.9 3.54 11.5 3.90 14.2 3.48 Orange juice WA -7.8 1.77 -2.9 2.23 11.5 3.51 Tap water -81.2 -10.79 -81.8 -10.98 Tap water -33.0 -4.87 -32.8 -5.16 Tap water -3.3 -0.78 -2.7 -0.78 Tap water -17.7 -3.59 -16.5 -3.64 Tap water -17.2 -3.39 -16.8 -3.51 Tap water -3.6 -0.90 -2.8 -0.90 Tap water WA -111.0 -14.58 -111.7 -14.78 Tap water WA -128.9 -16.69 -130.3 -16.91 The 8180 values of extracted complex beverages, bottledwaters, and tap waters measured using IRIS were positivelycorrelated with the 8o values measured using IRMS(Pearsonr=0.90). Most paired oxygen isotope data points fitan IRIS versus IRMS 1:1 line (Fig.2(b) and Table 2), with theexception of the beer samples. Excluding the extracted beersamples from consideration, neither the slope nor the y-intercept of any beverage total least-squares regression linewas different from the 1:1 line (Table 3). Finally, we observed that the 8Hand 80values of watersextracted from the beer, sodas, juices, and milk and analyzedusing IRIS were correlated with the 8H and8180 values ofthesameieunextracteddbeveragesanalyzedi using IRIs(Pearson r=0.998 and 0.997, respectively). The mean A8Hvalue ofpaireddunextractedandextractedbeveragesmeasured using IRIS was significantly different from O(tso=5.93, P <0.0001) but the mean A80 value of pairedunextracted and extracted beverages was not different from0. The slopes of the total least-squares regression linesdescribing the relationshipbbetweenunextractedandextracted beverage H values were not different from 1for the beers, sodas, juices, or milk (Fig.3(a)); however, the y-intercepts of the beer, soda, juice, and milk regression lineswere all different from 0 (F4,118=17.87, P <0.0001; Table 3).The total least-squares regression lines describing therelationship between the 8180 values of beer, soda, juice,and milk analyzed as both unextracted beverages andextracted waters using IRIS (Fig.3(b)) were not statisticallydifferent from the 1:1 line (Table 3). DISCUSSION In this study we measured the stable isotope ratios ofcomplex beverages - beers, sodas, juices, and milk- usingisotope ratio infrared spectroscopy (specifically, wavelength-scanned cavity ring-down spectroscopy) without firstextracting water. We found that analyses of unextractedcomplex beverages using IRIS increased the instrumentmemory to values greater than the memory observed duringanalyses of extracted complex beverages, bottled waters,and tap waters. However, the negative impact of sample- to-sample memory could be corrected by using replicateinjections 3 and 4 of a 4-injection IRIS analysis sequence. Withthe exception of the sodas and juices, the measured 8H and8180 values of extracted complex beverages, bottled waters,and tap waters measured by IRIS were statistically indis-tinguishable from those same waters analyzed via IRMS. Inaddition, the isotope ratios of the unextracted and extractedcomplex beverages were highly correlated when analyzedusing IRIS, although the y-intercepts of the lines describingthe relationships between the measured 8H values of soda,beer, juice, and milk were statistically different from a 1:1 linewith an intercept of 0. Beverage water 8H and 8180 values measuredvia IRIS generally fit the GMWL As documented previously for the IRMS analysis of bottledwater34,7,and water extracted from beer, soda, and milk,2we expected the 8Hand 81O values of most beverage watersanalyzed by IRIS to fit the GMWL (Fig. 1). We observed thatthe not-from-concentrate orange, grapefruit, and apple juicesfell below the GMWL, indicative of the evaporativeenrichment of water within the fruit during growth.2021All the citrus juices claimed to have originated in the state ofFlorida, USA, where both the precipitation and the tap wateravailable for orange and grapefruit tree irrigation arerelatively isotopically homogeneous throughout the year.Thus, we expected - and observed - that the measured 8Hand 8180 values of water from orange and grapefruit juicesproduced in Florida generally clustered together on a H andO isotope cross plot (Fig. 1). We found that the extracted water from beer samplesanalyzed by IRIS fell above the GMWL due to the presence ofan ethanol or extremely small methanol contaminant in theextract, which act as spectral interferences.It appears thealcohol interference in the IRIS analysis of water extractedfrom beers affected the O isotope ratios more than the Hisotope ratios. The same water samples analyzed by IRMShad near identical measured 8H values (Fig. 2(a) andTable 2) while the measured 880 values did not fit the 1:1regression line of IRIS on IRMS (Fig.2(b)). Table 3. The slopes and intercepts (in units of %o) for the total least squares regression lines describing the relationship betweenthe hydrogen (top) and oxygen (bottom) isotope ratios of samples measured using both IRIS and IRMS (left), and measured asboth extracted and un-extracted complex beverages (right). Slopes and intercepts were tested against a line of slope 1 andintercept 0 using ANOVA with a Tukey’s post-hoc test IRIS vs. IRMS Complex beverages vs. extracted water Slope Significant? Intercept Significant? Slope Significant? Intercept Significant? Beer 1.001 3.375 *** 1.017 3.661 ** Soda 0.977 ** -1.620 *** 1.029 3.110 ** Bottled water 0.980 -1.087 n/a n/a Juice 0.942 ** -4.941 米 1.022 6.894 *** Milk 0.986 -1.030 1.033 4.611 ** Tap water 0.983 0.089 n/a n/a Oxygen IRIS vs. IRMS Complex beverages vs. extracted water Slope Significant? Intercept Significant? Slope Significant? Intercept Significant? Beer 0.985 -7.889 *** 0.977 -0.112 Soda 0.980 -0.071 1.017 0.205 Bottled water 0.979 0.026 n/a n/a Juice 0.969 -0.308 1.028 0.096 Milk 0.988 0.033 1.005 0.006 Tap water 0.989 0.055 n/a n/a It may not be necessary to extract water frombeverages prior to stable isotope analysis It has been previously documented that the measuredisotopic composition of pure waters analyzed using IRIS,specifically WS-CRDS, matched those same waters analyzedusingIRMS.12Disregardingextracted water samplescontaining alcohol, the isotopic compositions of extractedcomplex beverages, bottled waters, and tap waters analyzedby IRIS in this study generally agreed well with those samesamples analyzed by IRMS (Figs. 2(a) and 2(b)). However,the lines describing the relationship between the 8H valueof extracted soda and juice waters analyzed using both IRISand IRMS were significantly different from a line with a slopeof 1 and an intercept of 0. The difference between the slopesand intercepts of the 1:1 line and the soda/juice lines wererelatively small, suggesting that the phenomenon affectingthe measured 8H values of the sodas and juices had aminor - albeit statistically significant - impact. We assume, as did West and colleagues,? a source of errorin the IRIS-measured 8H values. That is, we assume that theIRMS-measured8H values are correct and the comparisonof IRIS measurements with them is demonstrating aninaccuracy of the WS-CRDS analyzer for these samples.Similar to the waters extracted from plant leaves and soilsby West et al.,2 the waters extracted from sodas andjuices presumably included some trace amounts of organiccontaminants that may have introduced a spectral inter-ference and had an impact on the IRIS measurements. Forsodas, these were probably the colorings and flavorings thatgive the carbonated soft drinks their distinctive appearanceand taste. For the juices, fruits probably contain similarorganic contaminants to those observed in extracted plant leaf waters. However, if such components did causespectral interference in our IRIS measurements of soda andjuice waters, these effects were much smaller than thoseobserved in the study of plant and soil waters. In fact, theIRIS/IRMS lines for the extracted sodas and juices suggestthat the differences between the two measurement methodsare smaller than both the stated IRIS machine precision andthe calculated standard deviation of Evianbottled waterincluded in our analysis runs across the range of valuesmeasured here. The differences between the two methodswould only be significantly greater than the instrumentprecision for beverage waters that have extremely high orlow 8Hvalues. We observed that the8H and 8 values of extractedcomplex beverages measured by IRIS generally matchedthe 8H andl 88o values of the beverages analyzedwithout water extraction by IRIS (Figs. 3(a) and 3(b)), albeitwith some variation in measured 8Hvalues. This suggeststhat it may not be necessary to extract water from beveragesprior to isotope analysis, although unextracted complexbeverage 8H values may need to have a beverage-specificoffset correction applied post-analysis (Table2). Despite this,these results demonstrate that it may be possible to reducethe time and manpower required between beverage collec-tion and stable isotope ratio analysis by simply analyzinga complex beverage without prior water extraction usingWS-CRDS. Caution is needed when analyzing complexbeverages 'as is’ using IRIS Before we can recommend the analysis of complex beverageswithout water extraction using the WS-CRDS analyzers Extracted water measured 8^H,%。 Extracted water measured 80,% Figure 3. Cross plot of the 8H (A) and 8180 (B) values ofextracted complex beverages and those same complex bev-erages analyzed without water extraction using IRIS. The 1:1line is shown for reference by the solid black line in eachpanel. produced by Picarro Inc., we note that some precautions areneeded both when analyzing samples and when correctingdata. First, the syringe used for injection of complexbeverages into the vaporization chamber can quicklybecome clogged. This most frequently occurred after theinjection of juices, which contained high concentrations ofsugars. Soaking the syringe in warm water dissolved themost persistent obstructions, and routine cleaning (at leastevery 8 h) of the syringe with a series of ethanol and waterrinses generally prevented sugar crystals from accumulat-ing. We note that we used the standard injection methodprotocol as programmed on the Picarro model L1102-iwater analyzer, which did not include a procedure to solvent-clean the syringe between sample injections. Itwould be relatively straightforward to modify this presetprogram to include such a cleaning step, thereby reducingthe likelihood of obstructions forming in the syringe due tosugars. Secondly, beverage particulates, such as dissolved sugars,were directly injected into the vaporization chamber, coatingit with sticky, caramel-colored residue that was easily visiblewithin the injection inlet and difficult to remove by scrapingwith a metal spatula. This residue was probably the causeof the increased memory seen during the IRIS analysisof complex beverages. In fact, two batches of complexbeverages were analyzed in sequence and the memorycorrection values determined for the second analysis run ofcomplex beverages were higher than those applied to the firstanalysis run (Table 1), implying that the memory increasedas the amount of residue increased. This suggests that (1) thevaporization chamber should be cleaned regularly to removeresidue, preventing the increase of machine memory; and (2)as the memory increases, it may be necessary to increase thenumber of sample injections. Alternatively, the system couldbe modified to include a surface for particulates and residueto accumulate before the vaporization chamber. This is thepreferred solution, as it does not require machine downtimefor maintenance or increase the amount of time (i.e., injectionreplicates) needed to analyze a sample. Picarro Inc. recentlyintroduced a high-throughput vaporizer (model A0212) thatincludes a removable inlet liner for this purpose althoughthis liner was not developed in time for use in this study. Finally, the stable oxygen isotope analysis of alcohol-containing samples using IRIS is not currently possible.While the 8H values of alcohol-containing beer samplesmeasured by IRIS matched those measured by IRMS, wefound that the measured 8180 values did not agree betweenthe two measurement methods. It may be possible to correctfor the interference of ethanol and methanol, as suggested byBrand and colleagues.2 However, this requires that usersknow or measure the concentration of ethanol and methanolwithin their samples a priori so that appropriate correctionsare applied. At the time of this study, there were no options in theWS-CRDS water analyzer software to apply an alcoholcontaminant correction or to identify those samples thatprobably contained ethanol and/or methanol and thusrequired correction. Picarro Inc. has recently introducedChemCorrectM, software that can screen for spectroscopicirregularities and compare those irregularities against alibrary of known, common water contaminants. To date, wehave not had the opportunity to use ChemCorrectM whenanalyzing beverages containing alcohol in order to identifysuspect analytical results. From this work, we found thatcomparing the 8H and 8180 values of samples measuredusing IRIS with the GMWL was a simple way to identifyextracted water samples from beer that contained 3-9%alcohol by volume (ABV) as those samples fell above theGMWL. More work is needed to determine if the measuredisotope ratios of other beverages containing alcohol at higher(e.g., wine with ~10-15% ABV) or lower (e.g., kombucha, orfermented tea, with 0.5-1.0% ABV) concentrations fit thesame pattern. The use of stable isotope analysis, among other analyticaltechniques, for tracking and tracing the origin of foods andbeverages is rapidly expanding, for example throughcoordinated efforts such as the recently completed TRACEProject,23 a 5-year program sponsored by the EuropeanUnion to develop methods to trace the origin of food.24-26 Asconsumers demand more information about food items intheir diet, including how and where foods and beverageswere produced, the need for food traceability using rapidtechniques like stable isotope analysis grows. In this study we have demonstrated that it is possible toquickly and efficiently analyze several types of beverages'as is', without an initial time-consuming extraction of water,using isotope ratio) infrared spectroscopy, specificallywavelength-scanned cavity ring-down spectroscopy. Formost beverages under consideration, the stable isotopeanalysis of extracted water using either IRIS or IRMSreturned matching or near-to-matching results. Demonstrat-ing even more promise, the results of the IRIS measurementof the oxygen isotope ratios of extracted beverages waterswere statistically indistinguishable from the 8o valuesobtained from the IRIS analysis of unextracted complexbeverage; the hydrogen isotope ratios fit 1:1 lines with someevidence of a beverage-specific offset. However, the smalldifferences in the 8H values of waters extracted from sodasand juices measured using both IRIS and IRMS cause us torecommend, as did West et al.,2 that investigators cross-check the IRIS-measured 8H and 818O values of waters (andbeverages) under consideration using IRMS before begin-ning the wholesale analysis of waters using isotope ratioinfrared spectroscopy. Acknowledgements We thank Jordan Denos for completing beverage waterextractions and preparing sample vials for analysis. IainGreen (Picarro Inc.) purchased beverages in CA. Janet Barn-ette (IsoForensics Inc.) purchased beverages in WA. Fundingfor beverage collection and analysis was provided by Iso-Forensics Inc. REFERENCES 1. Craig H. Science 1961;133:1702. 2. Chesson LA, Valenzuela LO, O'Grady SP, Cerling TE, Ehler-inger JR. J. Agric. Food Chem. 2010; DOI: 10.1021/jf904151c. 3. Chesson LA, Valenzuela LO,O'Grady SP,Cerling TE, Ehler-inger JR. J. Agric. Food Chem. 2010; DOI:10.1021/jf1003539. 4.BFowen GJ, Winter DA, Spero HJ, Zierenberg RA, ReederMD, Cerling TE, Ehleringer JR. Rapid Commun. Mass Spec-trom. 2005;19: 3442. 5. Bowen GJ,RevenaughJ. Water Resources Res. 2003;39:1299. 6. Bowen GJ, Ehleringer JR, Chesson LA, Stange E, Cerling TE.Water Resources Res. 2007; 43: W03419. 7. Brencic M, Vreca P. Rapid Commun. Mass Spectrom. 2006; 20:3205. 8. West JB, Ehleringer JR, Cerling TE. J. Agric. Food Chem. 2007;55:7075. 9. Bong Y-S, Ryu J-S, Lee K-S. Anal. Chim. Acta 2009; 631: 189. 10. Papesch W, Horacek M. Science and Justice 2009;49:138. 11. Crittenden RG, Andrew AS, LeFournour M, Young MD,Middleton H, Stockman R. Int. Dairy J. 2007;17: 421. 12. Brand WA, Geilmann H, Crosson ER, Rella CW. RapidCommun. Mass Spectrom. 2009;23: 1879. 13. West AG, Patrickson SJ, Ehleringer JR. Rapid Commun. MassSpectrom. 2006; 20:1317. 14. O'Keefe A, Deacon DAG. Rev. Sci. Instrum. 1988; 59:2544. 15. Wahl EH, Fidric B, Rella CW, Koulikov S, Kharlamov B,Tan S,Kachanov AA, Richman BA, Crosson ER, Paldus BA, KalaskarS, Bowling DR. Isot. Environ. Health Stud. 2006; 42: 21. 16.B1erden G, Peeters R, Meijer G. Int. Rev. Phys. Chem. 2000;19:565. 17. Lis GP, Wassenaar LI,Hendry MJ. Anal. Chem. 2008; 80:287. 18. Gupta P, Noone D, Galewsky J, Sweeney C, Vaughn BH.Rapid Commun. Mass Spectrom. 2009;23:2534. 19. Berman ESF, Gupta M, Gabrielli C, Garland T,McDonnell JJ.Water Resources Res. 2009;DOI: 10.1029/2009WR008265. 20. Dunbar J, Wilson AT. Plant Physiol. 1983; 72: 725. 21. Bong Y-S, Lee K-S, Shin W-J,Ryu J-S. Rapid Commun. Mass 22. West AG, Goldsmith GR, Brooks PD, Dawson TE. RapidCommun. Mass Spectrom. 2010; 24:1948.23. Available: trace.eu.org. 24. Camin F, Bontempo L, Heinrich K, Horacek M, Kelly SD,Schlicht C,Thomas F, Monahan F, Hoogewerff J, RossmannA. Anal. Bioanal. Chem. 2007;389: 309. 25. Camin F, Larcher R, Nicolini G, Bontempo L,Bertoldi D,Perini M, Schlicht C, Schellenberg A, Thomas F,Heinrich K,Voerkelius S, Horacek M, Ueckermann H, Froeschl H, Wim-mer B, Heiss G, Baxter M, Rossmann A, Hoogewerff J.J.Agric. Food Chem. 2010; DOI: 10.1021/jf902814s. ( 26. Schellenberg A, C hmielus S, S c hlicht C, C amin F, P er ini M,Bontempo L, H e inrich K, Kelly SD, R ossmann A, Thomas F,Jamin E, Horacek M. Food Chem. 2 0 10; DOI: 1 0 .1016/j.food- chem.2009.12.082. ) Copyright C John Wiley & Sons, Ltd. Copyright C John Wiley & Sons, Ltd.Rapid Commun. Mass Spectrom. OI:rcm
确定
还剩7页未读,是否继续阅读?

北京普瑞亿科科技有限公司为您提供《饮料中水稳定性同位素检测方案(同位素质谱仪)》,该方案主要用于果蔬汁类及其饮料中理化分析检测,参考标准--,《饮料中水稳定性同位素检测方案(同位素质谱仪)》用到的仪器有