


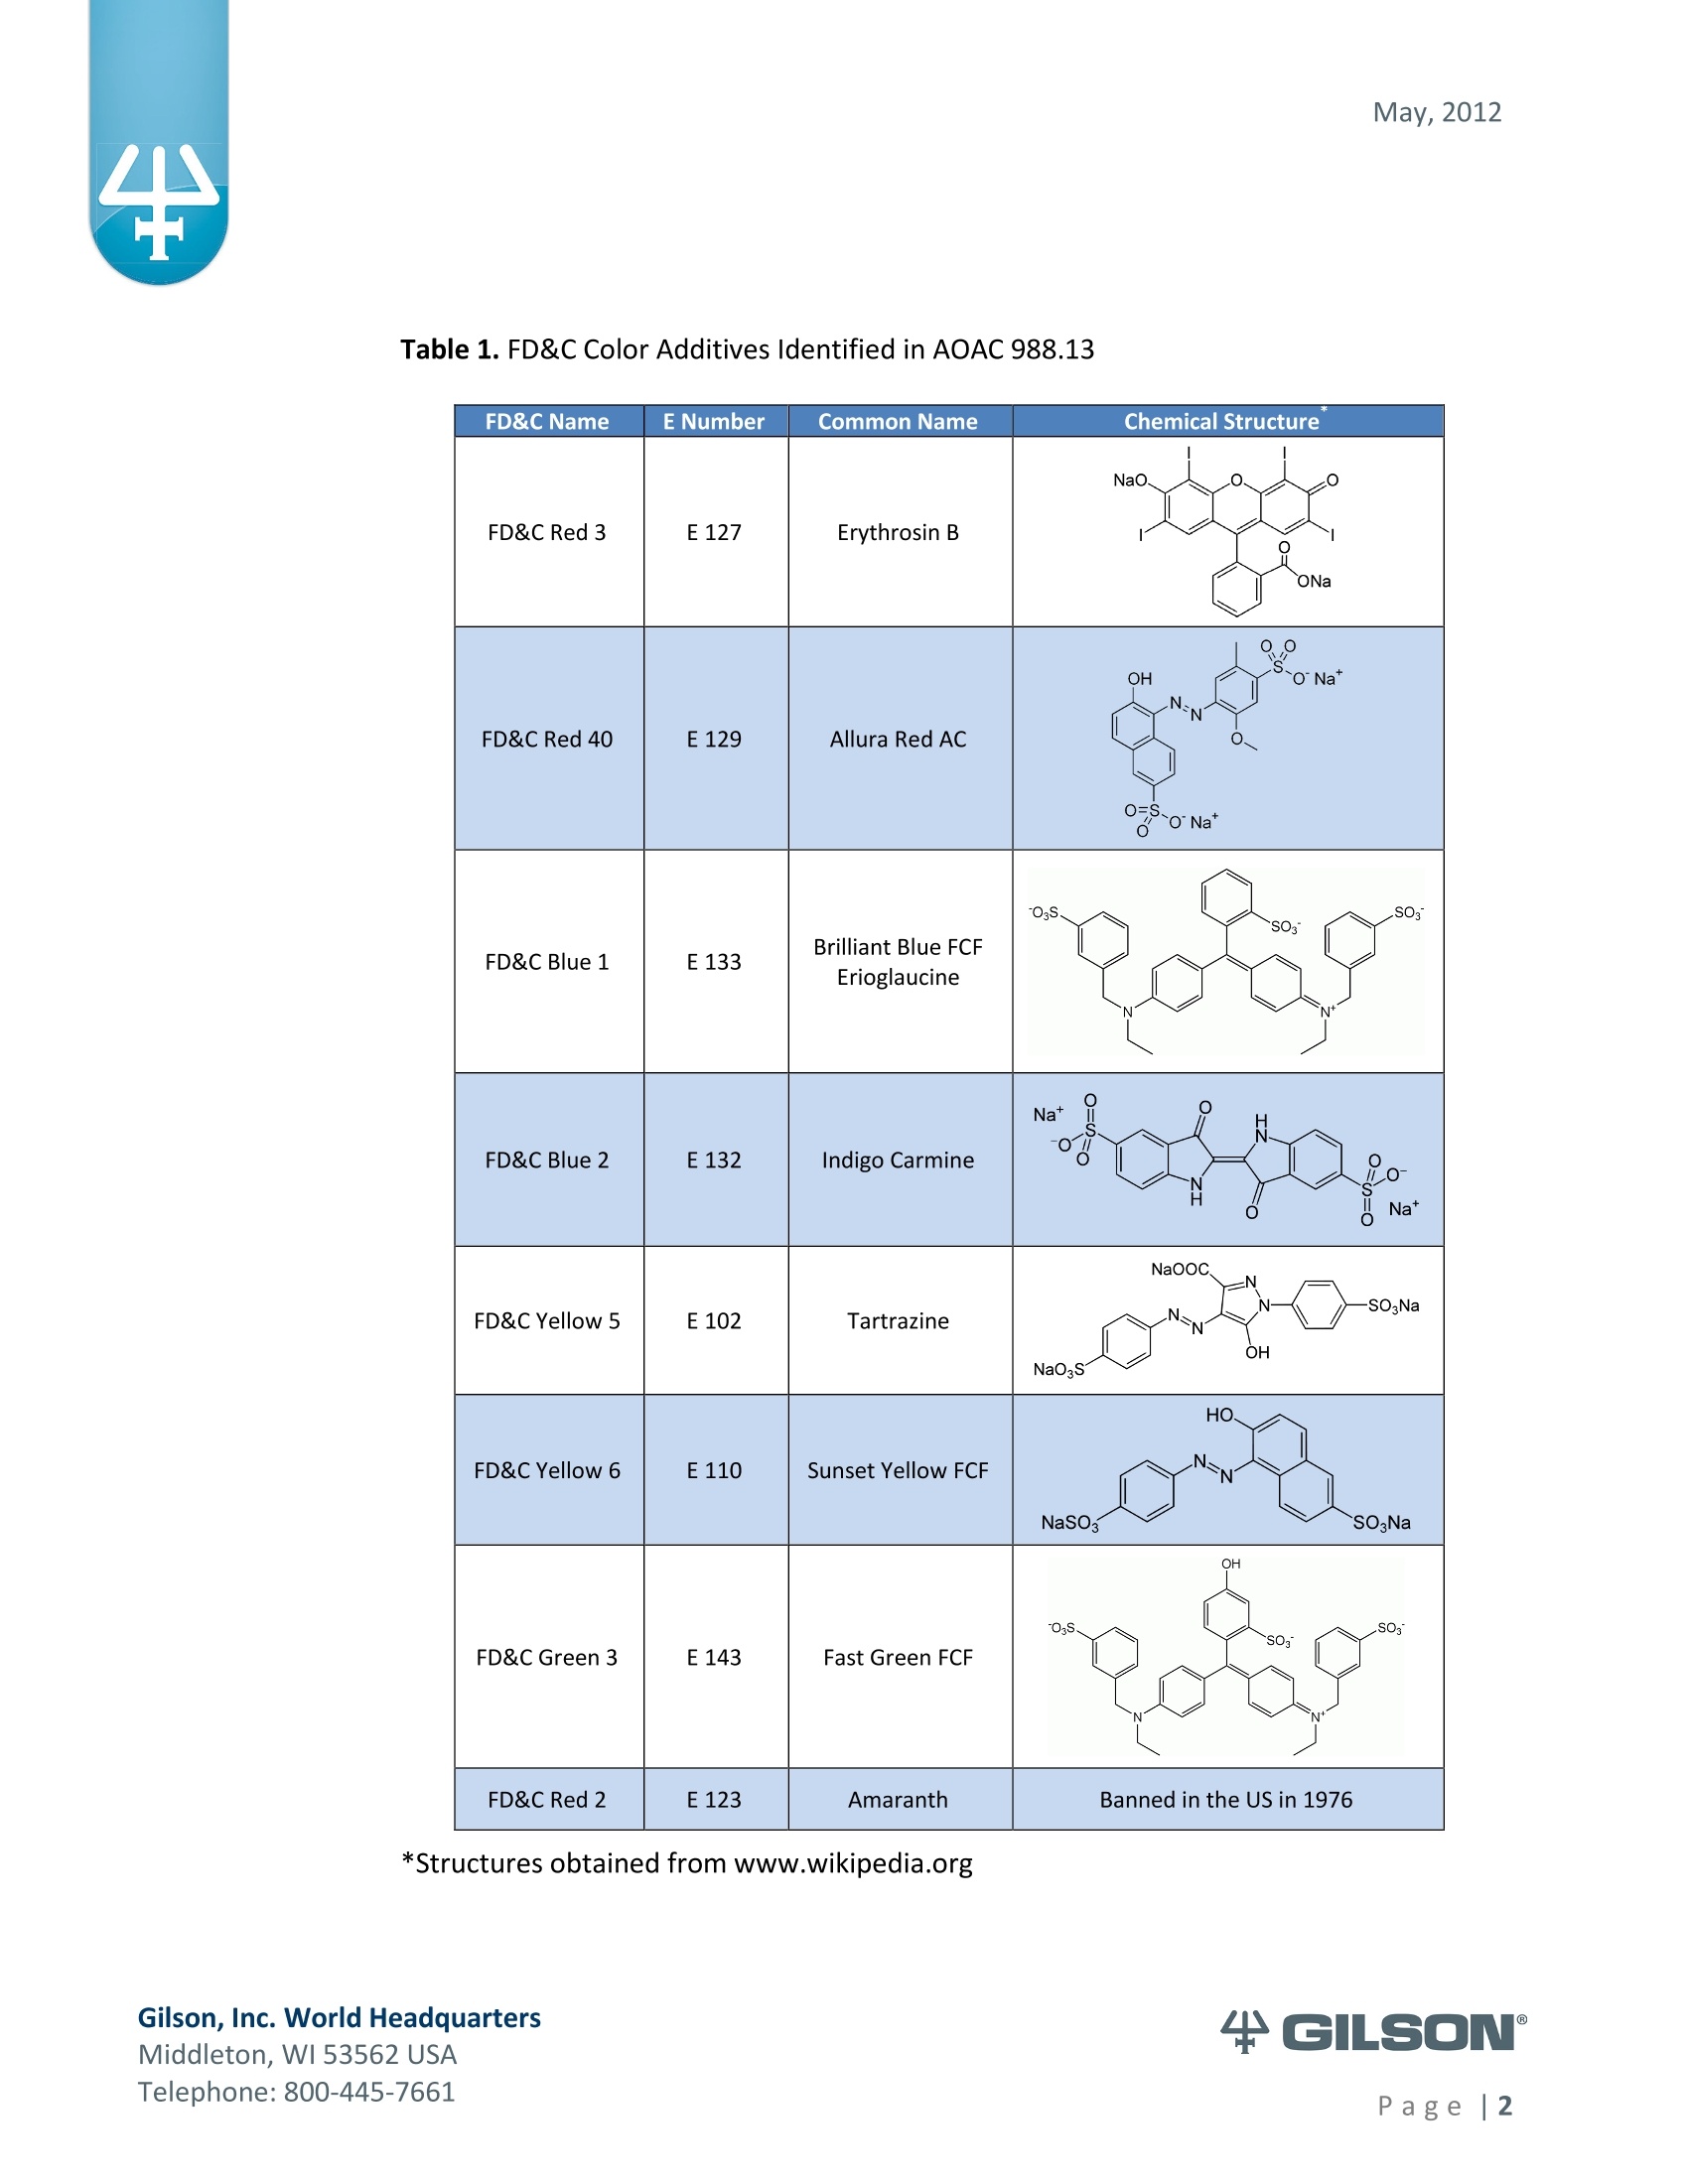
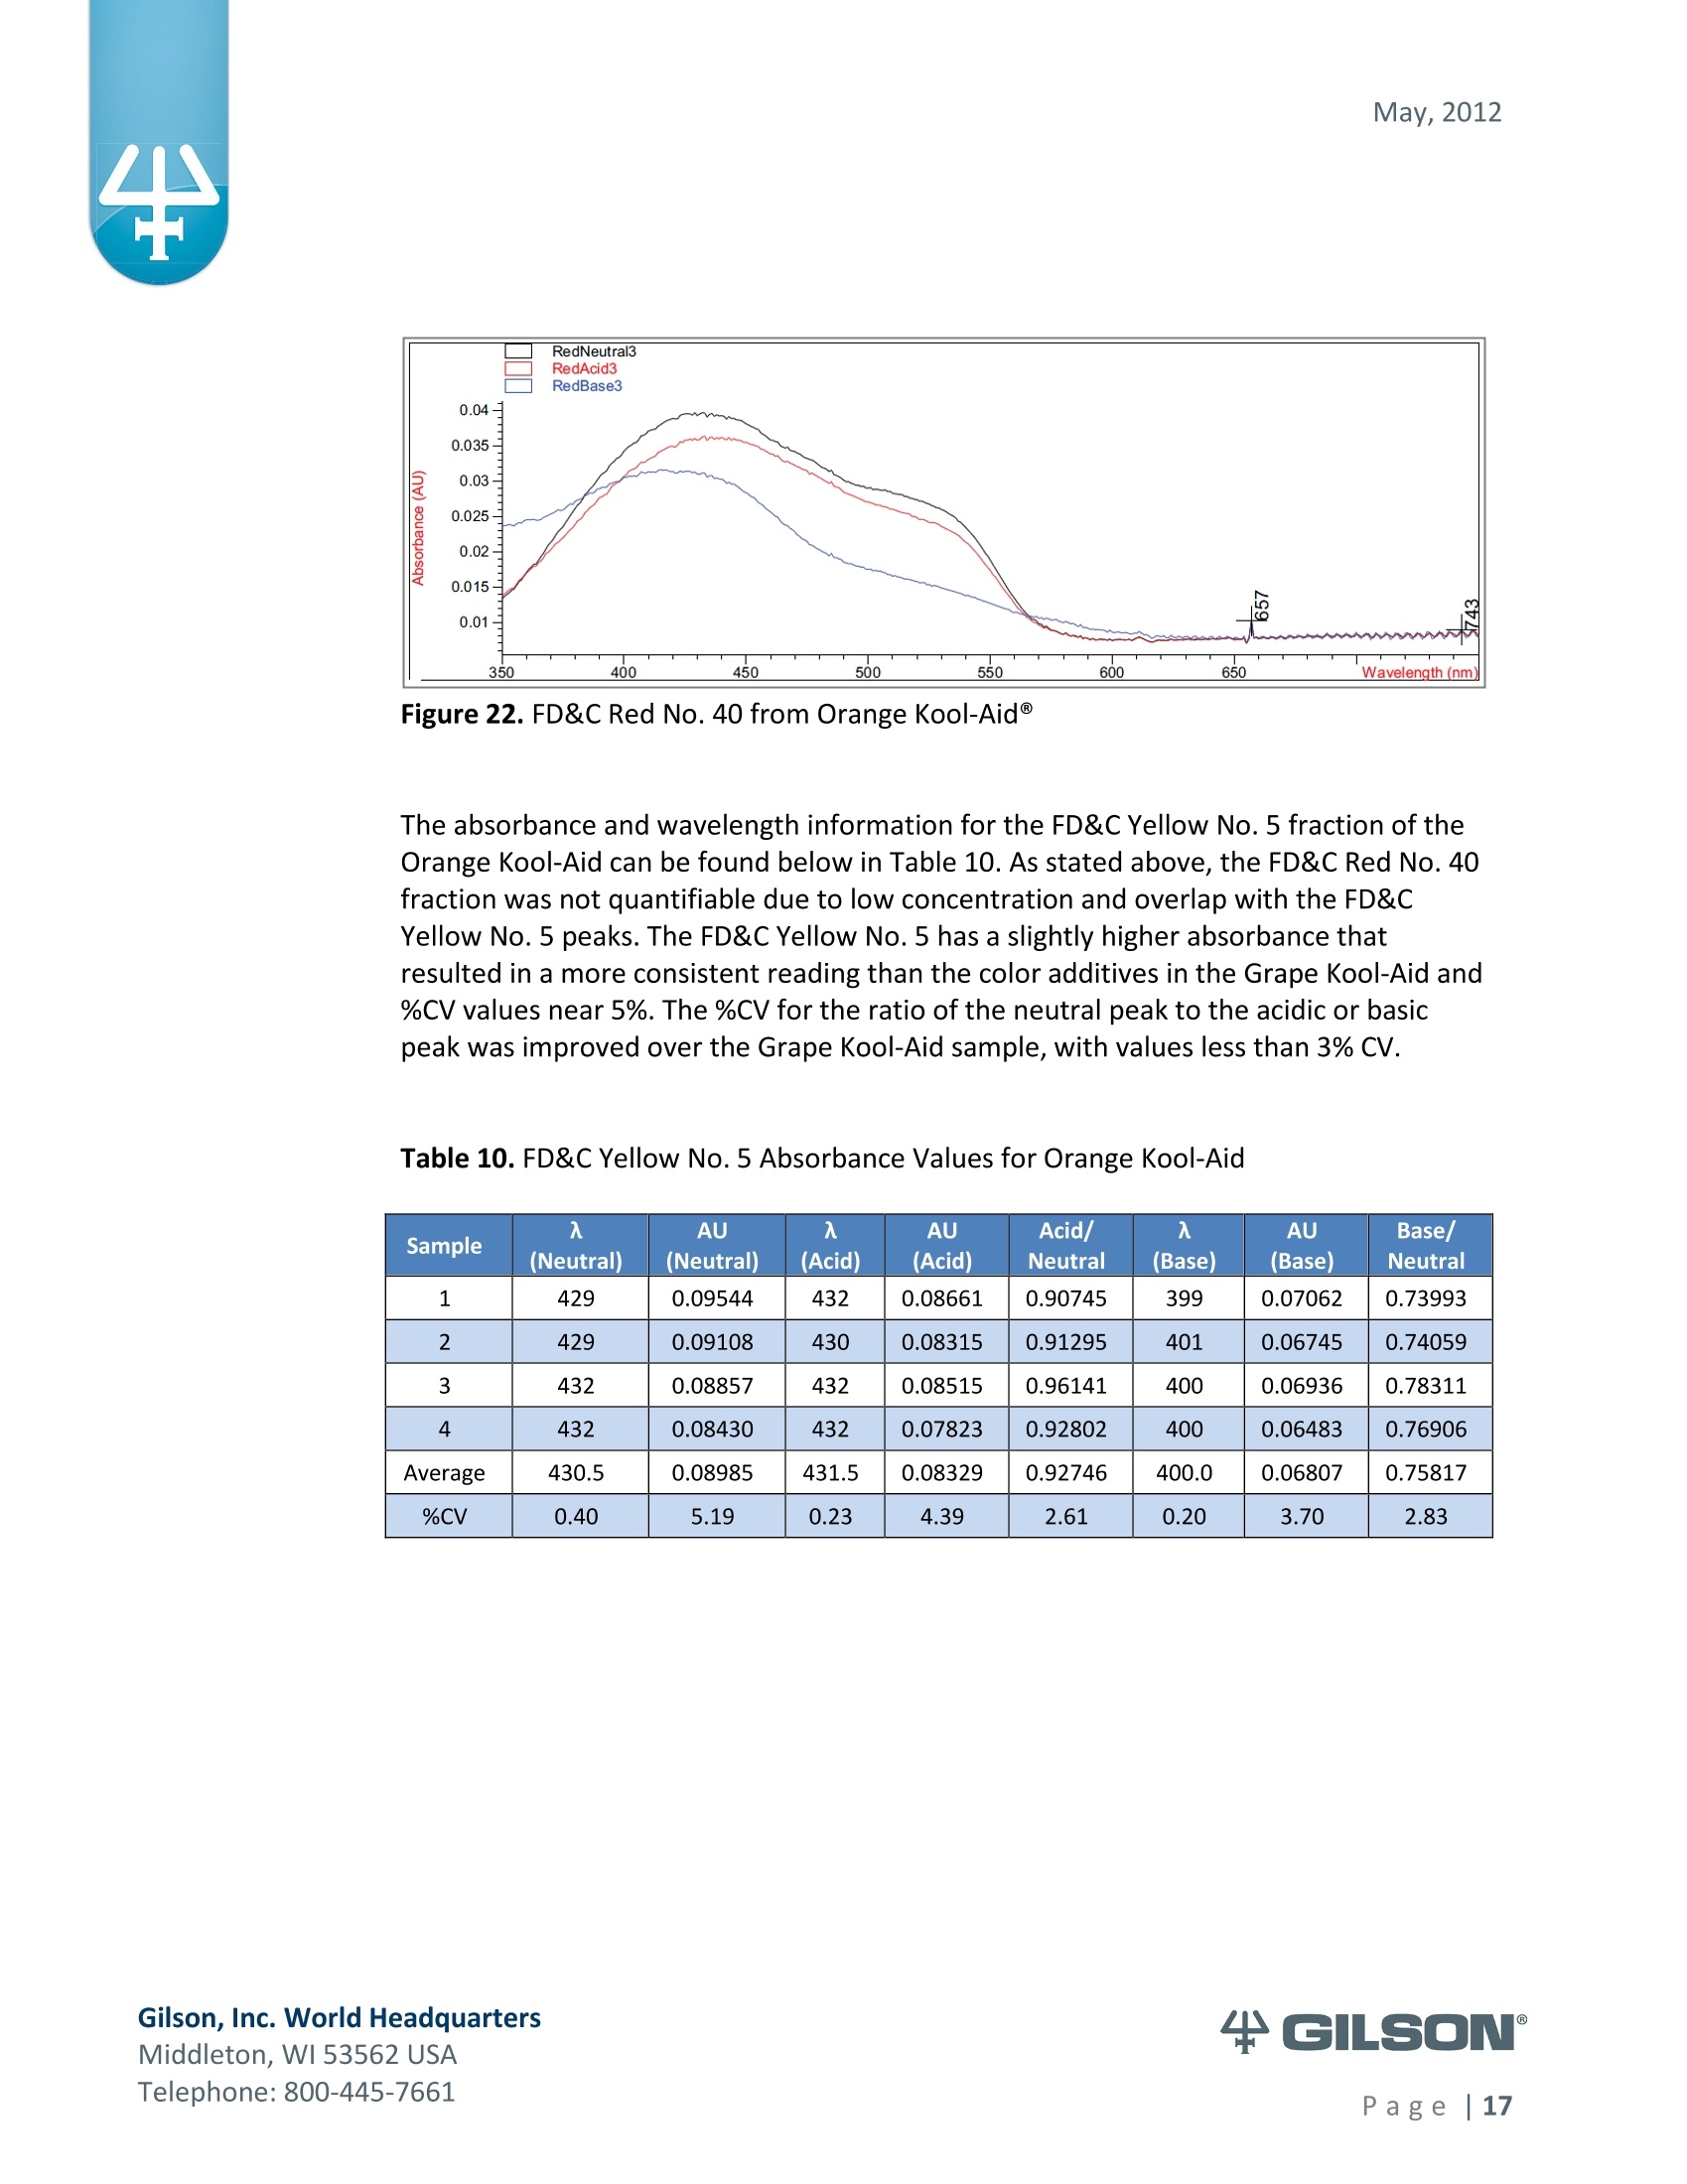
AOAC method 988.13 qualitatively tests for the presence of eight synthetic color additives, one of which is now banned. These color additives are FD&C colors approved for use in food, drugs and cosmetics. Additives are extracted from the sample matrix using solid phase extraction (SPE), and then identified by spectrum analysis on a spectrophotometer. The color additives examined by the method – FD&C Red Nos. 3 and 40, Blue Nos. 1 and 2, Yellow Nos. 5 and 6, Green No. 3 and the now banned Red No. 2 – are listed in Table 1, along with the E Number used in the EU and UK, common chemical name and chemical structure.
方案详情

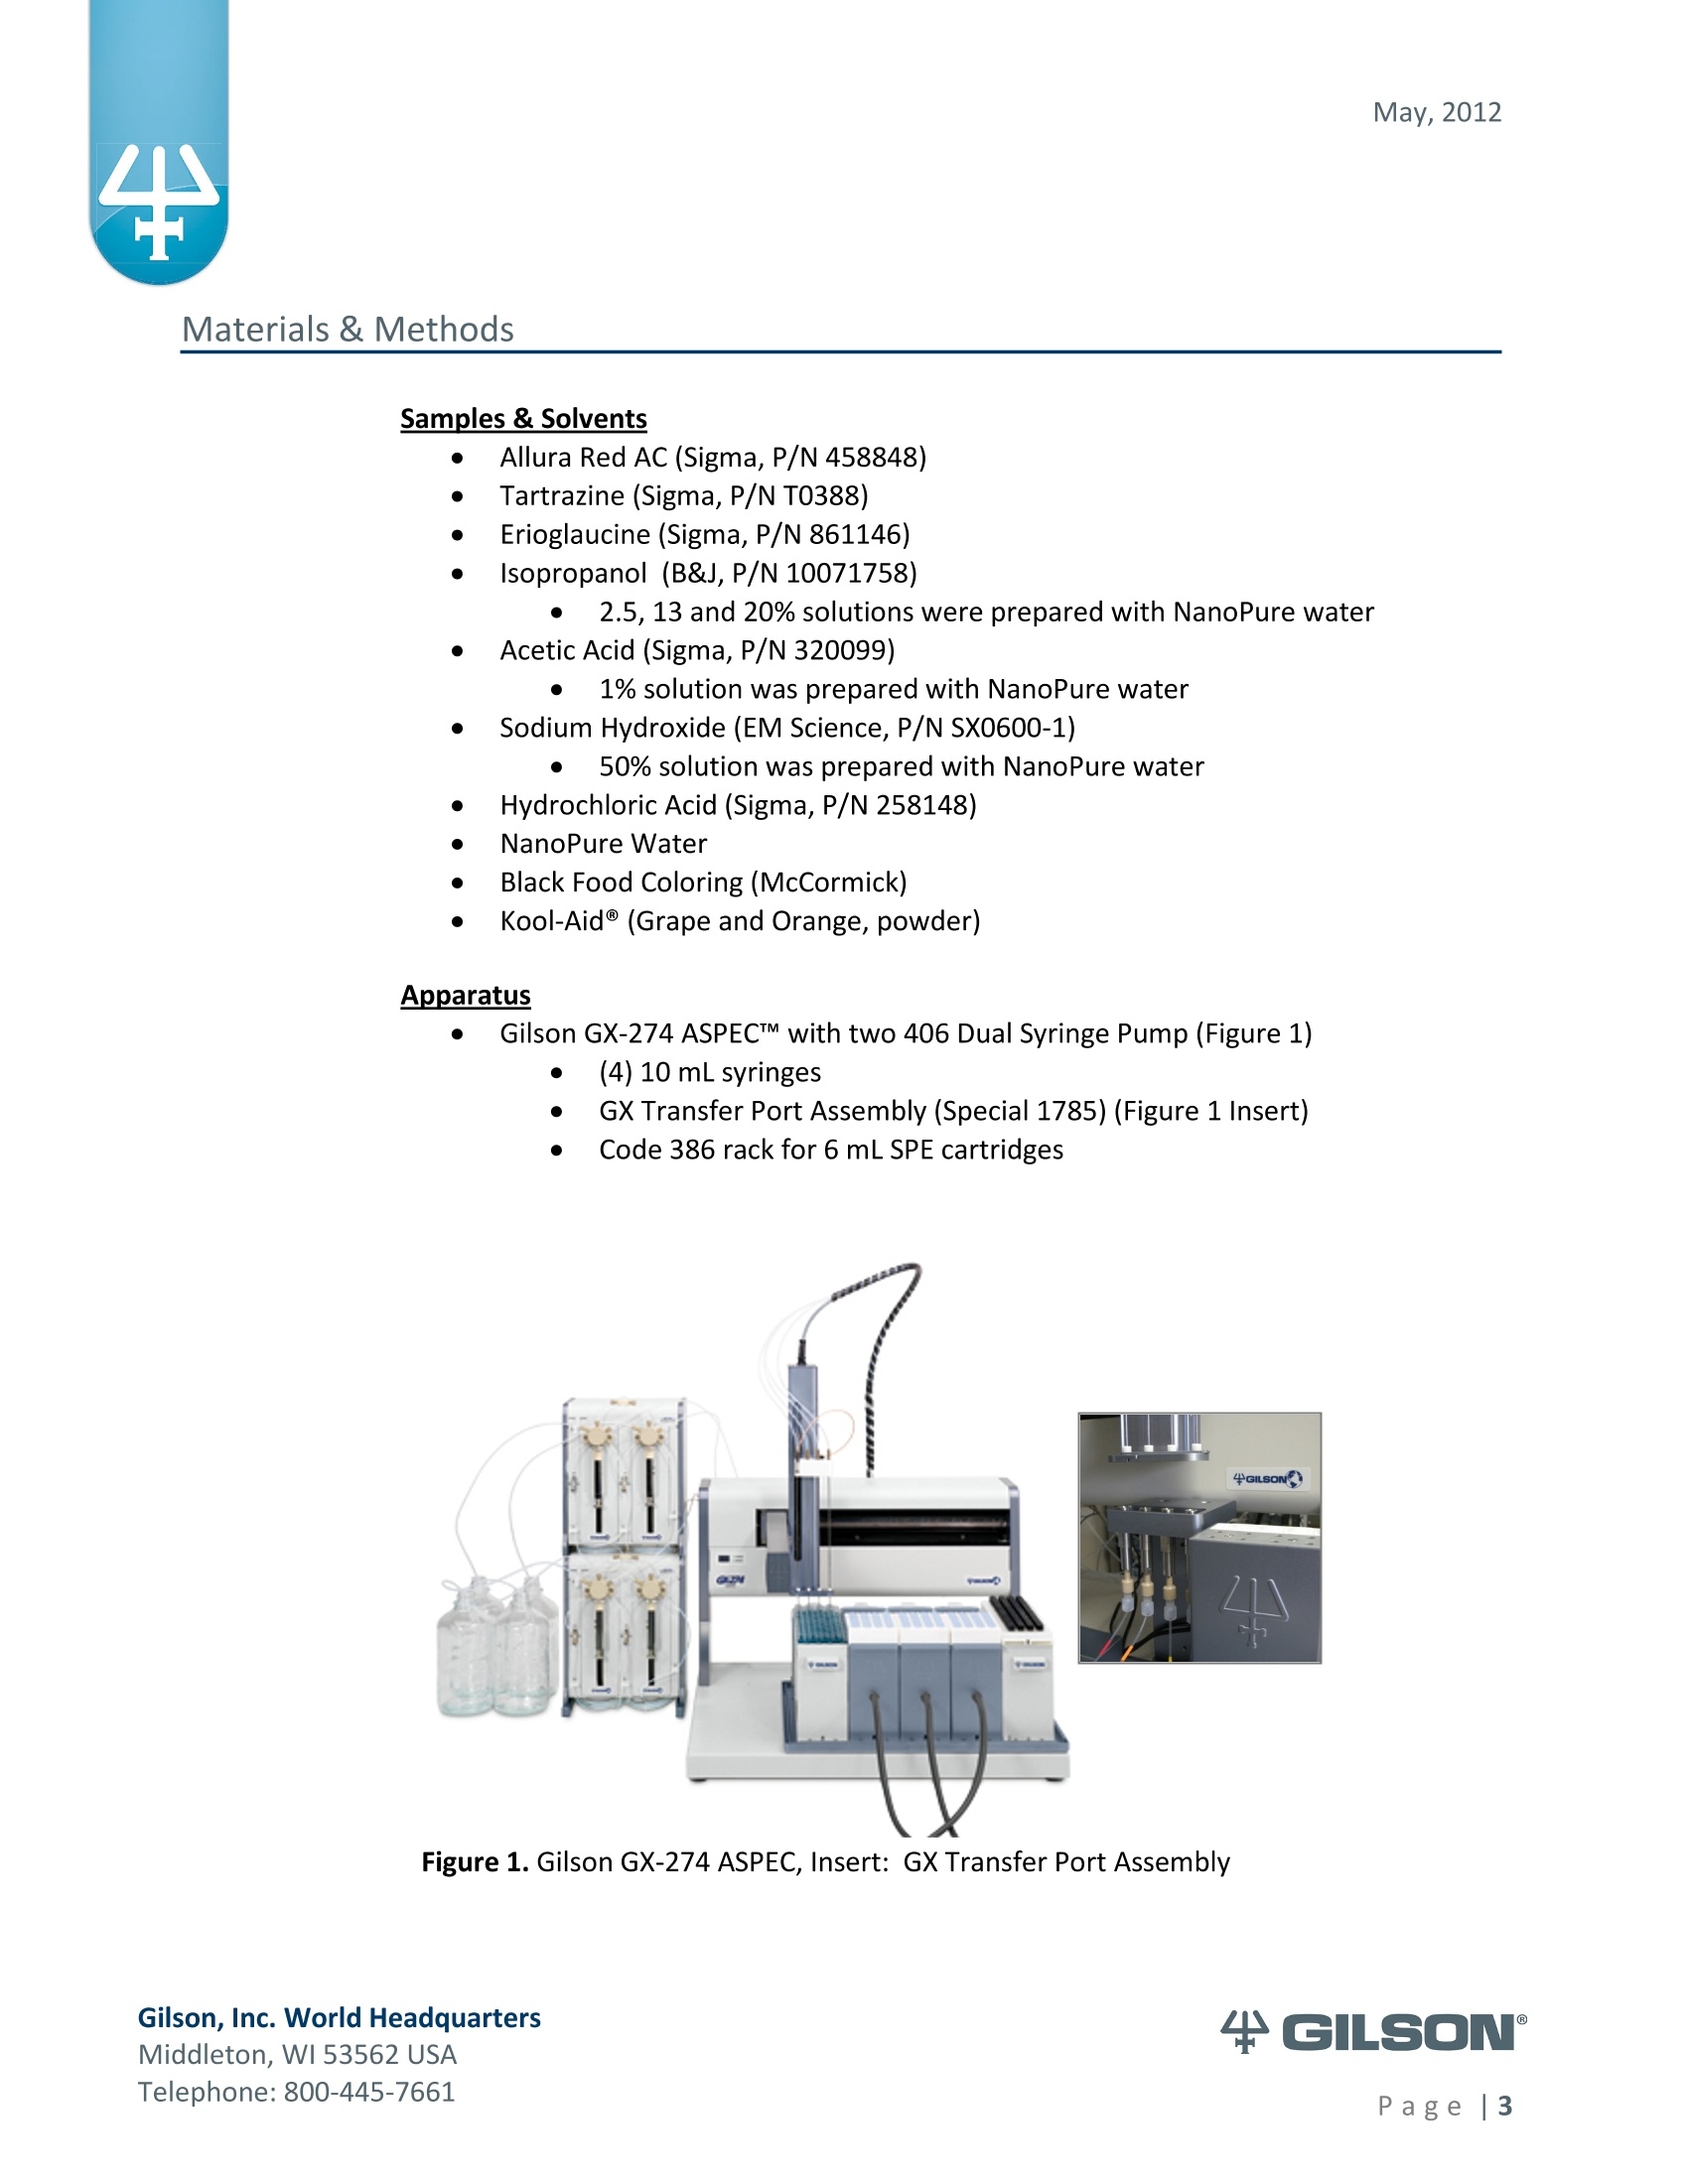
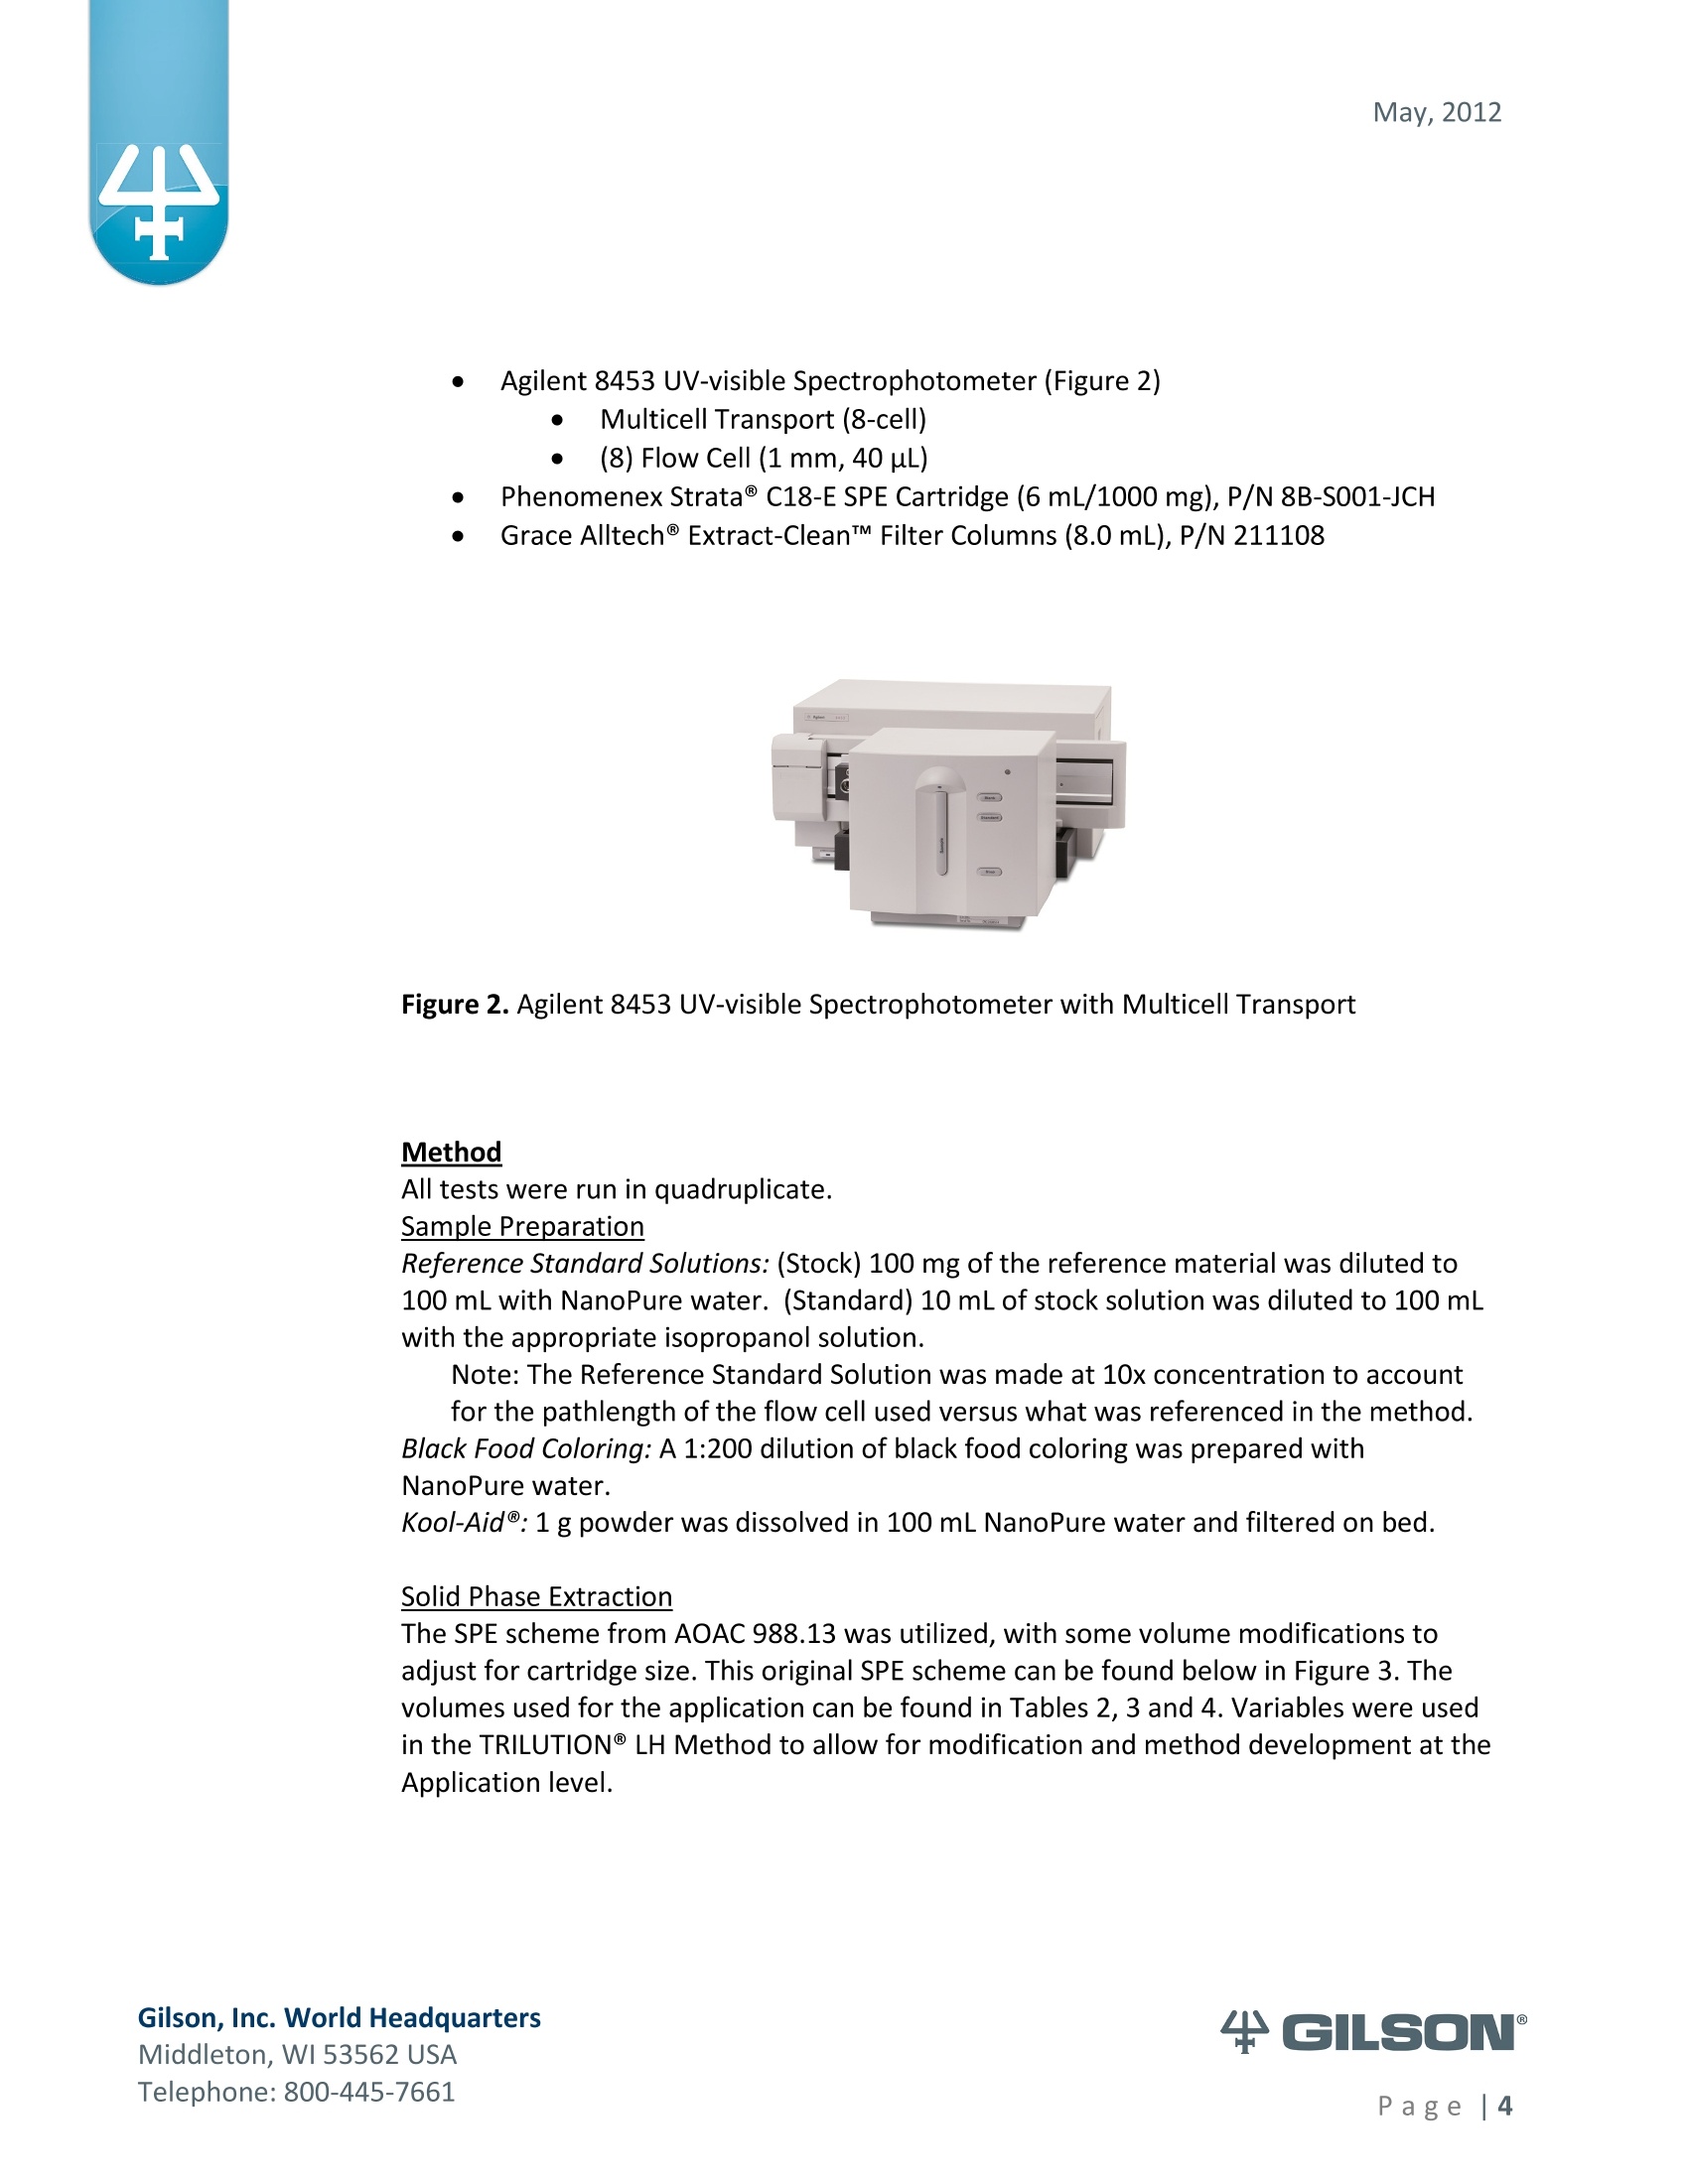
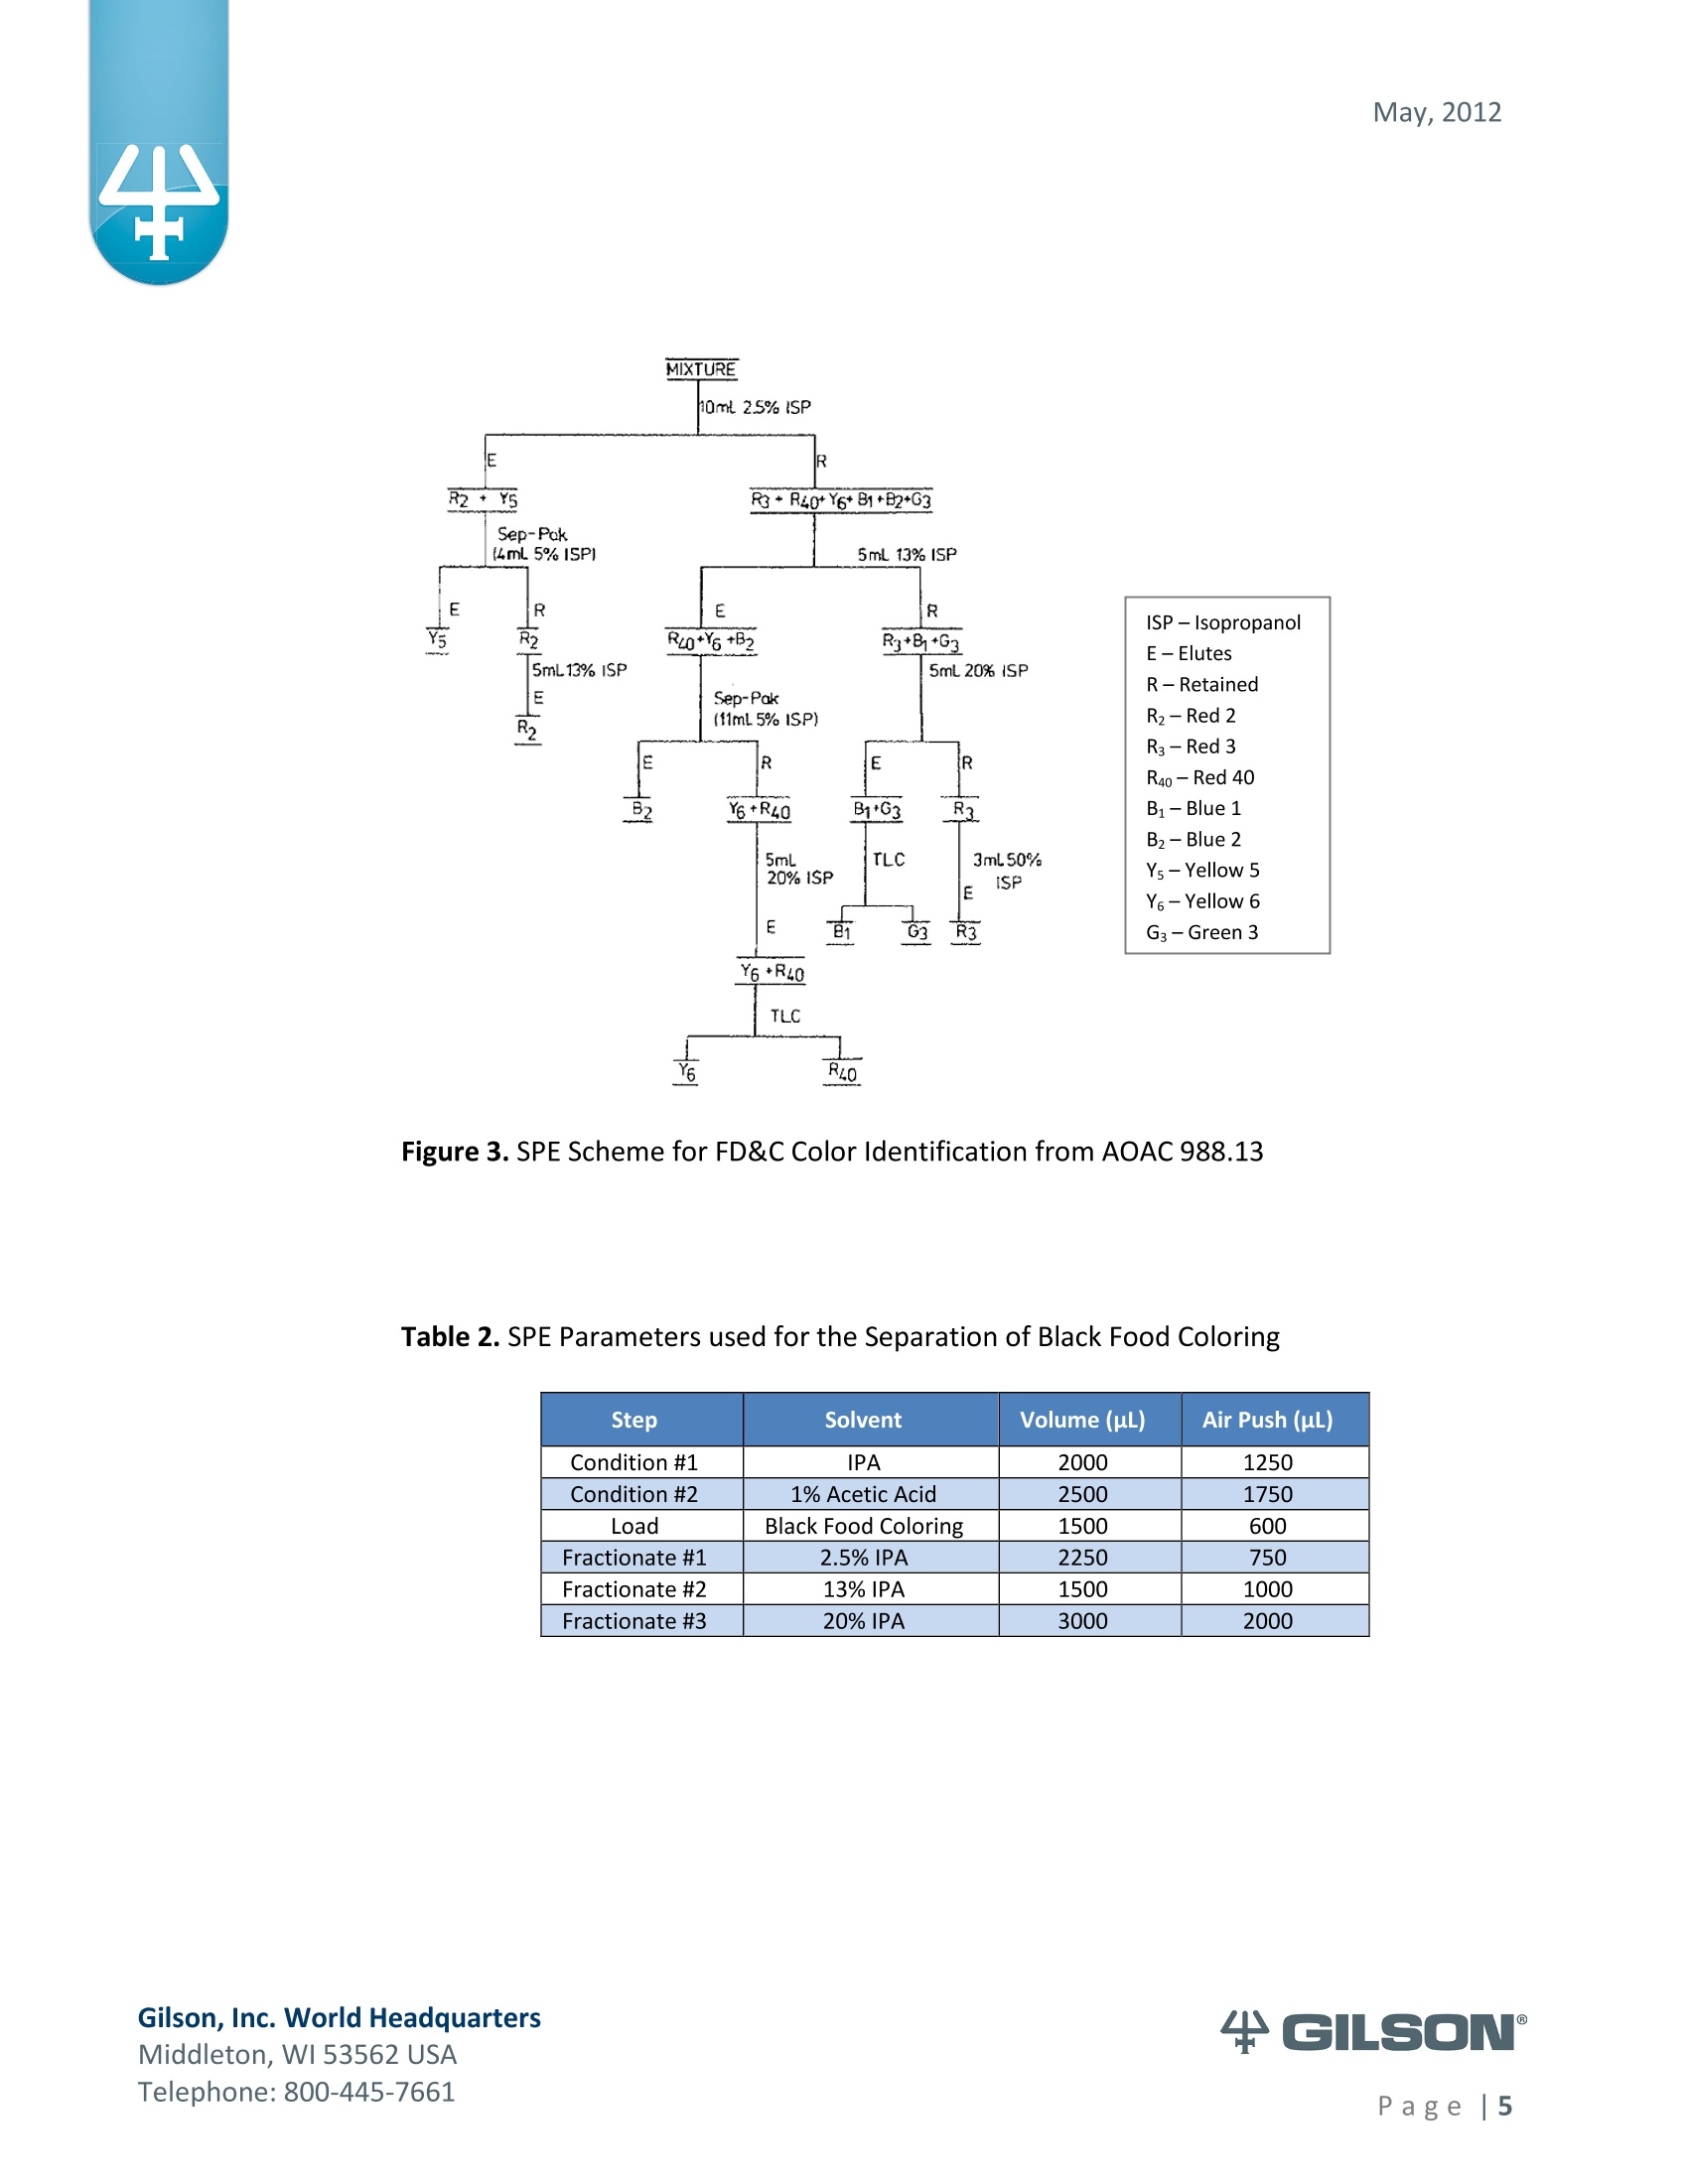
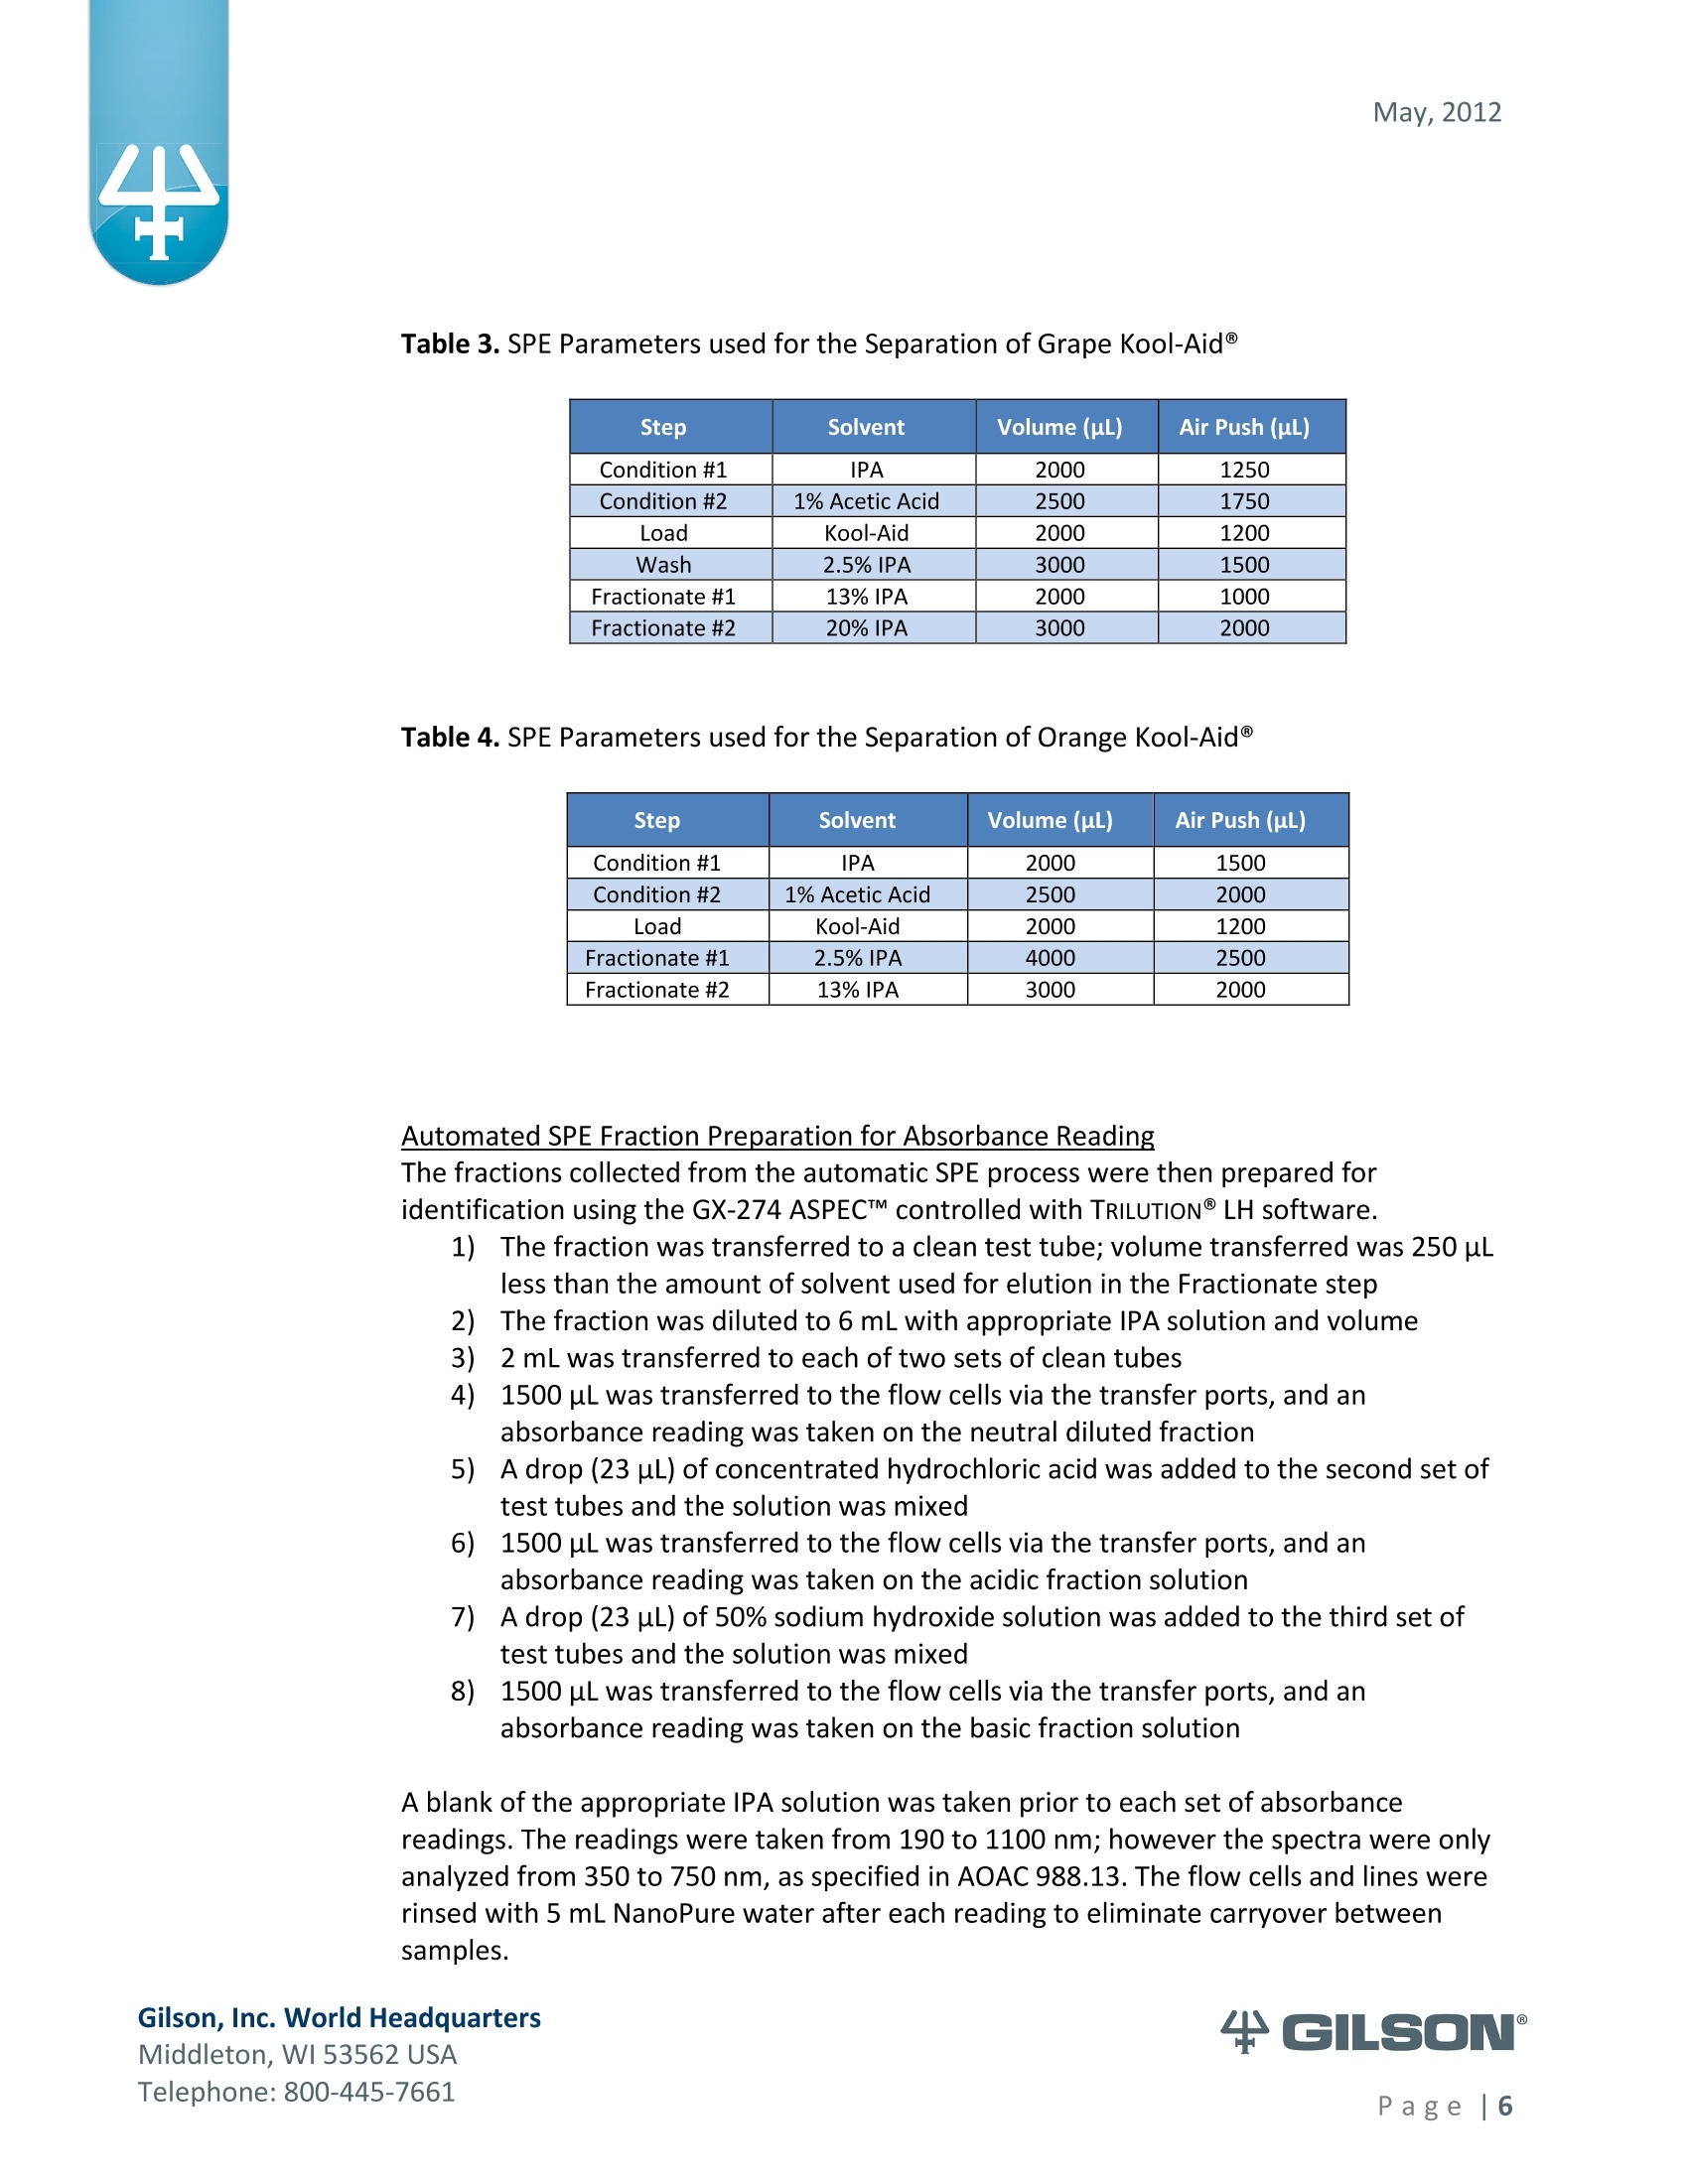
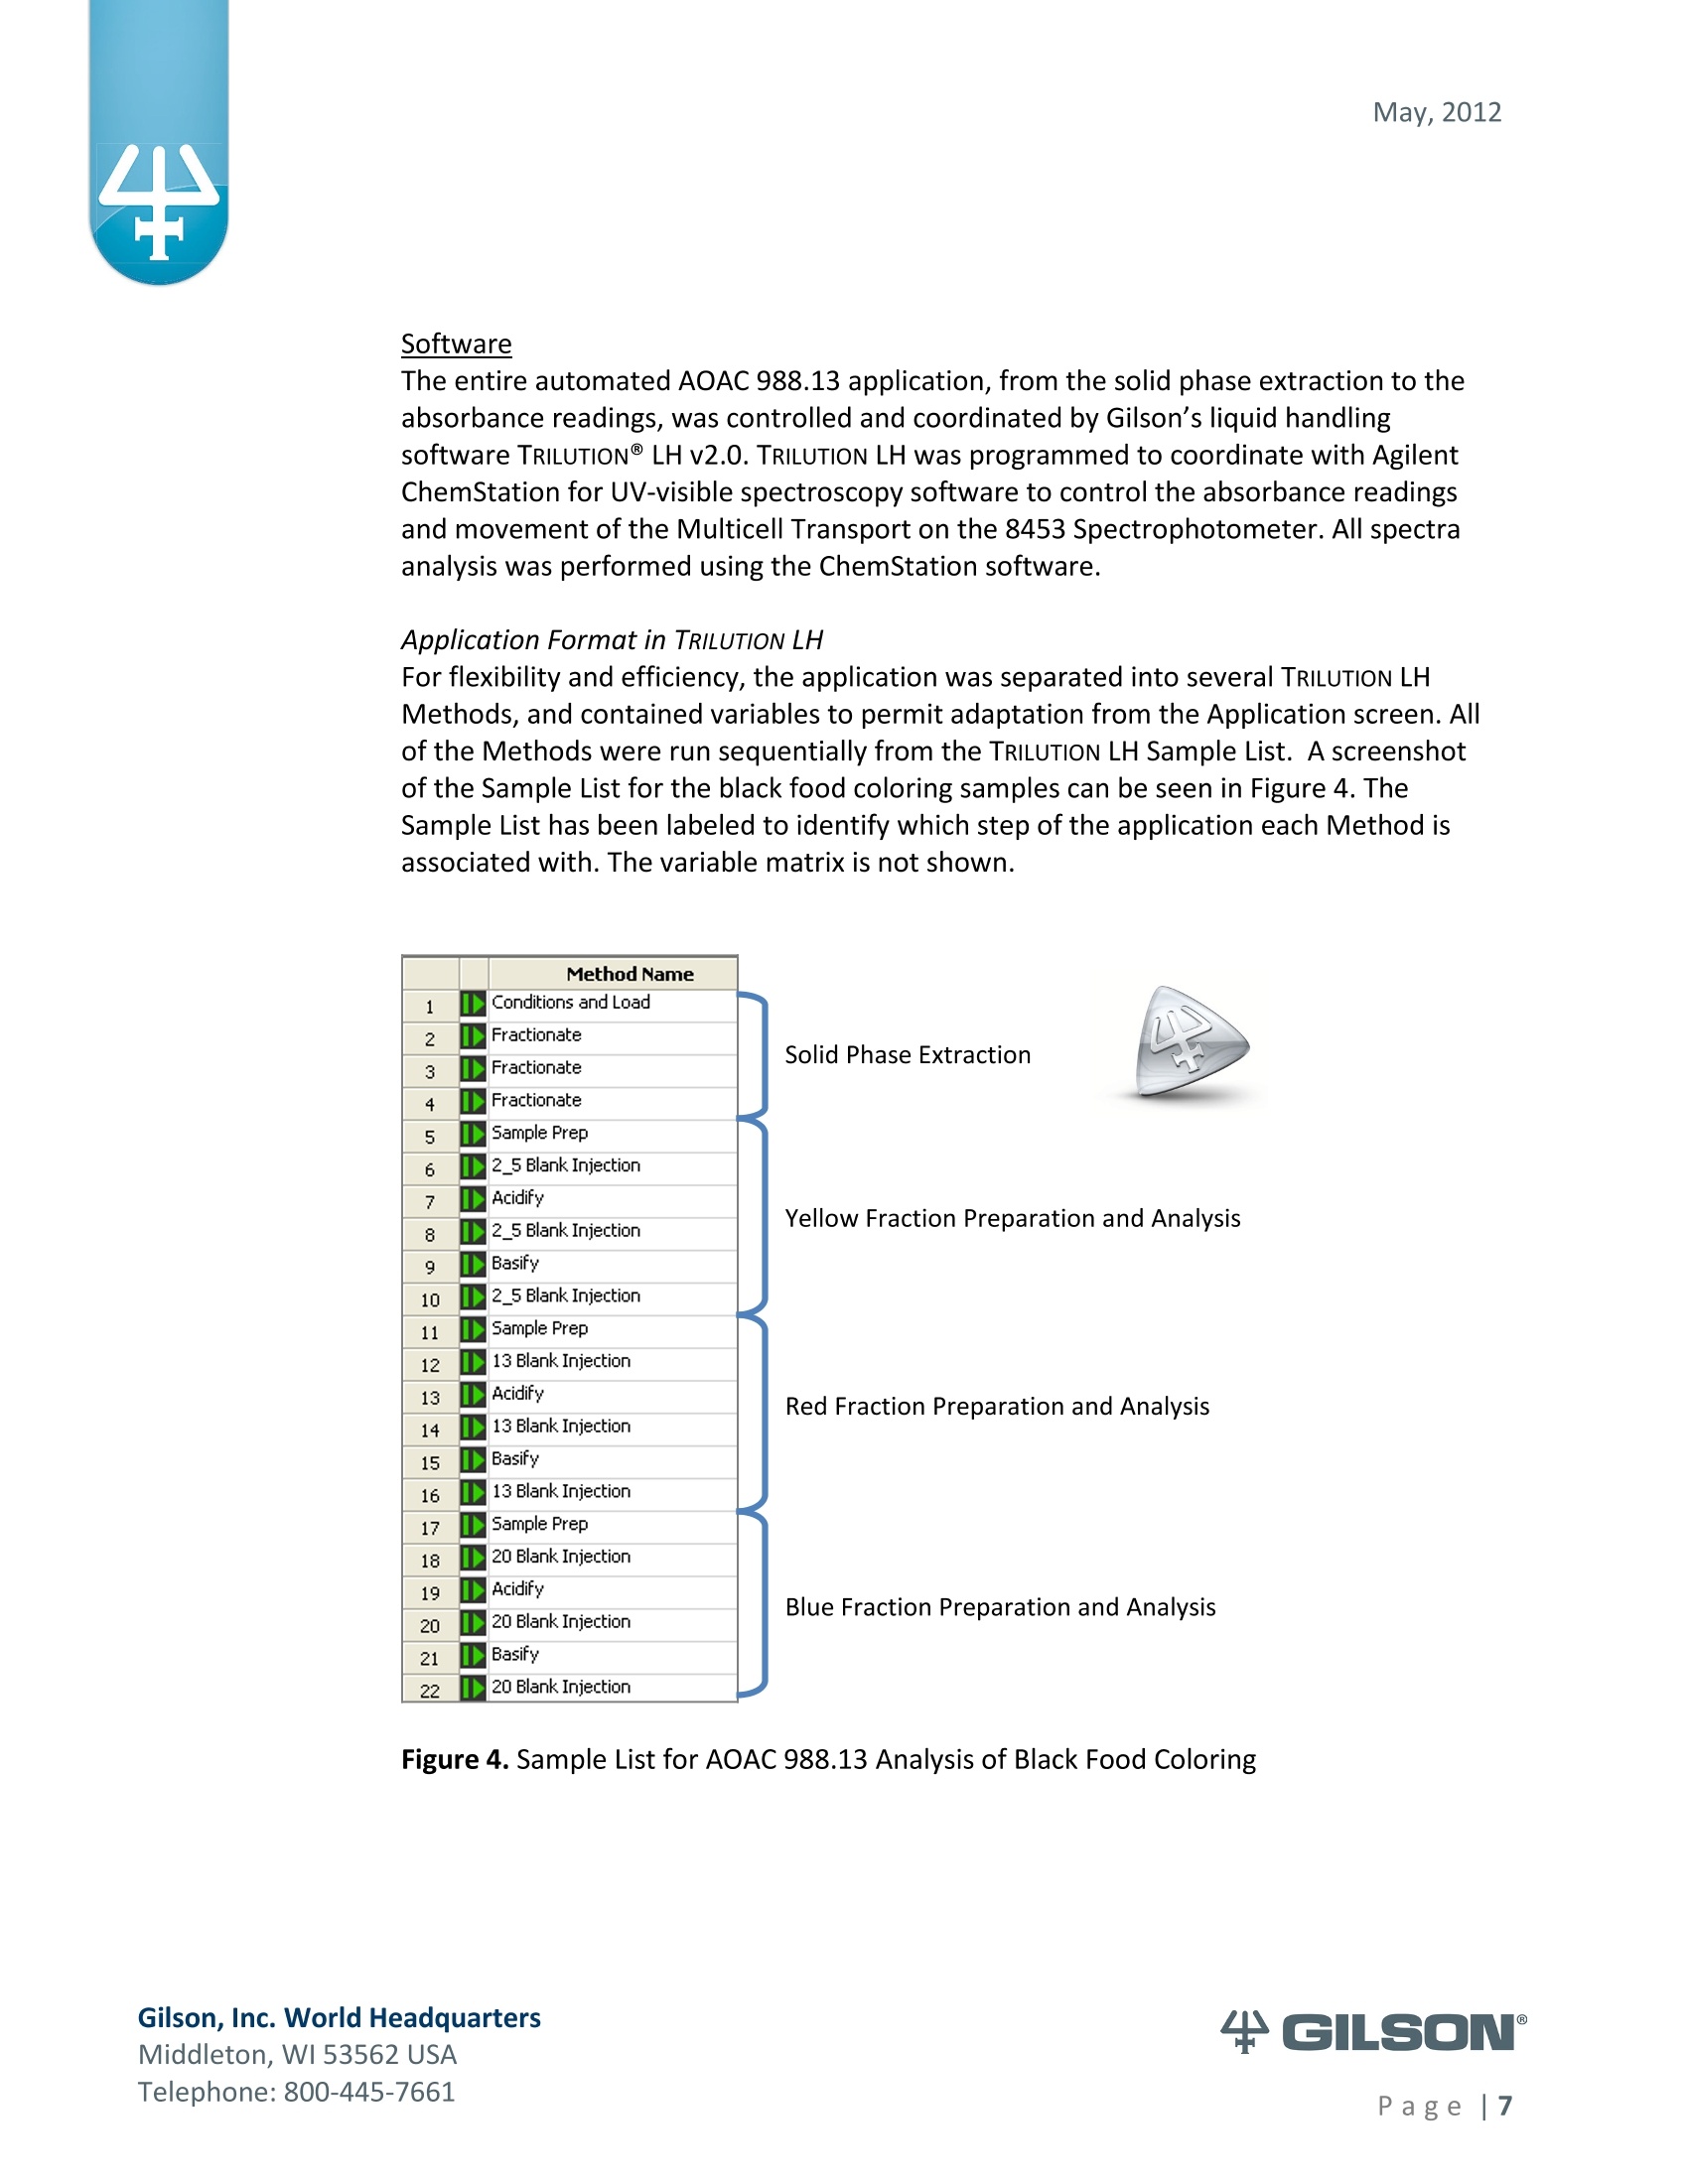
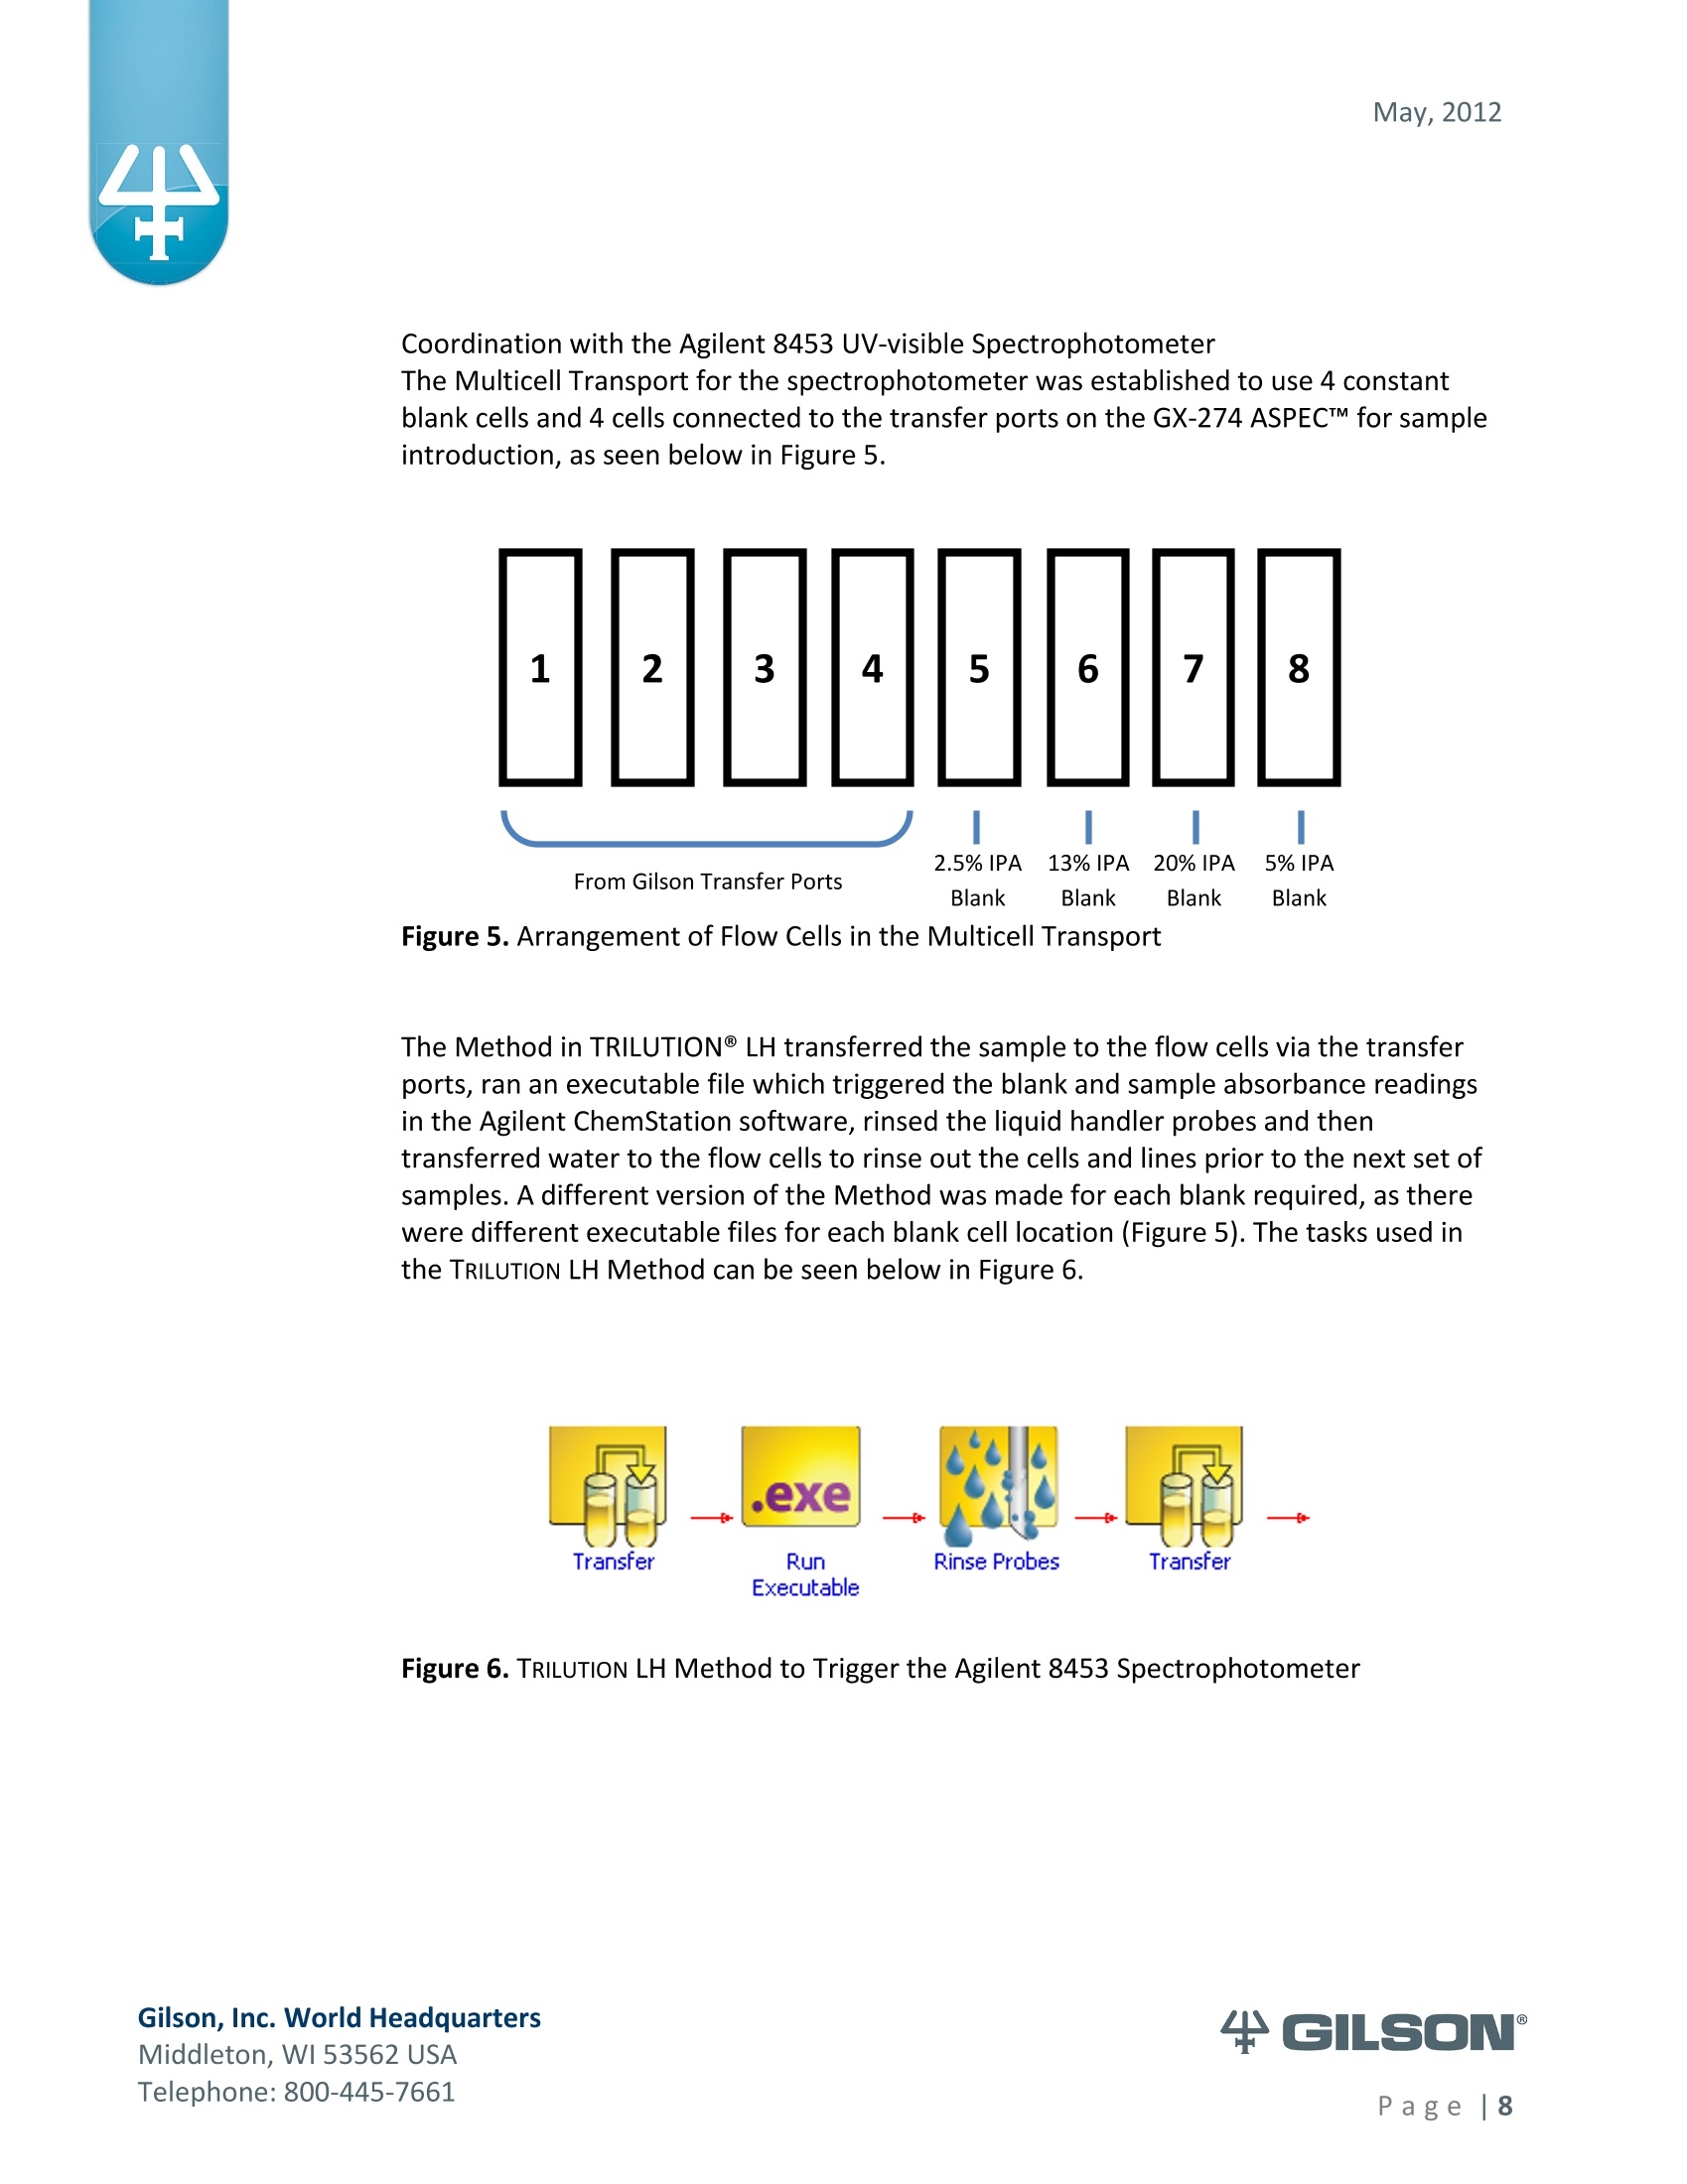
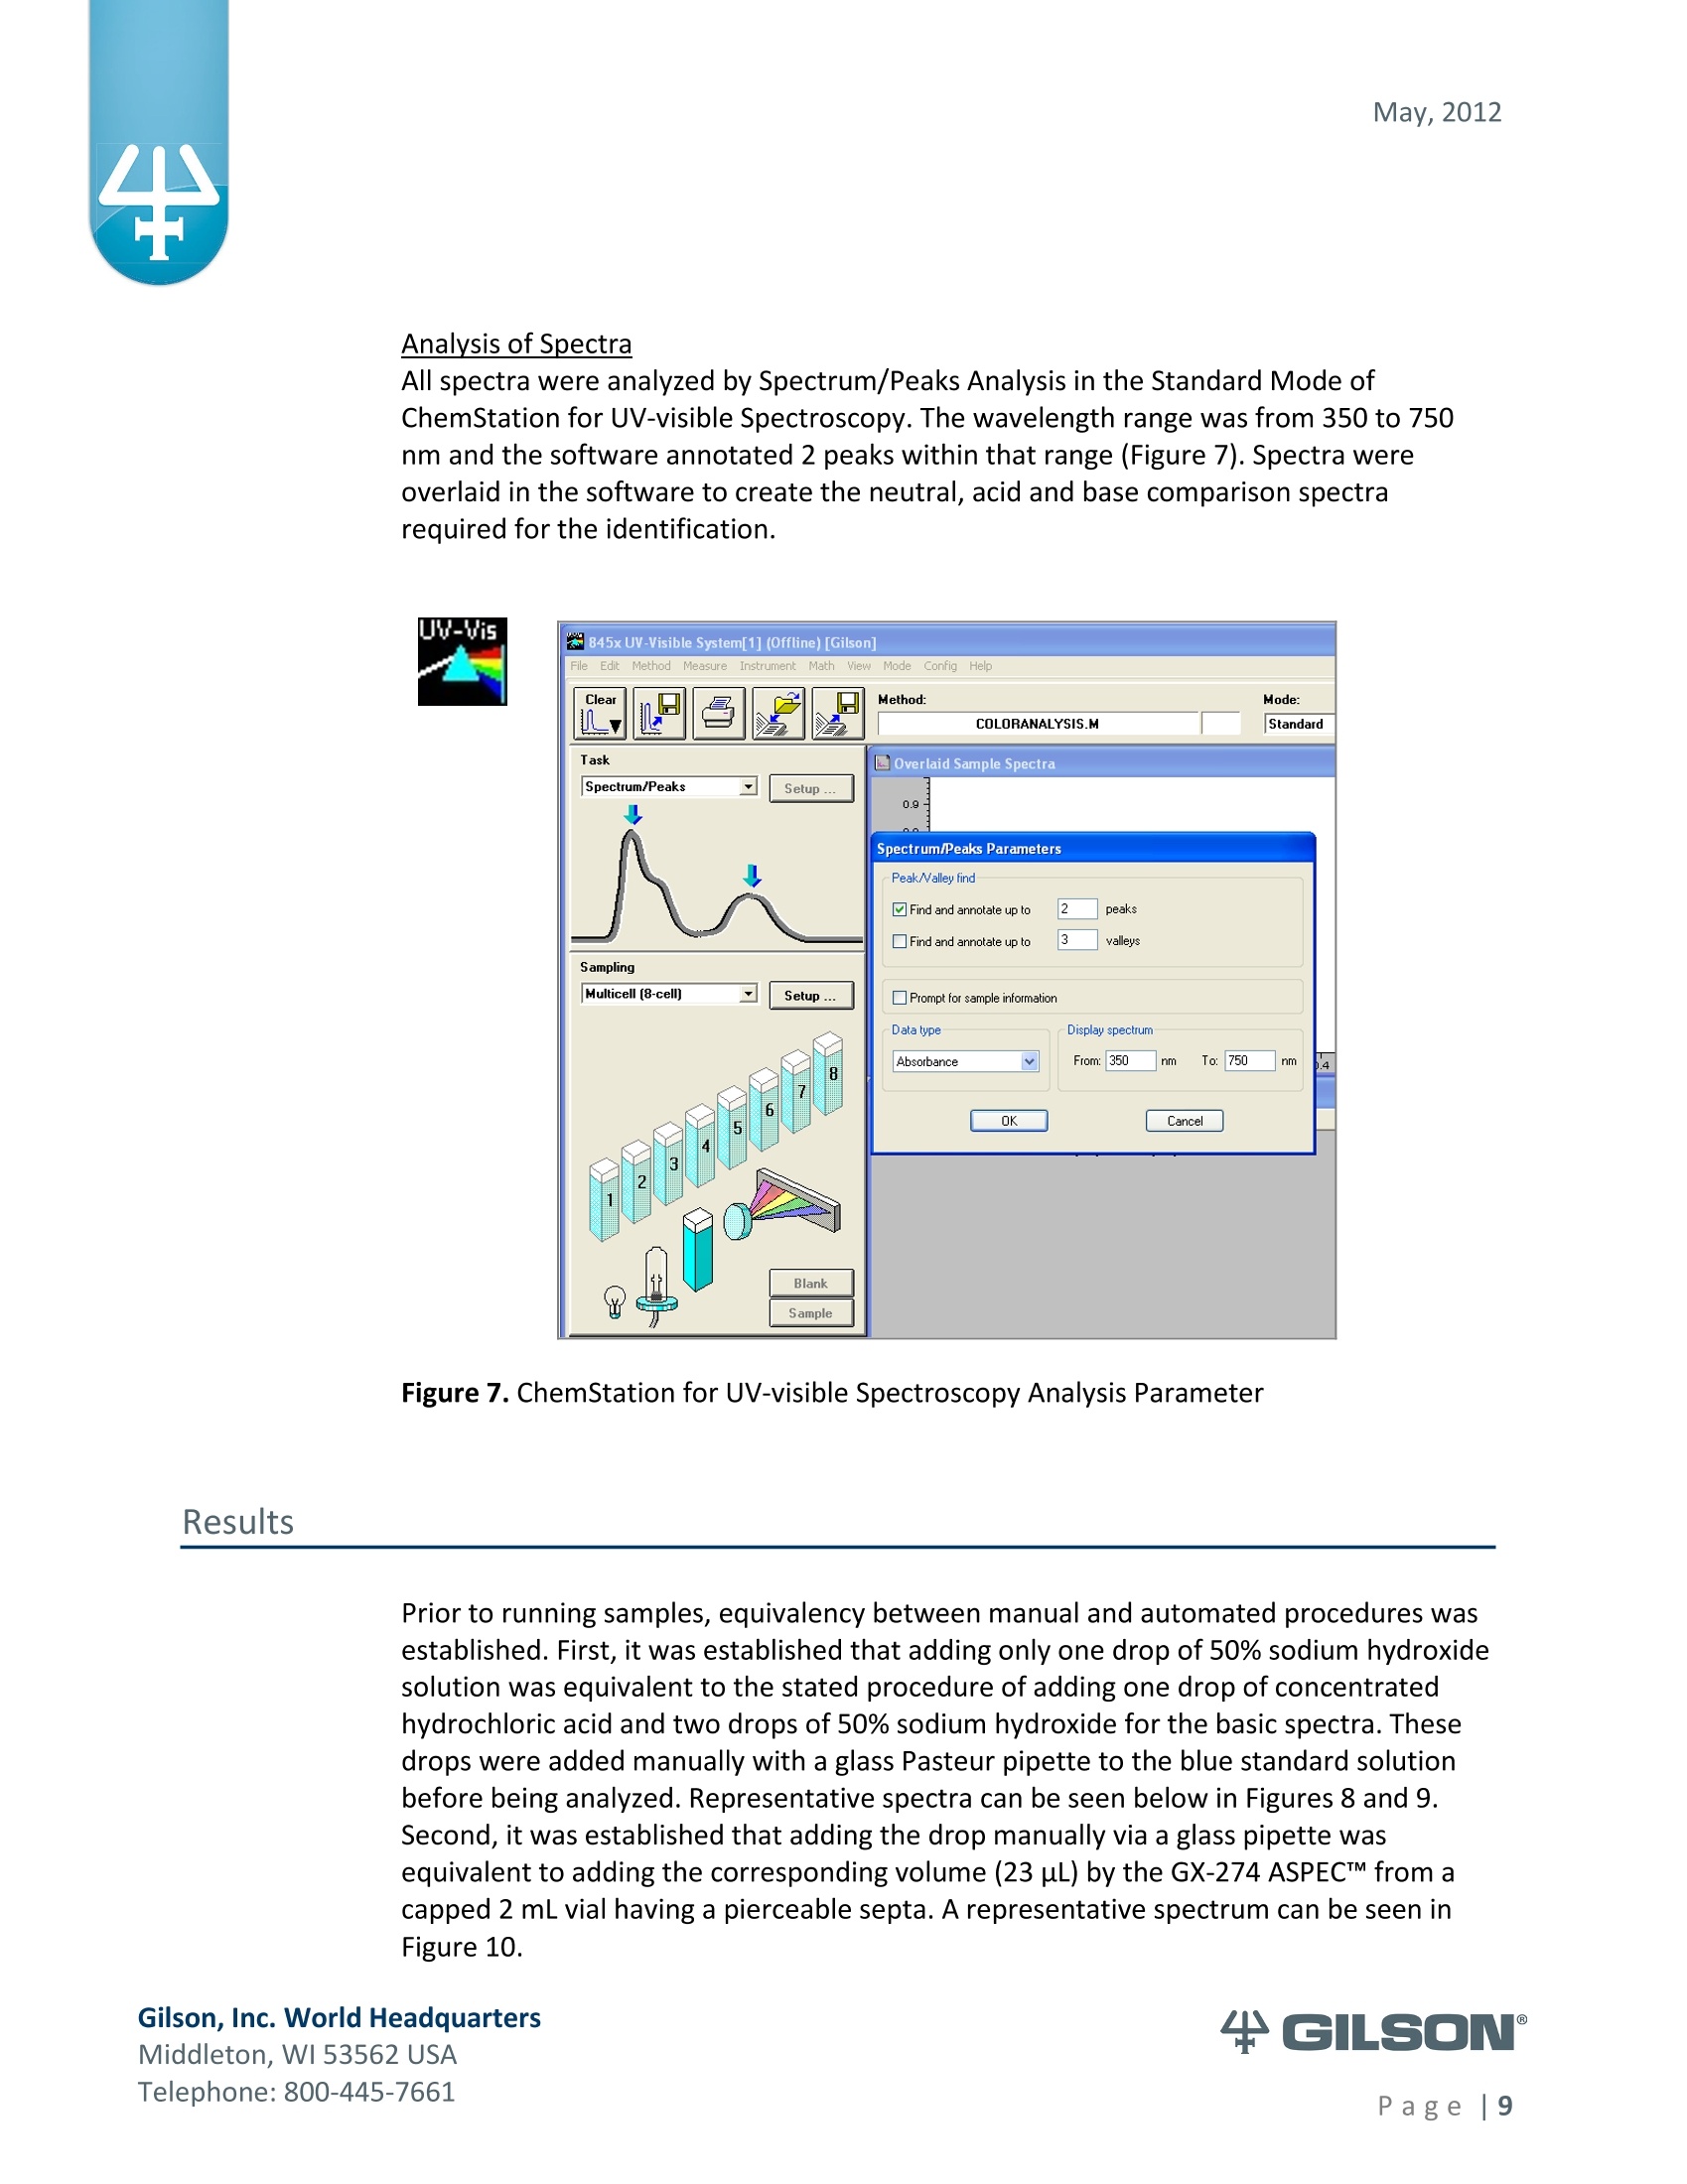
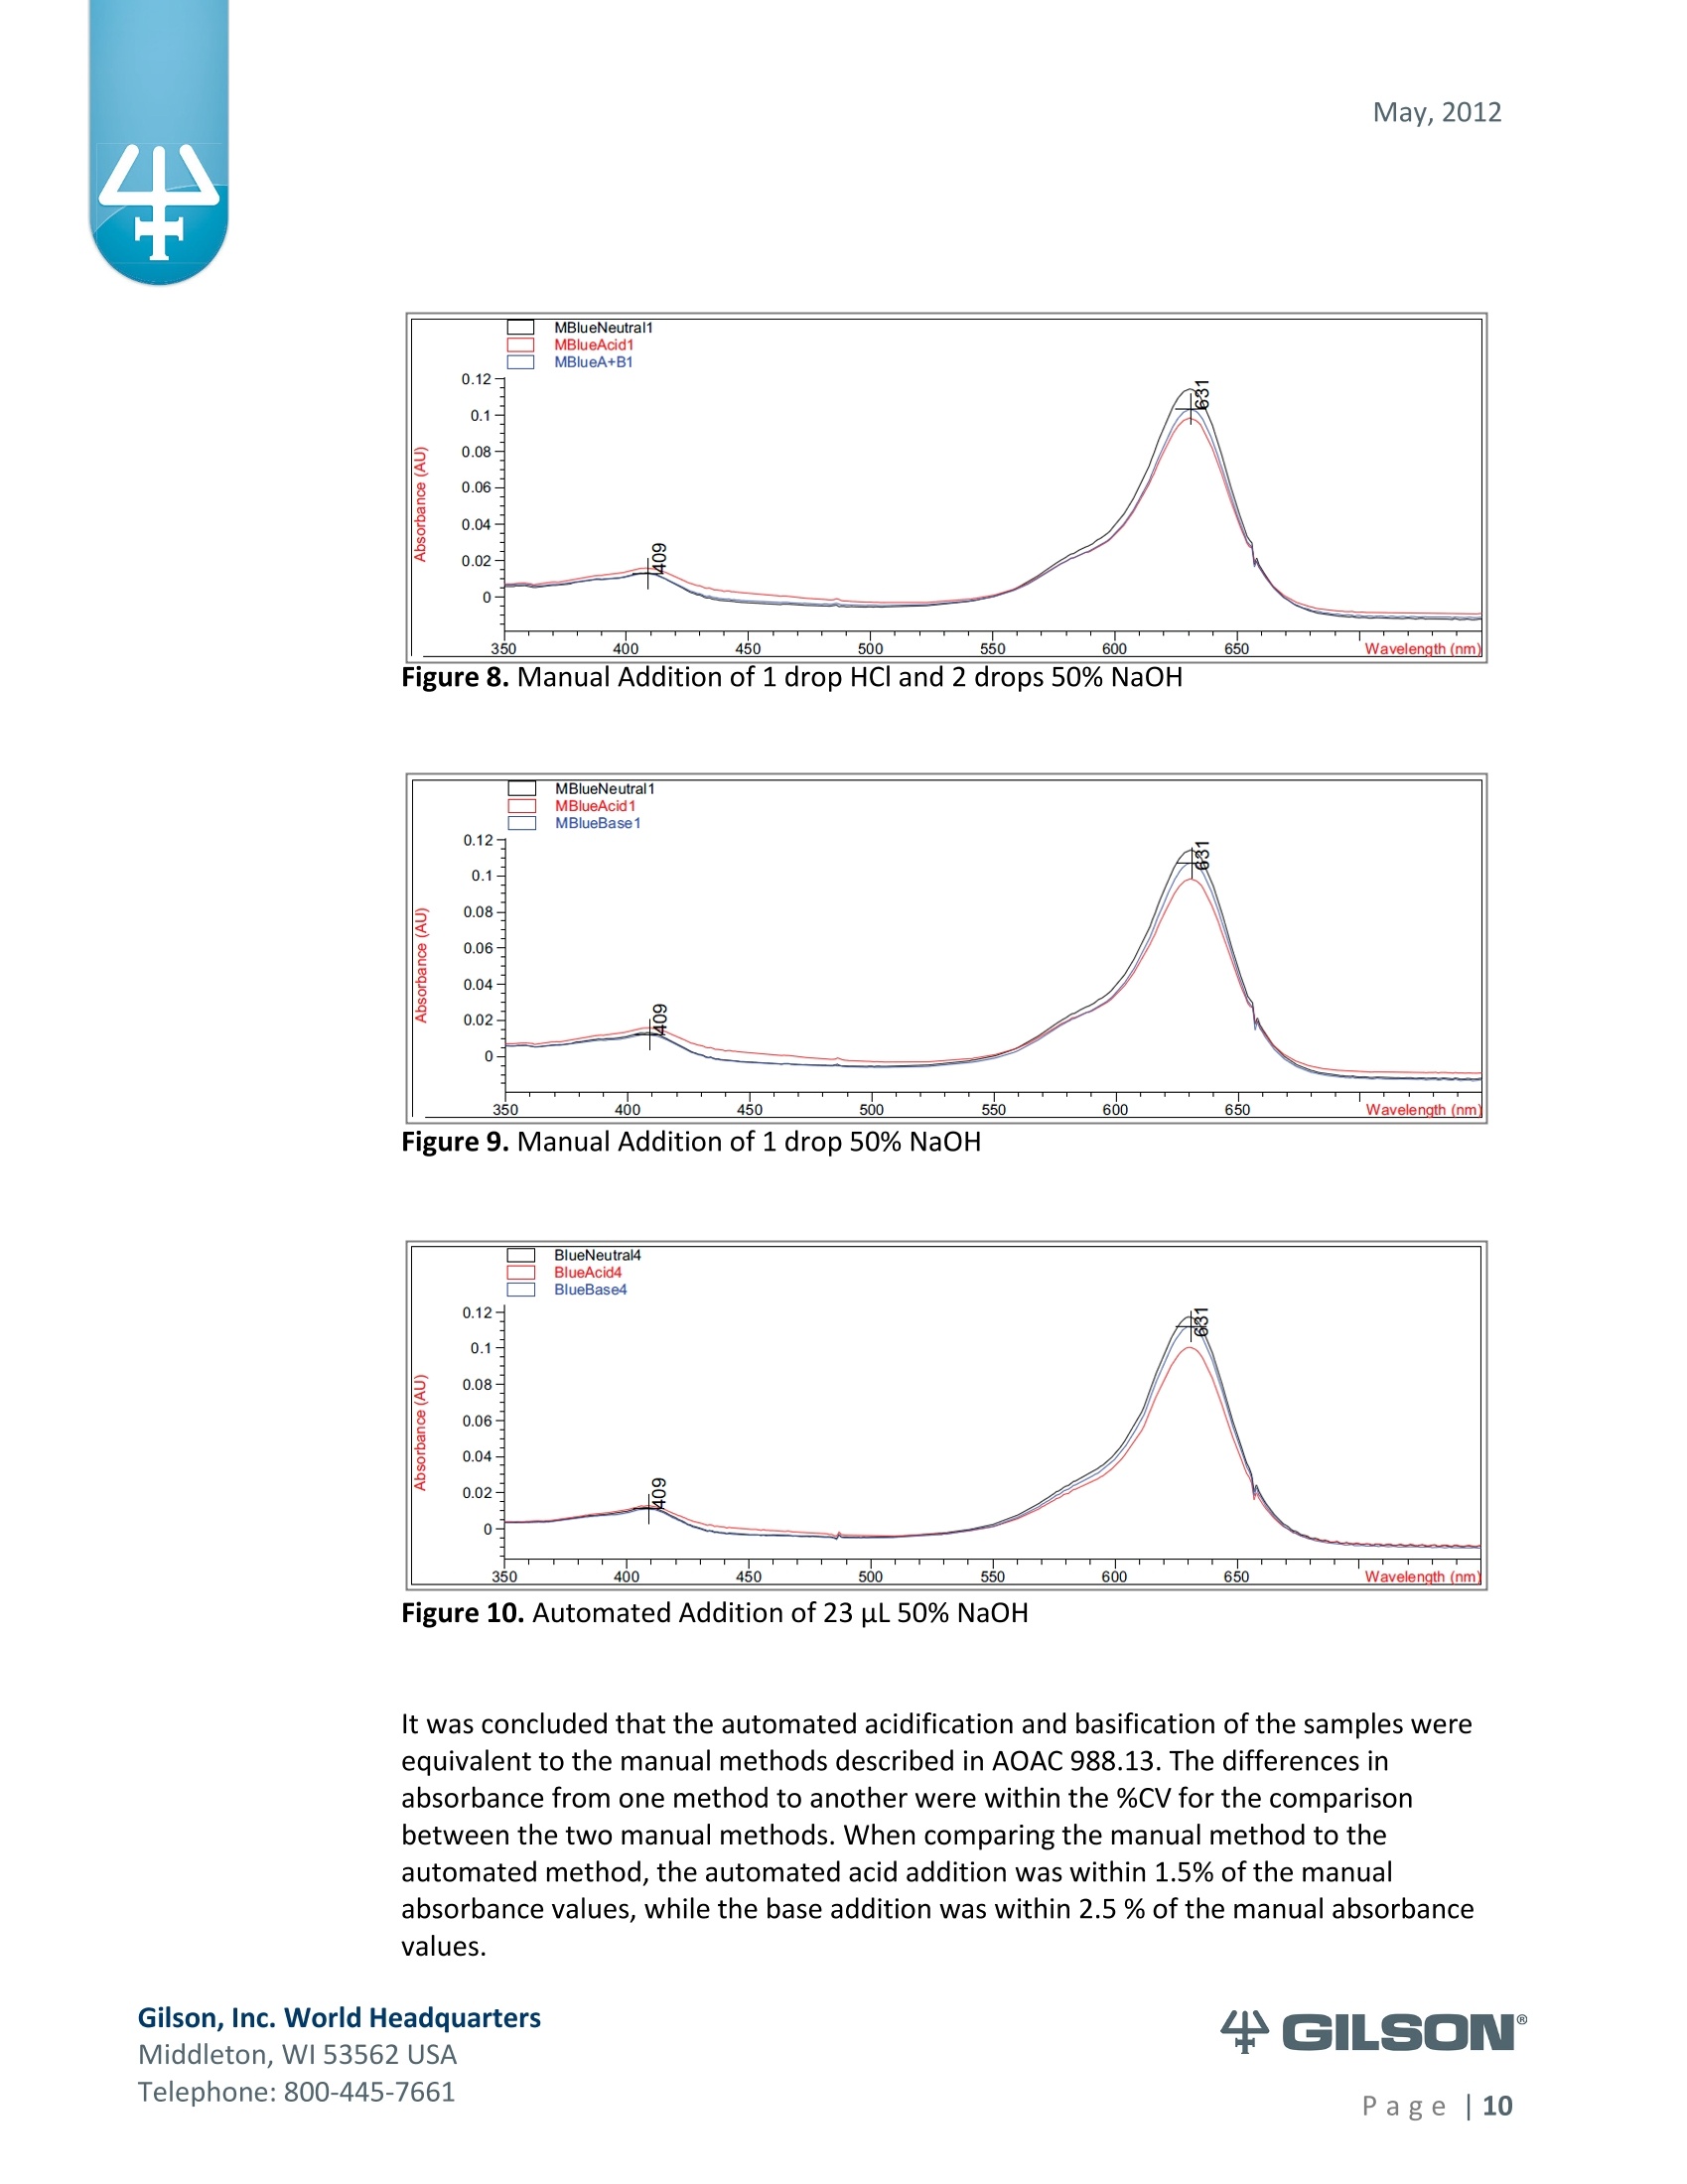
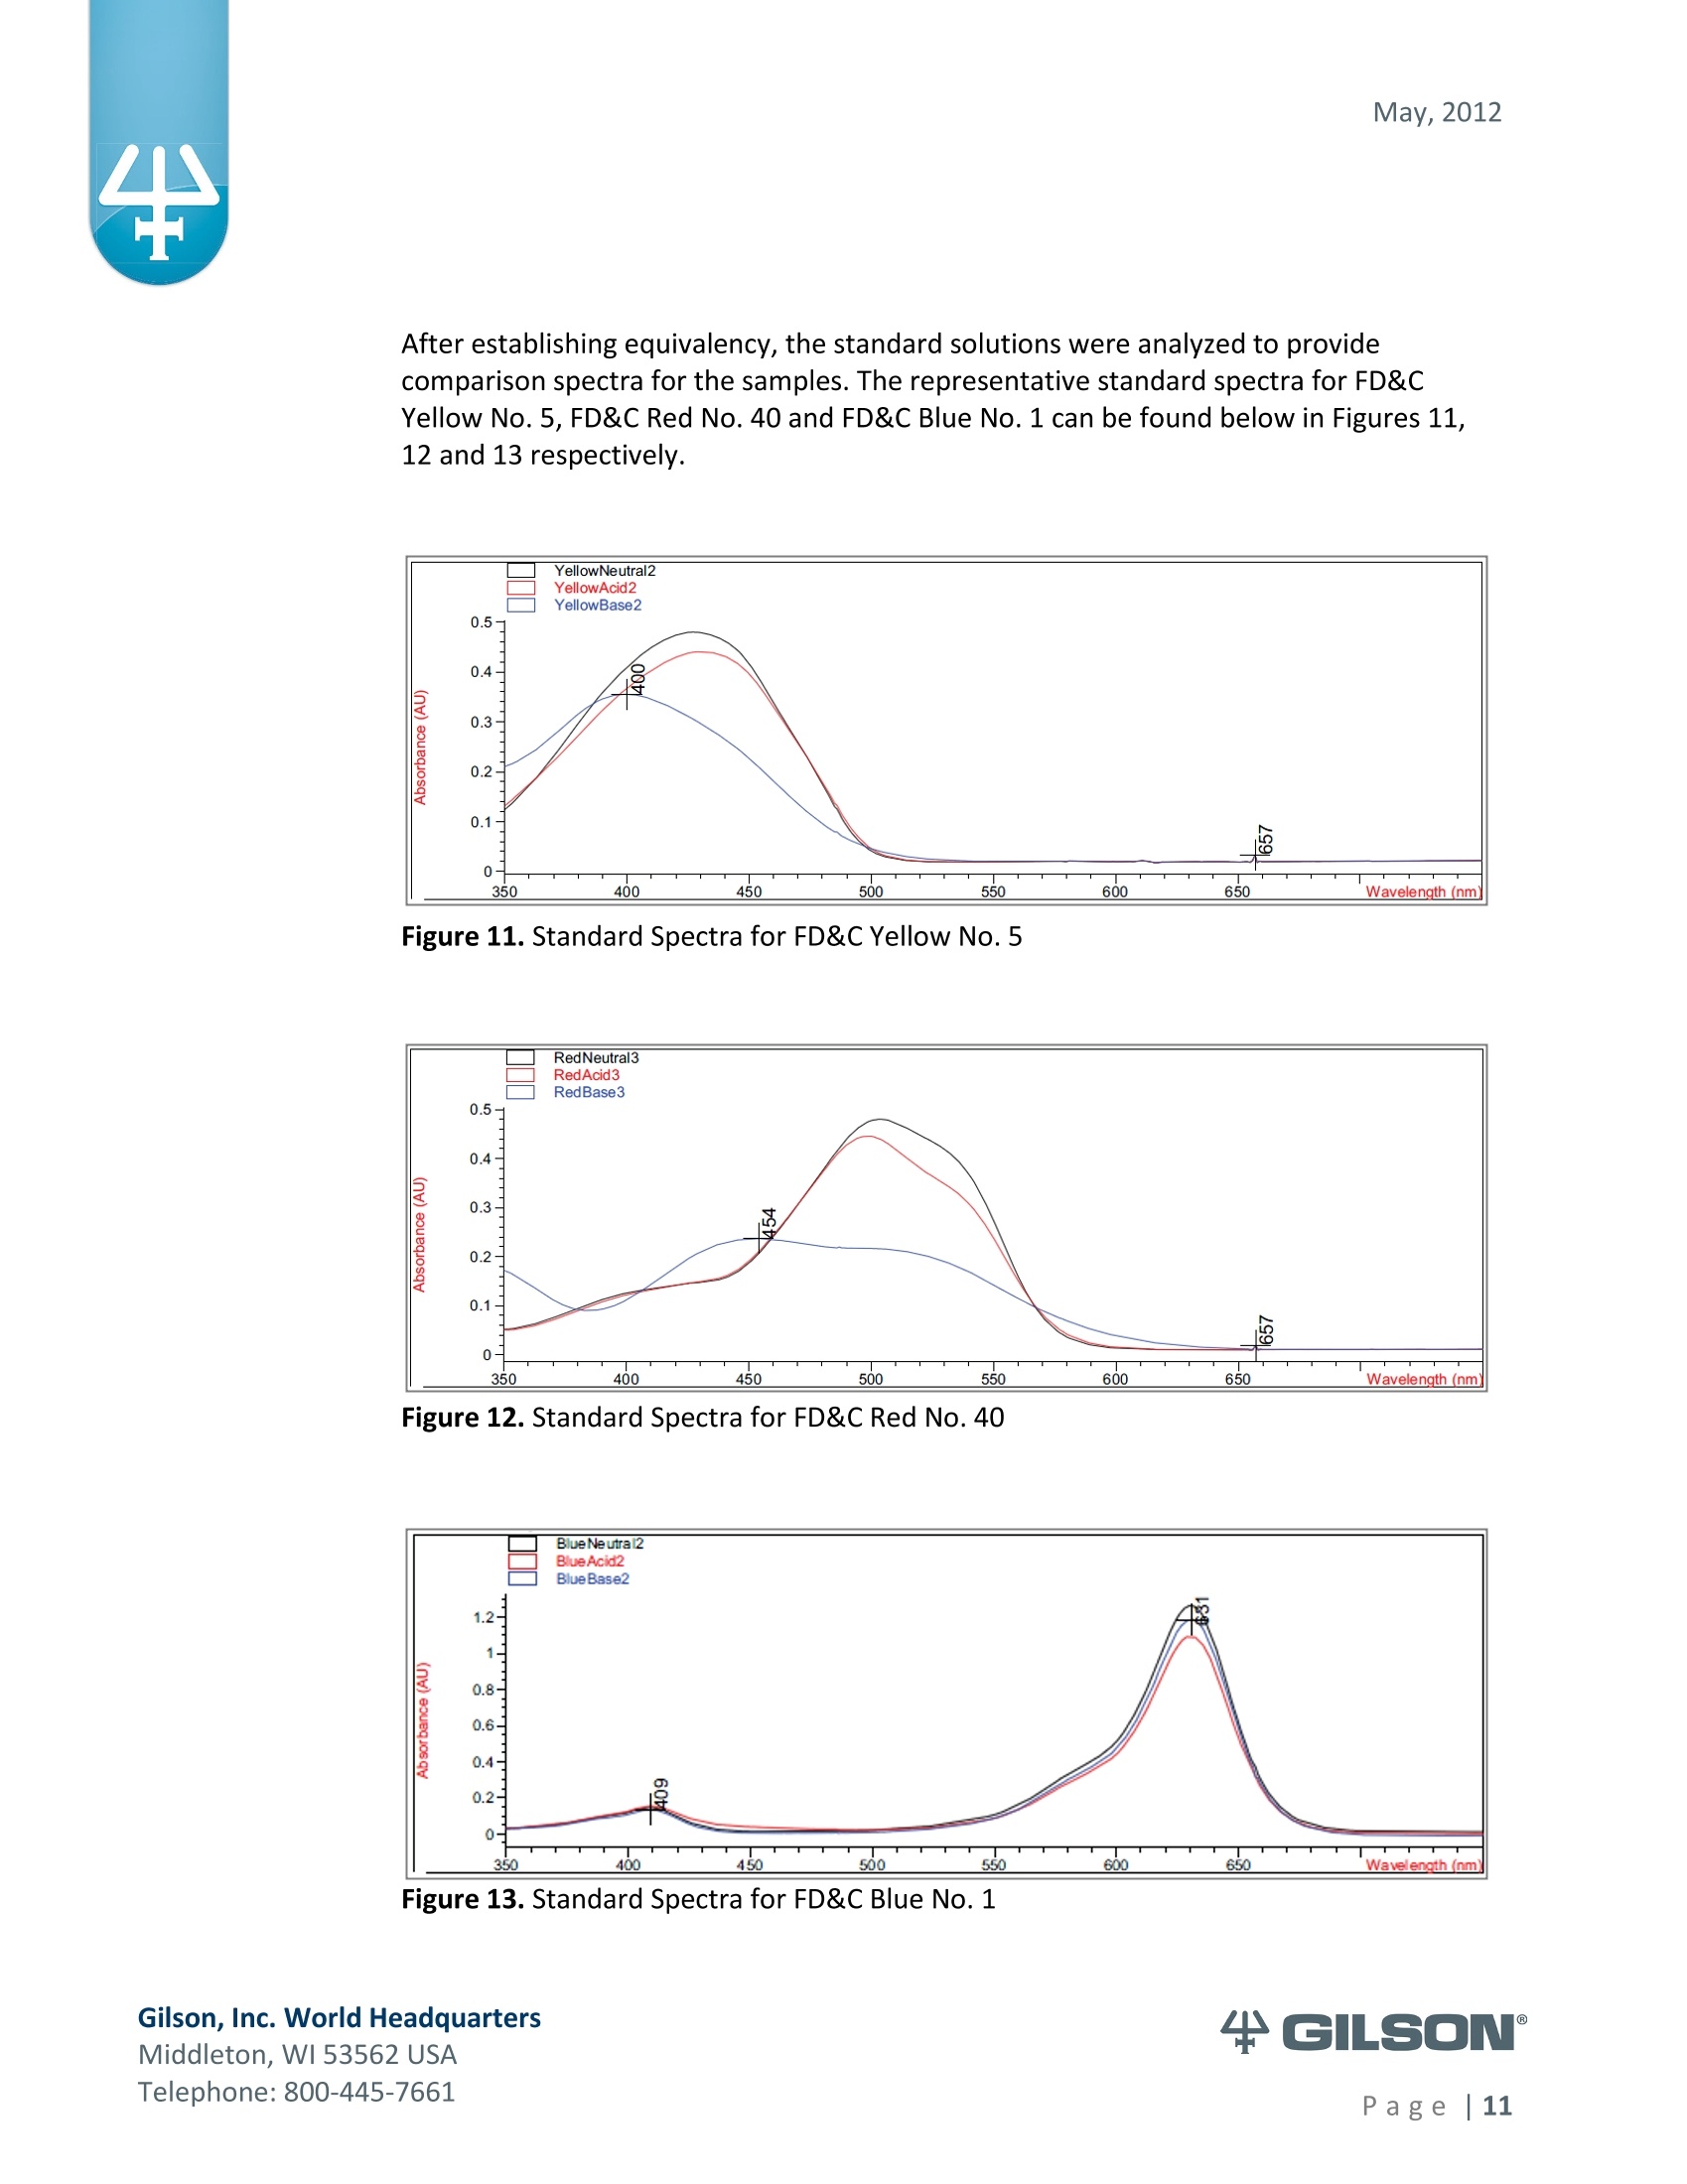
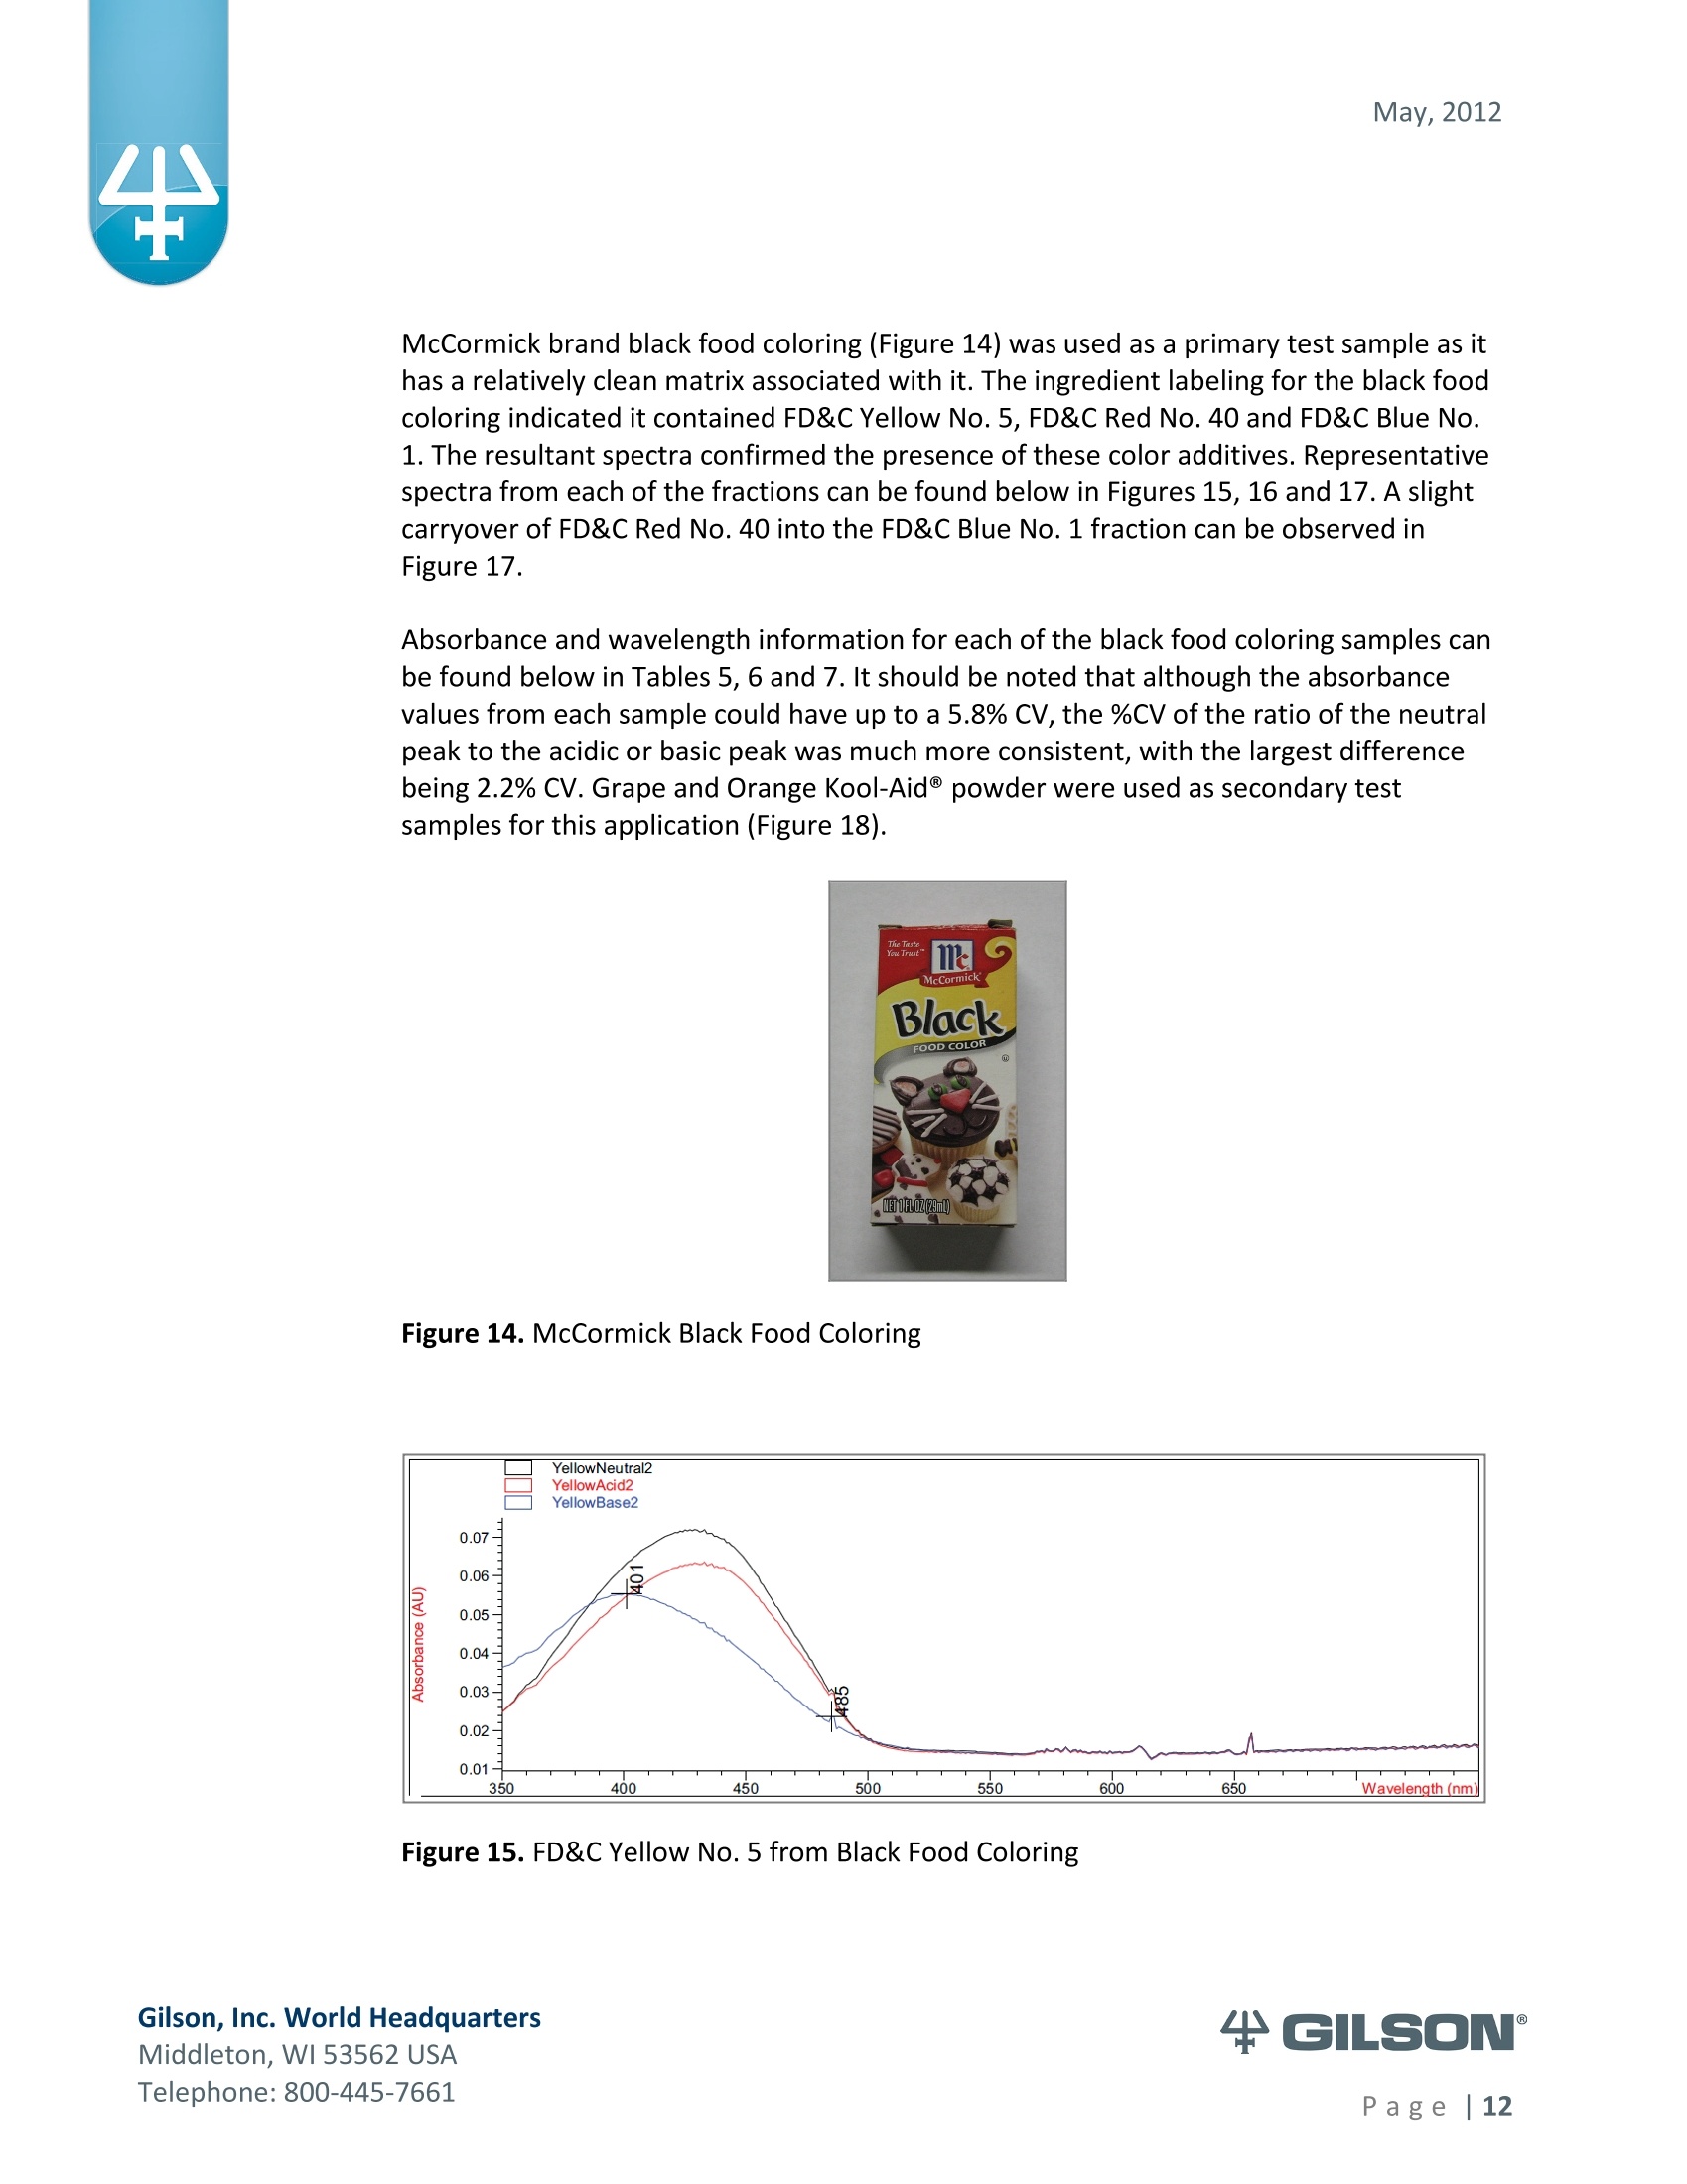
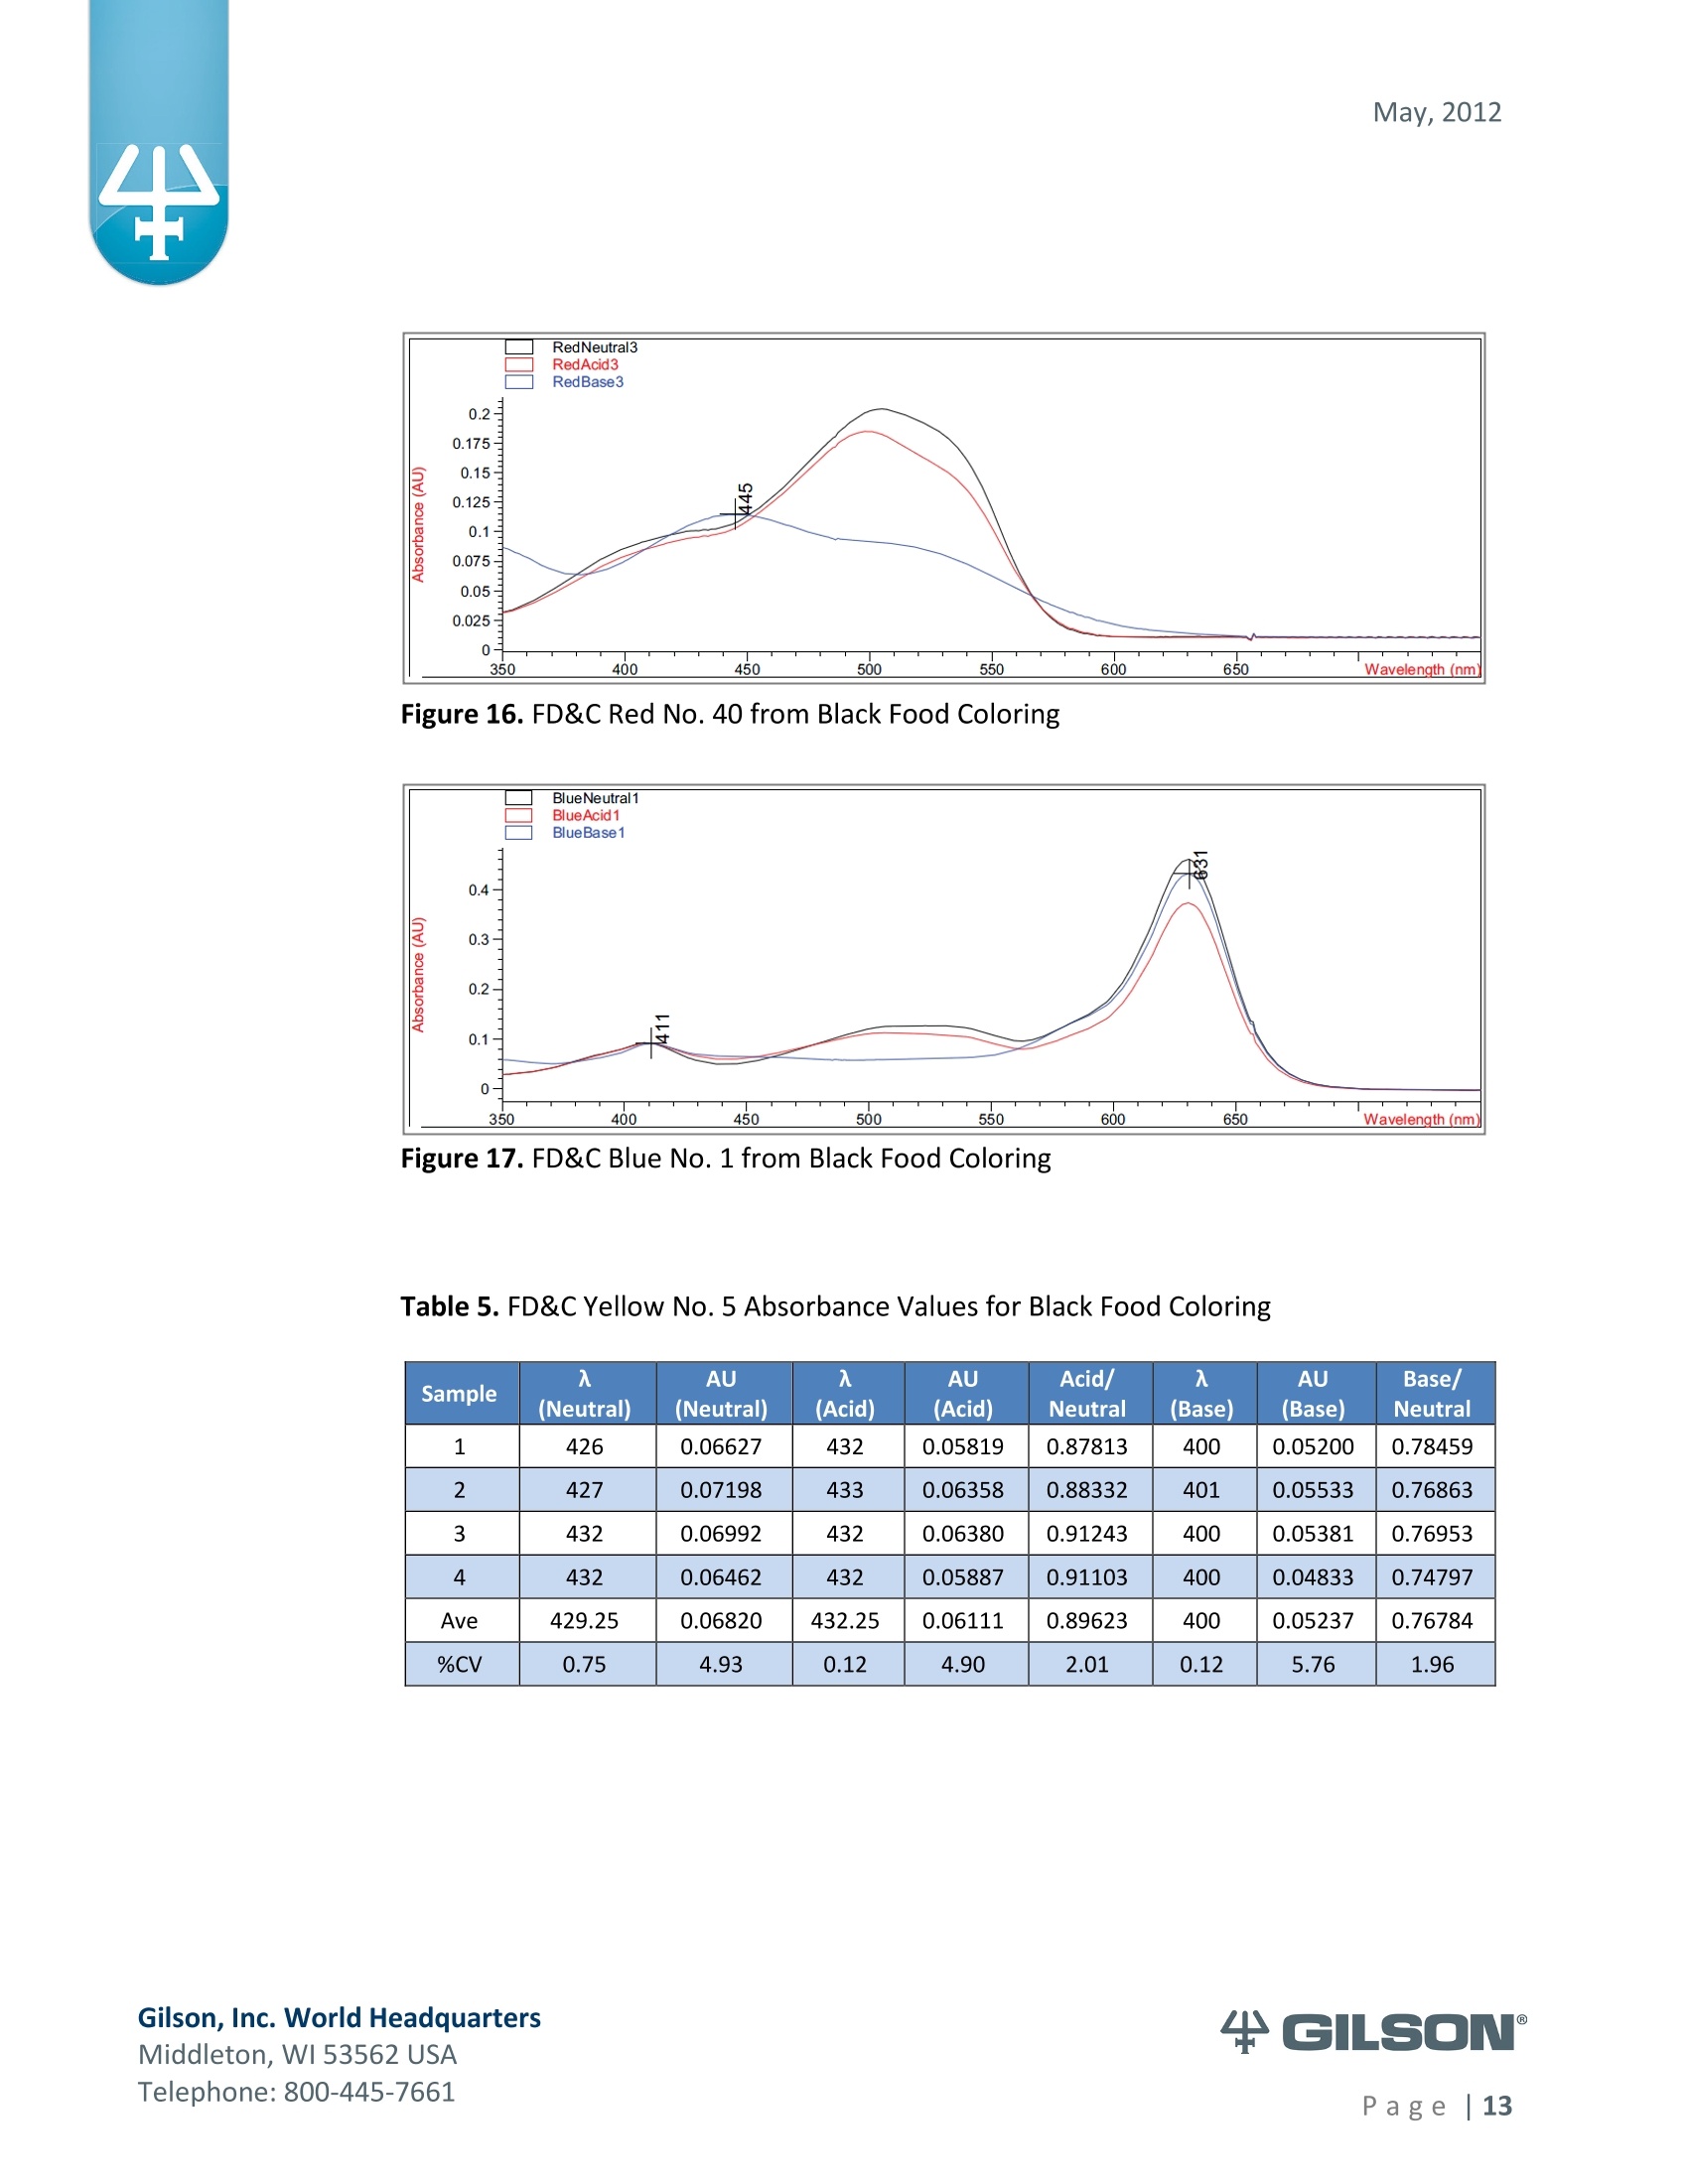
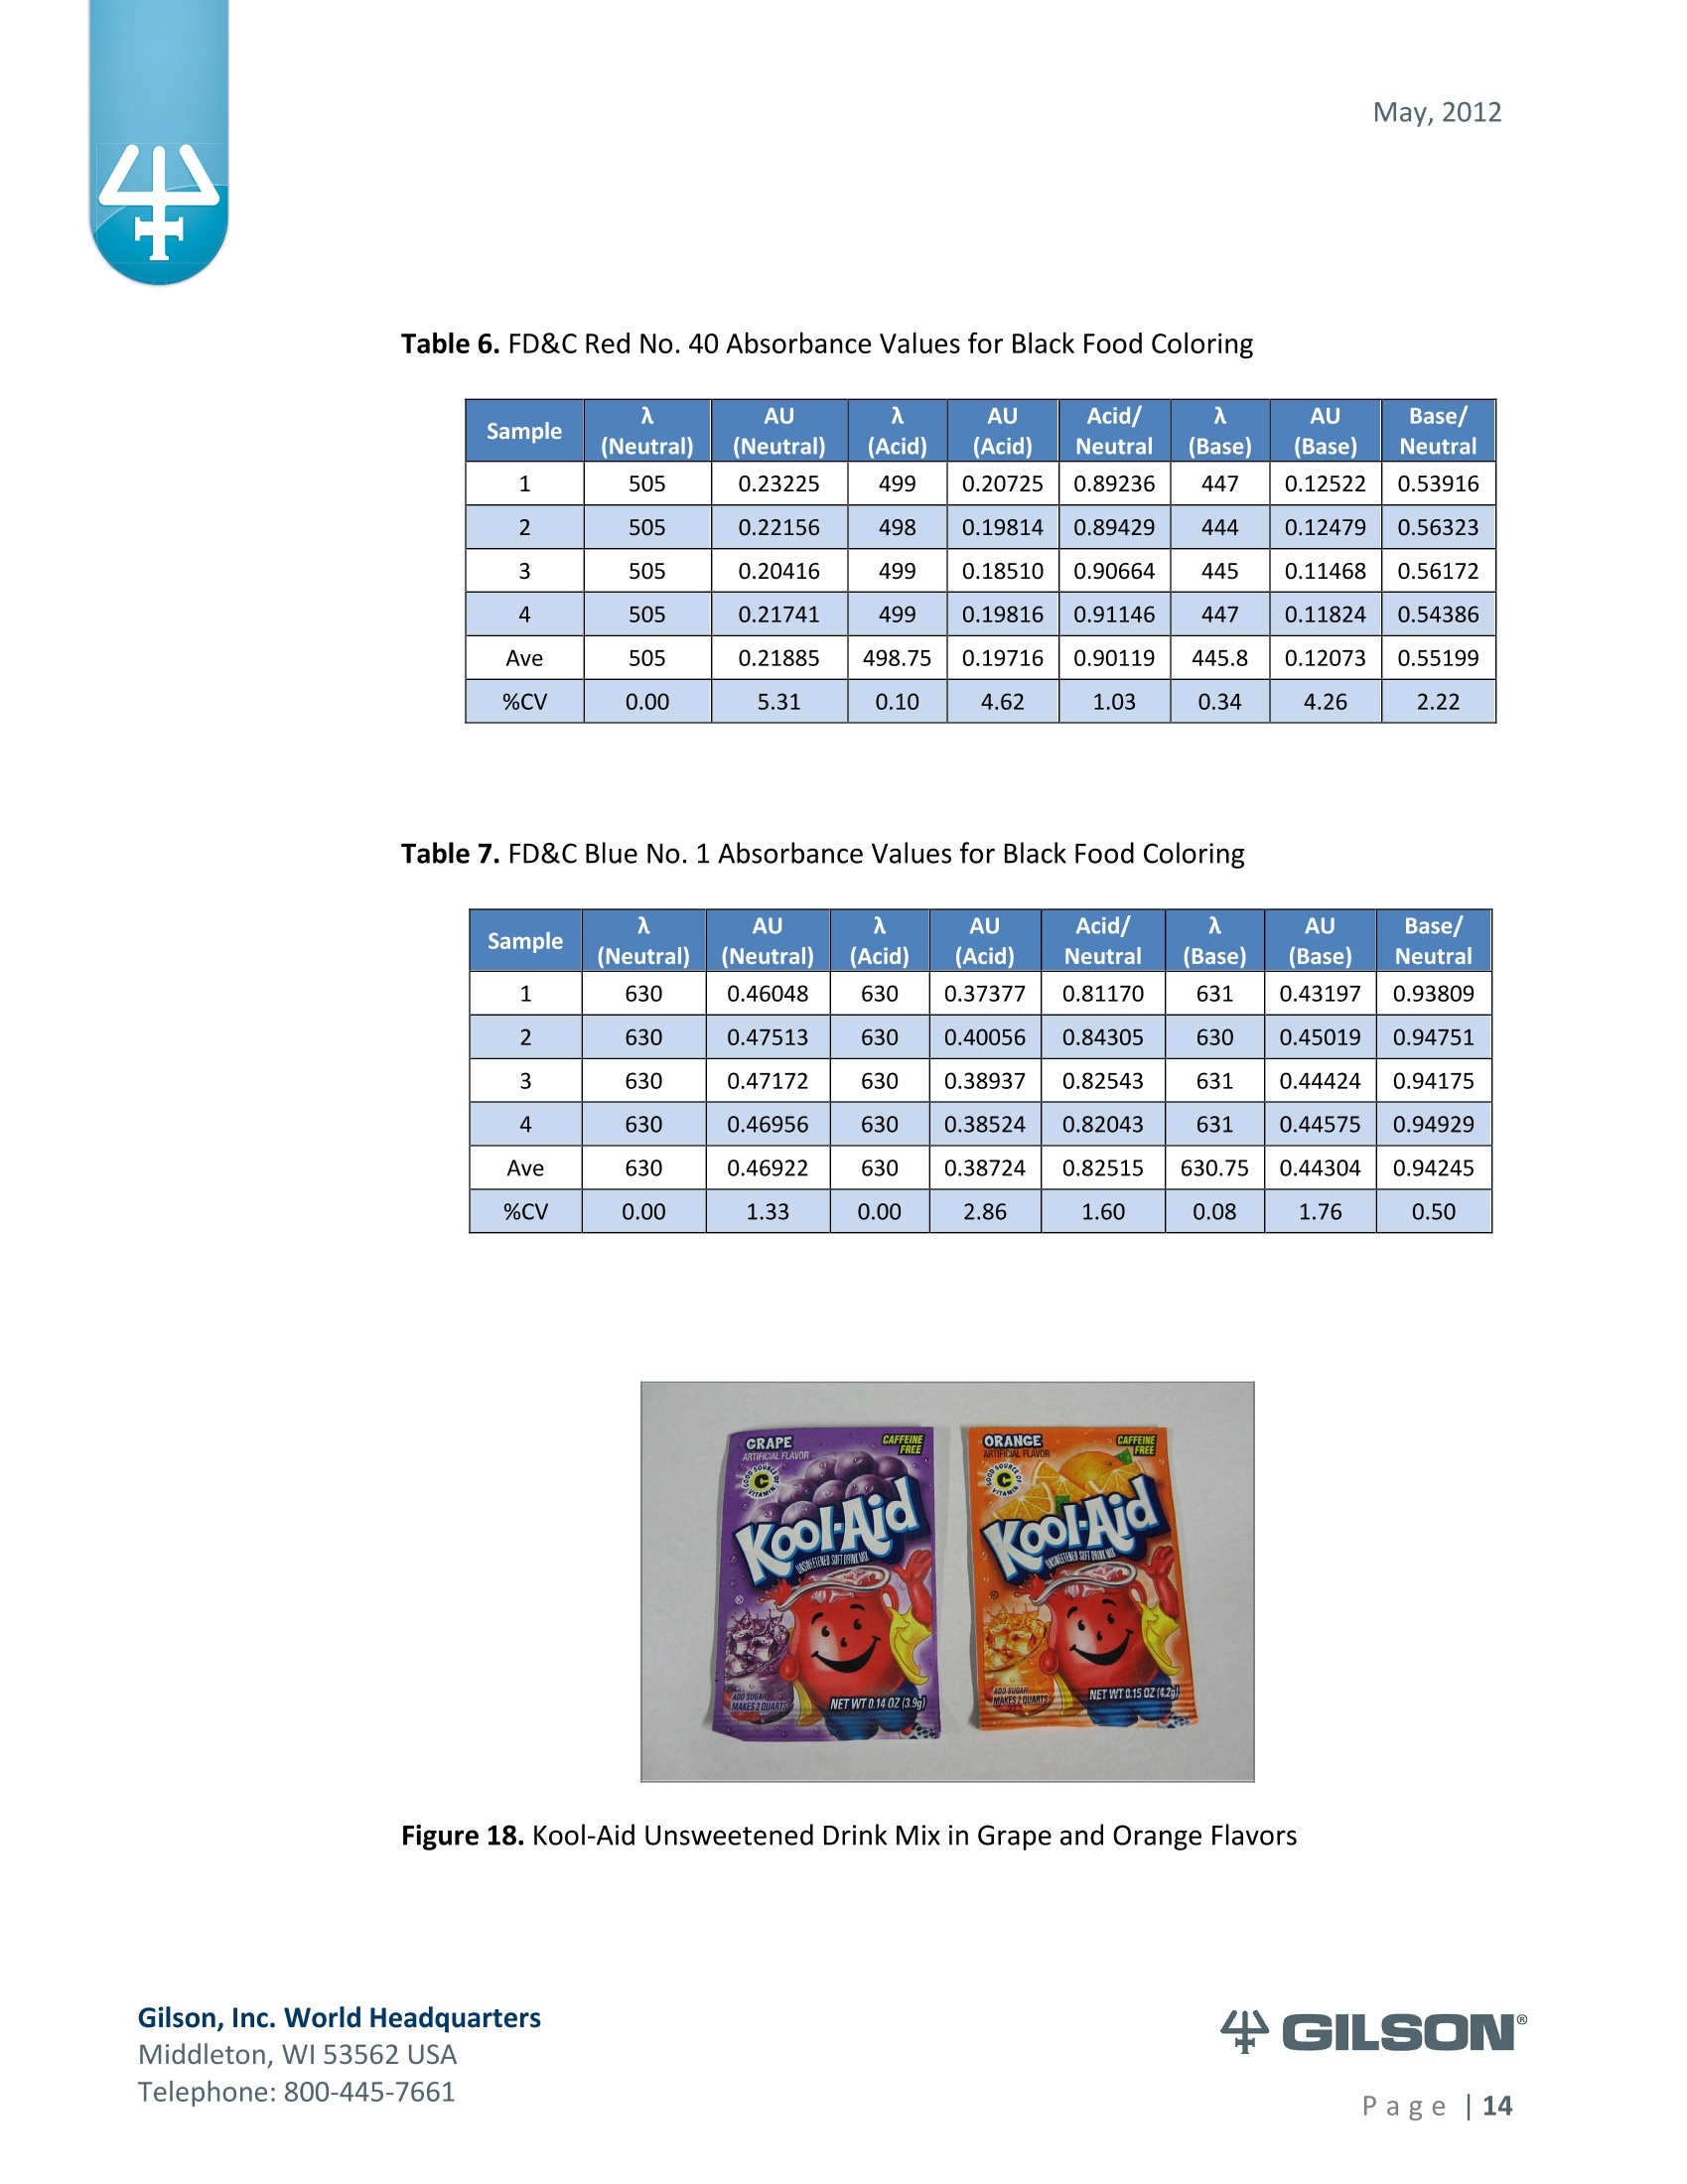
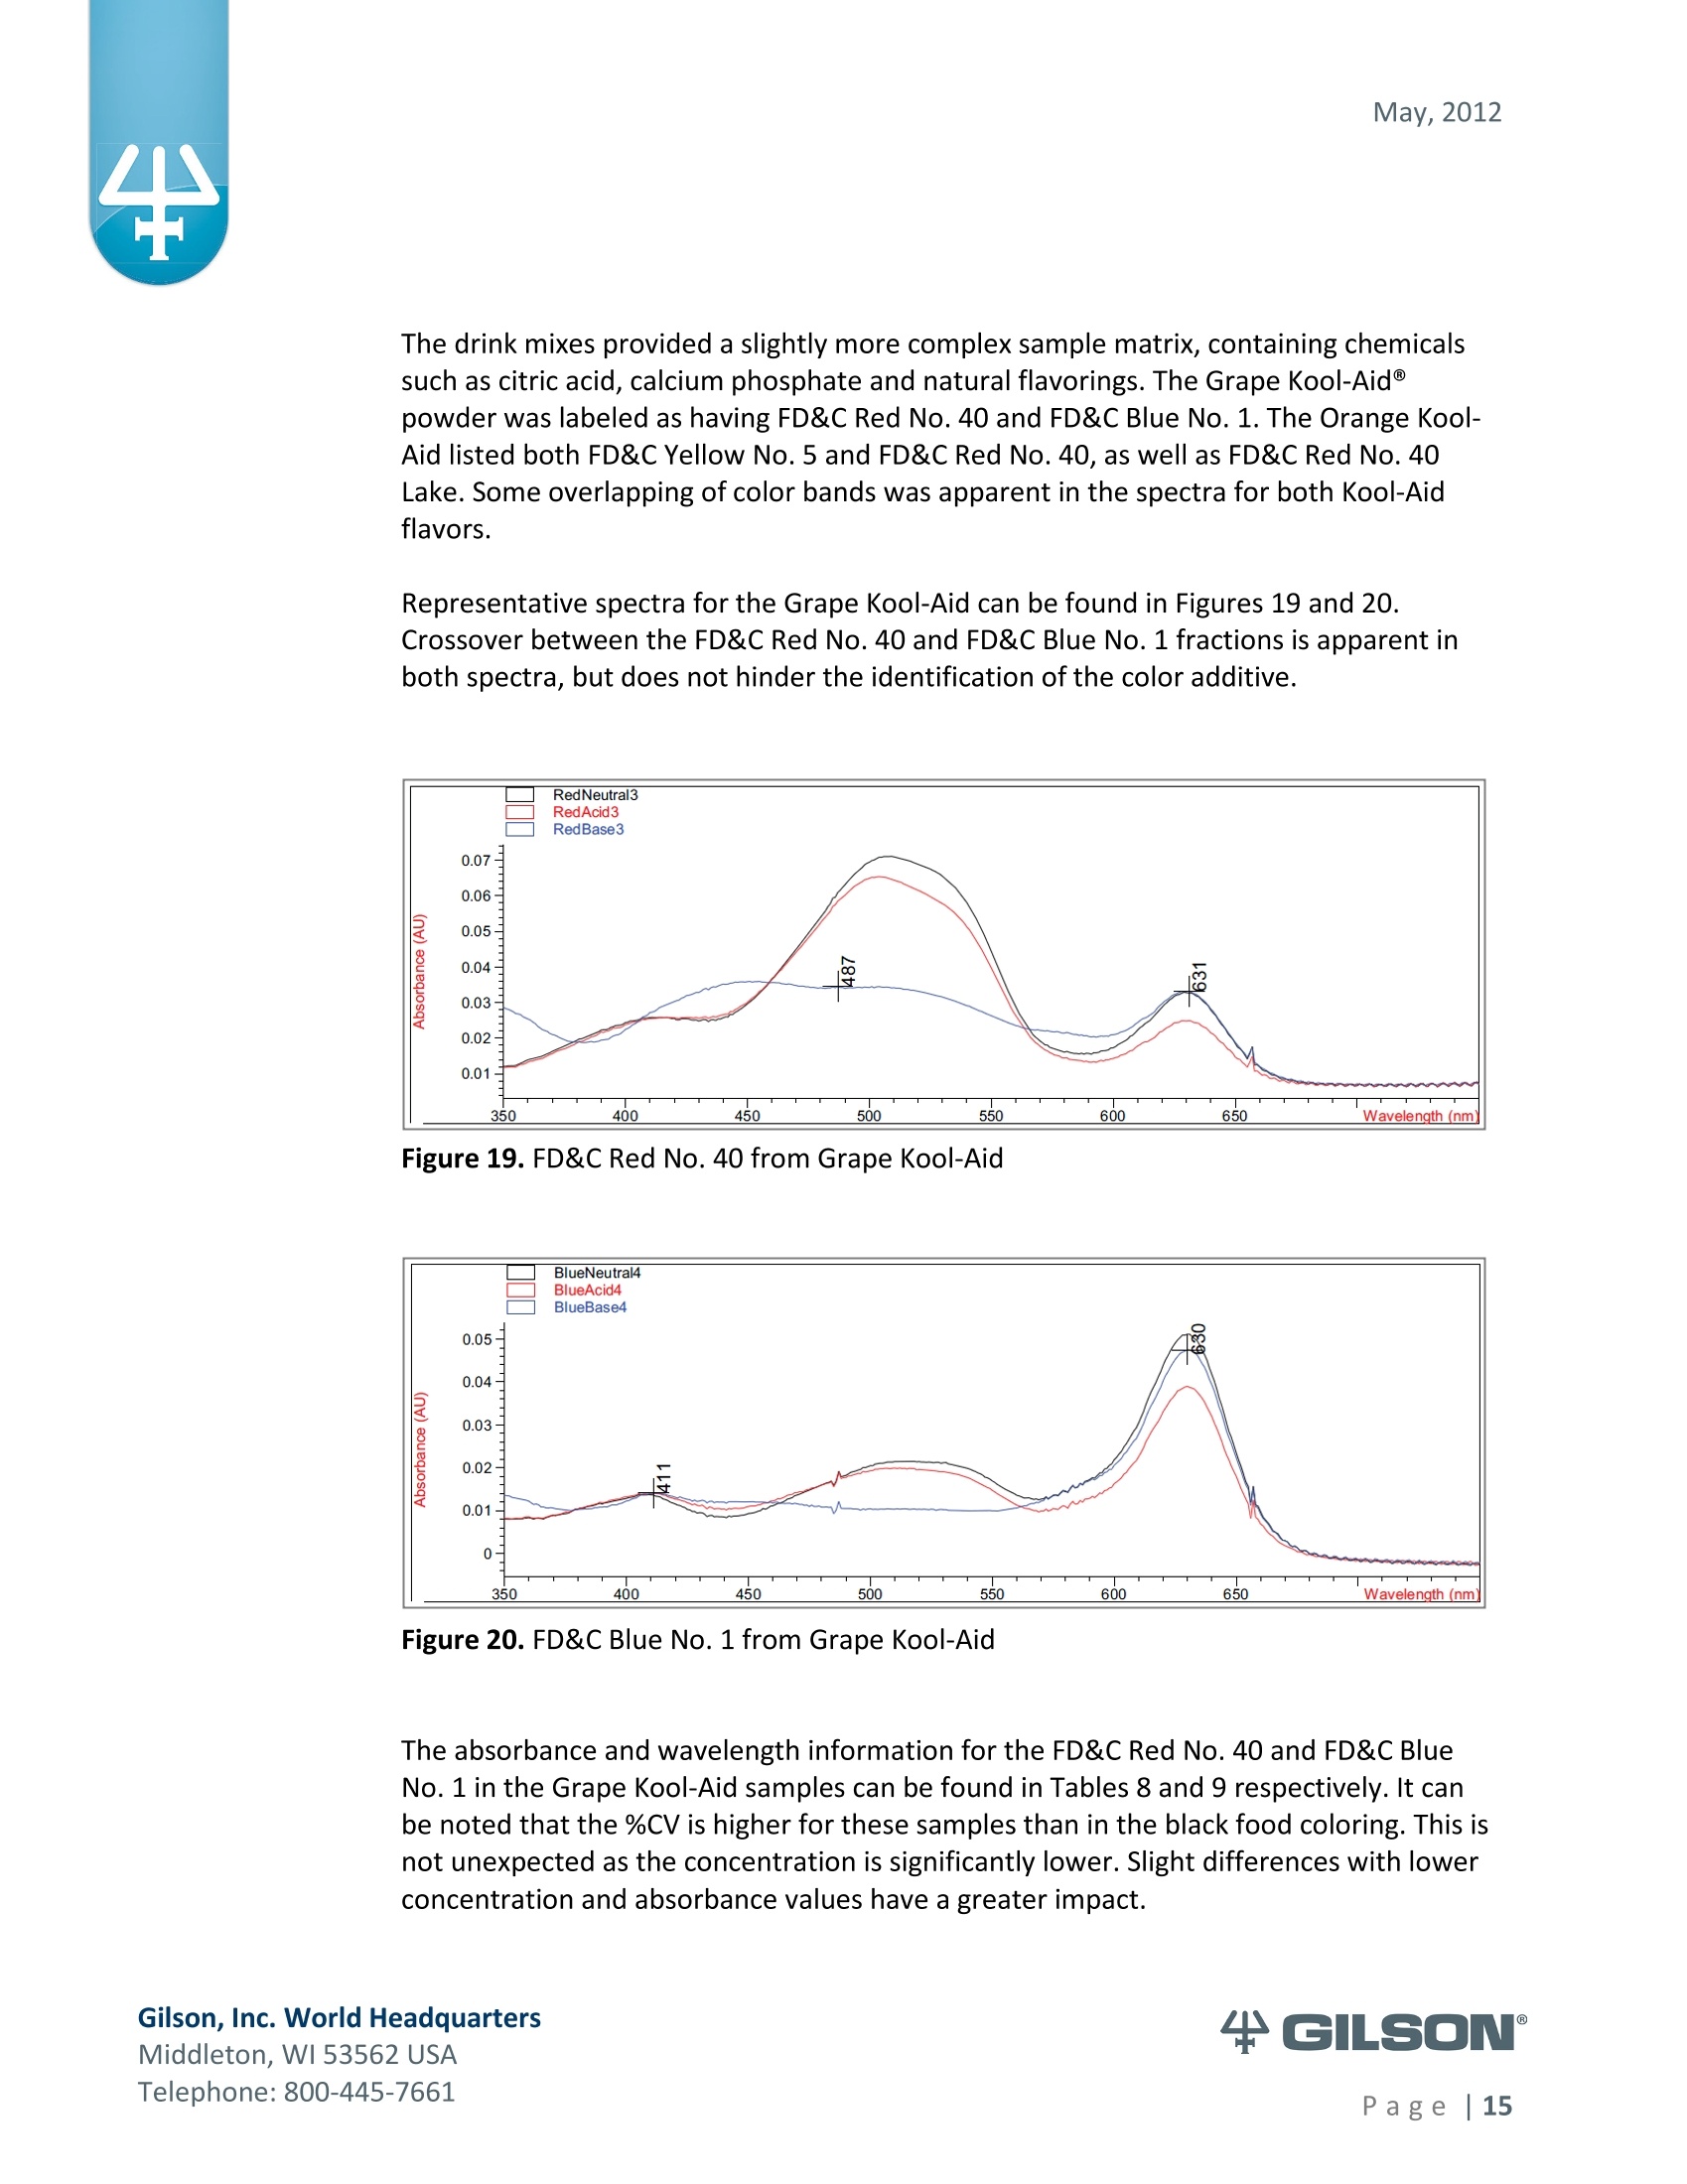
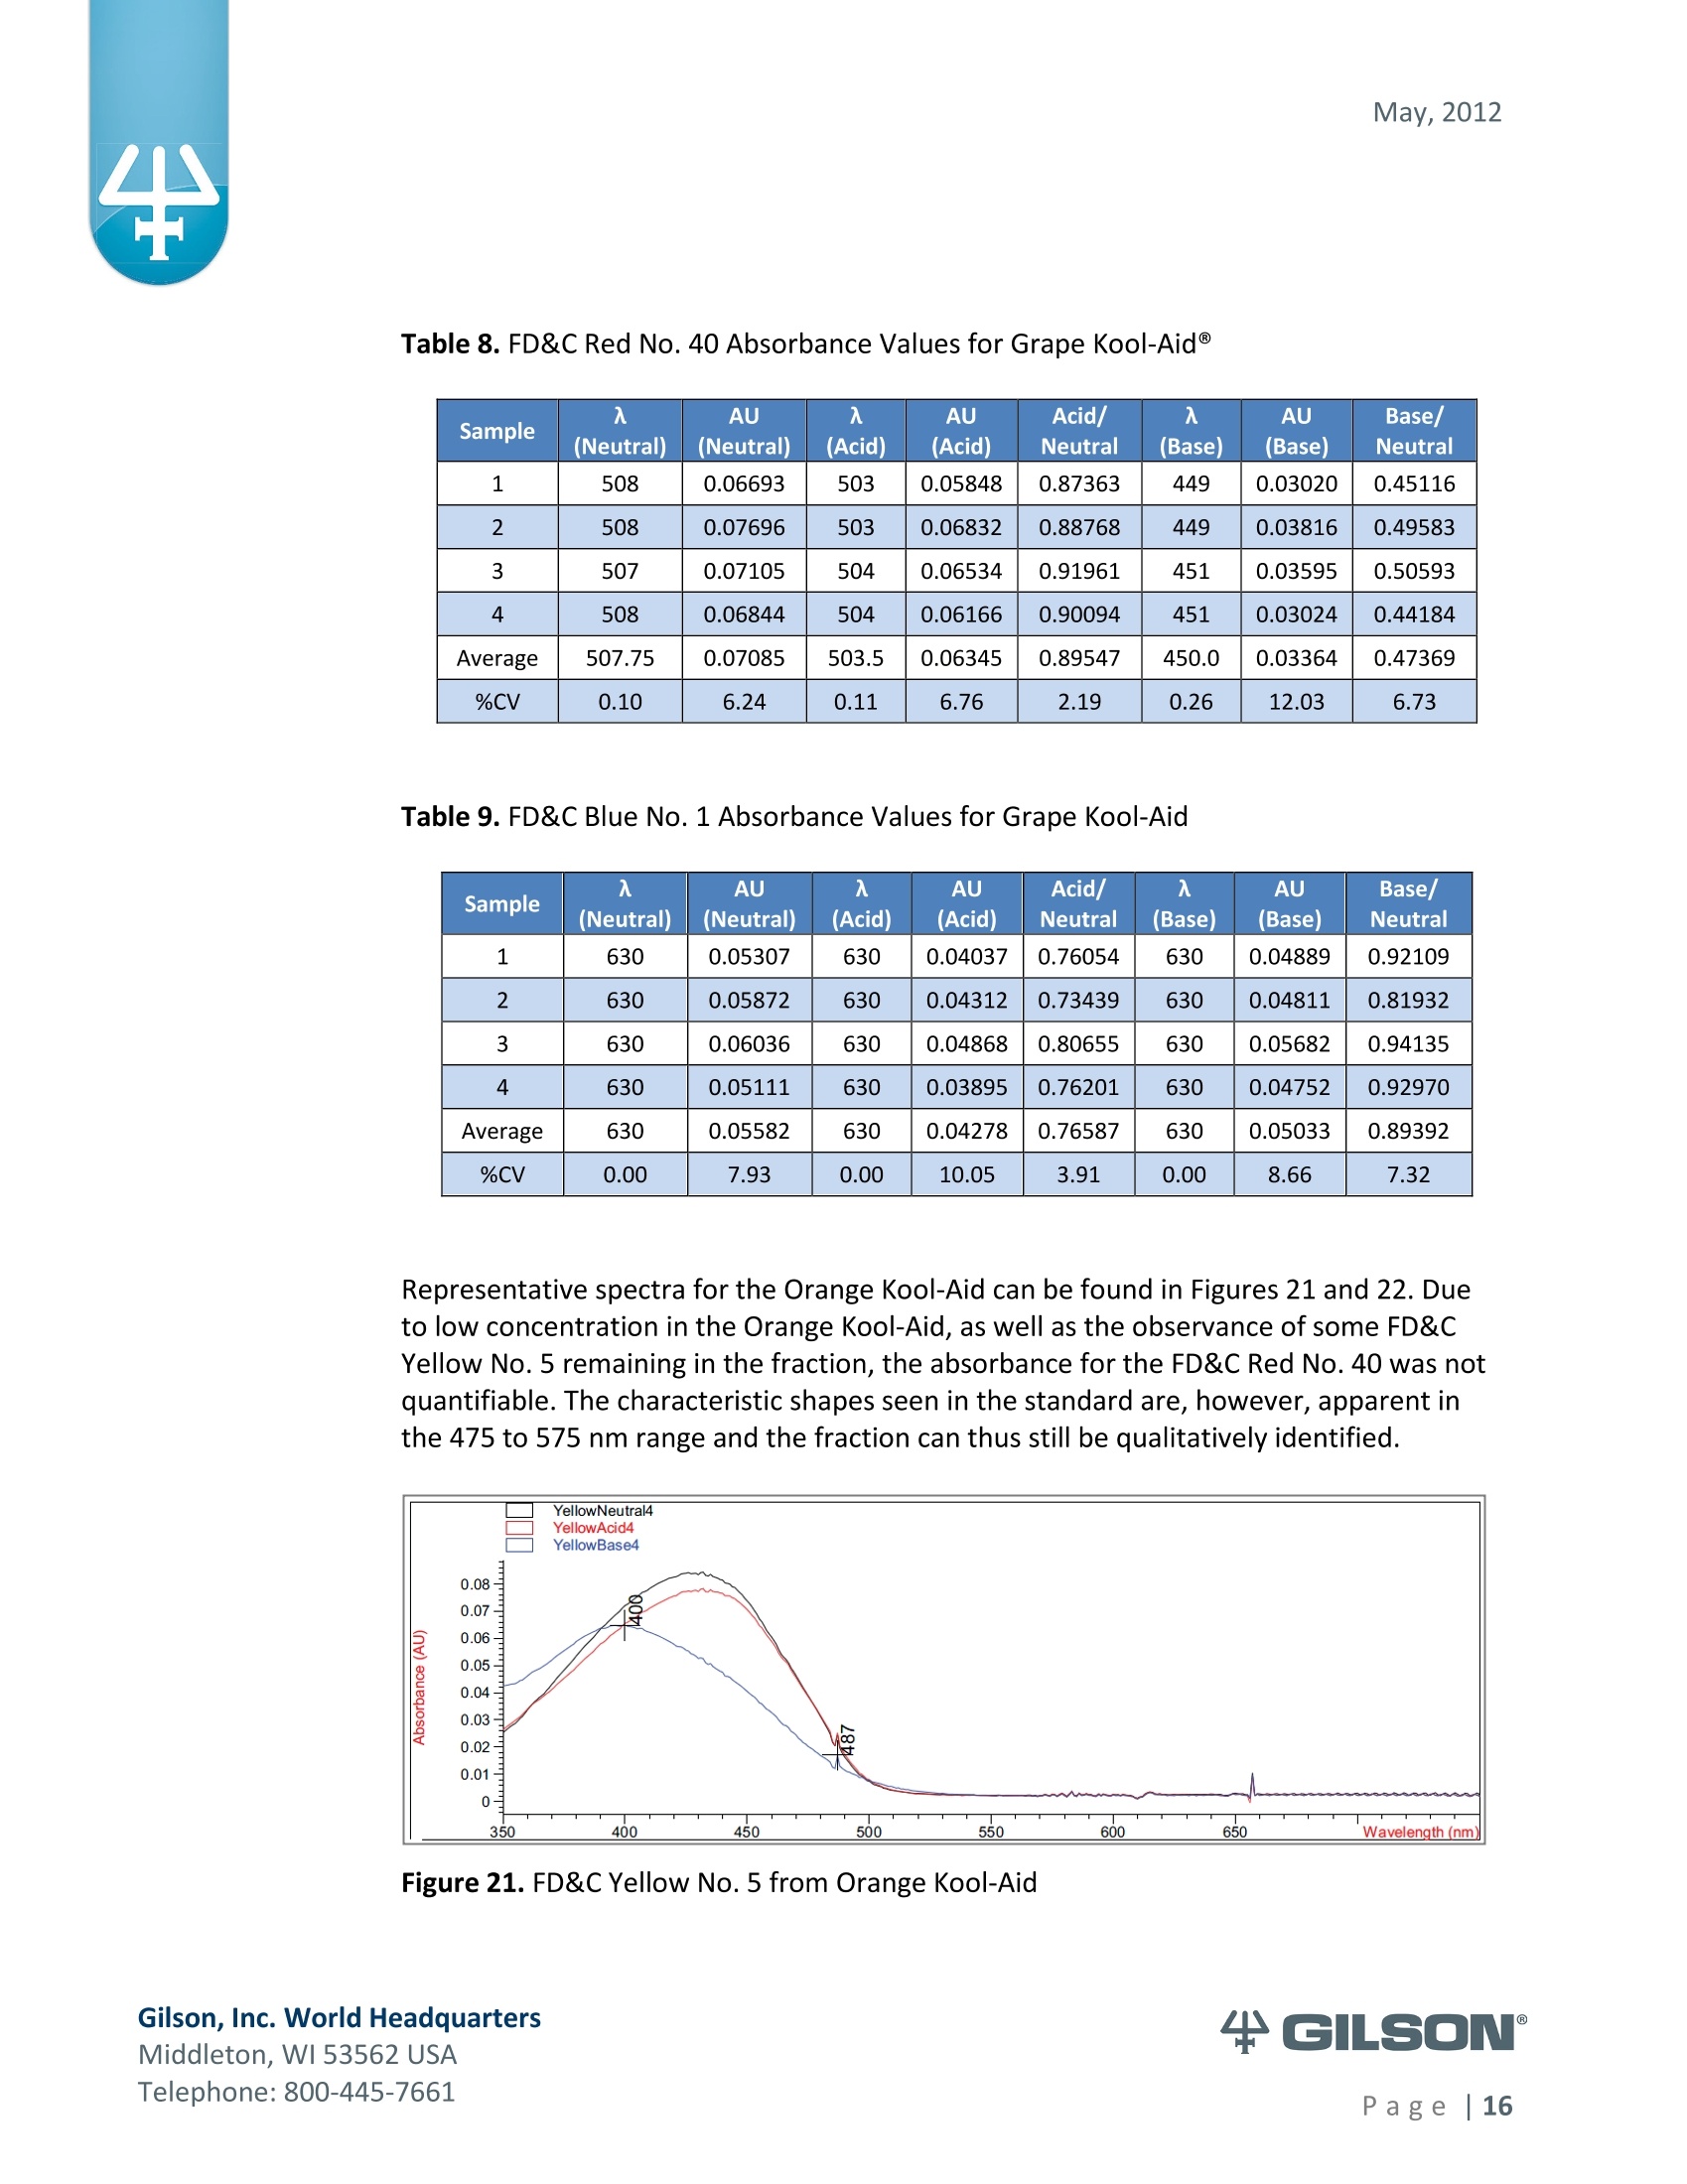
May, 2012 Automation of AOAC 988.13 for theIdentification of FD&C Color Additives in Foodsusing Solid Phase Extraction Application Note FB0112 Keywords GX-274 ASPECTM, AOAC, Spectrophotometer, Food and Beverage, Solid Phase Extraction,SPE, Color Additives, FD&C, FDA, TRILUTION LH, Liquid Handling Introduction A color additive is any dye,pigment or other substance which imparts color to a food,drug or cosmetic or to the human body (1). Color additives for food are commonly foundin expected places, such as candies and powdered drink mixes, but also can be added tofruit skins to make them look more appealing. The addition of synthetic color additives isregulated closely by the FDA and is examined from the manufacturing of the pigmentitself, through to its use and appropriate product labeling. Color additives have comeunder scrutiny recently because of their potential adverse physical and mental healtheffects that may be linked to ingestion, especially in children. AOAC method 988.13 qualitatively tests for the presence of eight synthetic coloradditives, one of which is now banned. These color additives are FD&C colors approvedfor use in food, drugs and cosmetics. Additives are extracted from the sample matrixusing solid phase extraction (SPE), and then identified by spectrum analysis on aspectrophotometer. The color additives examined by the method -FD&C Red Nos. 3and 40, Blue Nos. 1 and 2, Yellow Nos. 5 and 6, Green No. 3 and the now banned RedNo. 2 -are listed in Table 1,along with the E Number used in the EU and UK, commonchemical name and chemical structure. In this application, AOAC method 988.13 was automated using a GilsonGX-274 ASPECto perform the SPE process just prior to automated spectrum analysisusing the Agilent 8453 UV-visible Spectrophotometer with the Agilent 8-positionMulticell Transport. Automation of routine and tedious manual methods allows forconsistent reproducibility and higher throughput, freeing laboratory personnel toperform analysis and interpretation of spectra as well as other laboratory applications. Table 1. FD&C Color Additives Identified in AOAC 988.13 FD&C Name E Number Common Name Chemical Structure FD&CRed 3 E 127 Erythrosin B NaO、 ONa FD&C Red 40 E 129 Allura Red AC OH ONa 0=S^ONa FD&C Blue 1 E 133 Brilliant Blue FCFErioglaucine OgS、SO3 FD&C Blue 2 E 132 Indigo Carmine Na* Na* FD&C Yellow 5 E 102 Tartrazine NaOOC -SO3Na OH NaOS FD&C Yellow 6 E 110 Sunset Yellow FCF HO、 NaSO: SO3Na FD&C Green 3 E 143 Fast Green FCF OH OgS、 SO:65 FD&C Red 2 E 123 Amaranth Banned in the US in 1976 *Structures obtained from www.wikipedia.org Samples & Solvents Allura Red AC (Sigma, P/N 458848) Tartrazine (Sigma, P/N T0388) Erioglaucine (Sigma, P/N 861146) Isopropanol (B&J, P/N 10071758) 2.5, 13 and 20% solutions were prepared with NanoPure waterAcetic Acid (Sigma, P/N 320099) 1% solution was prepared with NanoPure waterSodium Hydroxide (EM Science, P/N SX0600-1) 50% solution was prepared with NanoPure water Hydrochloric Acid (Sigma,P/N 258148) ● NanoPure Water Black Food Coloring (McCormick) Kool-Aid (Grape and Orange, powder) Apparatus ● Gilson GX-274 ASPECTM with two 406 Dual Syringe Pump (Figure 1) (4) 10 mL syringes GX Transfer Port Assembly (Special 1785) (Figure 1 Insert) Code 386 rack for 6 mL SPE cartridges Figure 1. Gilson GX-274 ASPEC,Insert: GX Transfer Port Assembly ● Multicell Transport (8-cell) ● (8) Flow Cell (1 mm, 40 pL) Phenomenex Strata@ C18-E SPE Cartridge (6 mL/1000 mg), P/N 8B-S001-JCH ● Grace Alltech@ Extract-CleanTM Filter Columns (8.0 mL), P/N 211108 Figure 2. Agilent 8453 UV-visible Spectrophotometer with Multicell Transport Method All tests were run in quadruplicate. Sample Preparation Reference Standard Solutions: (Stock) 100 mg of the reference material was diluted to100 mL with NanoPure water. (Standard) 10 mL of stock solution was diluted to 100 mLwith the appropriate isopropanol solution. Note: The Reference Standard Solution was made at 10x concentration to accountfor the pathlength of the flow cell used versus what was referenced in the method.Black Food Coloring:A 1:200 dilution of black food coloring was prepared withNanoPure water. Kool-Aid@: 1 g powder was dissolved in 100 mL NanoPure water and filtered on bed. Solid Phase Extraction The SPE scheme from AOAC 988.13 was utilized, with some volume modifications toadjust for cartridge size. This original SPE scheme can be found below in Figure 3. Thevolumes used for the application can be found in Tables 2, 3 and 4. Variables were usedin the TRILUTION LH Method to allow for modification and method development at theApplication level. Figure 3. SPE Scheme for FD&C Color Identification from AOAC 988.13 Table 2. SPE Parameters used for the Separation of Black Food Coloring Step Solvent Volume (uL) Air Push (pL) Condition #1 IPA 2000 1250 Condition #2 1% Acetic Acid 2500 1750 Load Black Food Coloring 1500 600 Fractionate #1 2.5%IPA 2250 750 Fractionate#2 13%IPA 1500 1000 Fractionate #3 20% IPA 3000 2000 Table 3. SPE Parameters used for the Separation of Grape Kool-Aid Step Solvent Volume (pl) Air Push (pL) Condition #1 IPA 2000 1250 Condition #2 1% Acetic Acid 2500 1750 Load Kool-Aid 2000 1200 Wash 2.5% IPA 3000 1500 Fractionate #1 13%IPA 2000 1000 Fractionate #2 20%IPA 3000 2000 Table 4. SPE Parameters used for the Separation of Orange Kool-Aid@ Step Solvent Volume (uL) Air Push(uL) Condition #1 IPA 2000 1500 Condition #2 1% Acetic Acid 2500 2000 Load Kool-Aid 2000 1200 Fractionate #1 2.5% IPA 4000 2500 Fractionate #2 13%IPA 3000 2000 Automated SPE Fraction Preparation for Absorbance Reading The fractions collected from the automatic SPE process were then prepared foridentification using the GX-274 ASPECTM controlled with TRILUTION LH software. 1)The fraction was transferred to a clean test tube; volume transferred was 250 uLless than the amount of solvent used for elution in the Fractionate step 2The fraction was diluted to 6 mL with appropriate IPA solution and volume34 2 mL was transferred to each of two sets of clean tubes 1500 pL was transferred to the flow cells via the transfer ports, and anabsorbance reading was taken on the neutral diluted fraction 5) A drop (23 pL) of concentrated hydrochloric acid was added to the second set oftest tubes and the solution was mixed 6) 1500 uL was transferred to the flow cells via the transfer ports, and anabsorbance reading was taken on the acidic fraction solution 7)A drop (23pL) of 50% sodium hydroxide solution was added to the third set oftest tubes and the solution was mixed 8)1500 uL was transferred to the flow cells via the transfer ports, and anabsorbance reading was taken on the basic fraction solution A blank of the appropriate IPA solution was taken prior to each set of absorbancereadings. The readings were taken from 190 to 1100 nm; however the spectra were onlyanalyzed from 350 to 750 nm, as specified in AOAC 988.13. The flow cells and lines wererinsed with 5 mL NanoPure water after each reading to eliminate carryover betweensamples. Software The entire automated AOAC 988.13 application, from the solid phase extraction to theabsorbance readings, was controlled and coordinated by Gilson's liquid handlingsoftware TRILUTION@ LH v2.0. TRILUTION LH was programmed to coordinate with AgilentChemStation for UV-visible spectroscopy software to control the absorbance readingsand movement of the Multicell Transport on the 8453 Spectrophotometer. All spectraanalysis was performed using the ChemStation software. Application Format in TRILUTION LH For flexibility and efficiency, the application was separated into several TRILUTION LHMethods, and contained variables to permit adaptation from the Application screen. Allof the Methods were run sequentially from the TRILUTION LH Sample List. A screenshotof the Sample List for the black food coloring samples can be seen in Figure 4. TheSample List has been labeled to identify which step of the application each Method isassociated with. The variable matrix is not shown. Solid Phase Extraction Yellow Fraction Preparation and Analysis Red Fraction Preparation and Analysis Blue Fraction Preparation and Analysis Figure 4. Sample List for AOAC 988.13 Analysis of Black Food Coloring Coordination with the Agilent 8453 UV-visible Spectrophotometer The Multicell Transport for the spectrophotometer was established to use 4 constantblank cells and 4 cells connected to the transfer ports on the GX-274 ASPECTM for sampleintroduction, as seen below in Figure 5. Figure 5. Arrangement of Flow Cells in the Multicell Transport The Method in TRILUTION LH transferred the sample to the flow cells via the transferports, ran an executable file which triggered the blank and sample absorbance readingsin the Agilent ChemStation software, rinsed the liquid handler probes and thentransferred water to the flow cells to rinse out the cells and lines prior to the next set ofsamples. A different version of the Method was made for each blank required, as therewere different executable files for each blank cell location (Figure 5). The tasks used inthe TRILUTION LH Method can be seen below in Figure 6. Figure 6. TRILUTION LH Method to Trigger the Agilent 8453 Spectrophotometer Analysis of Spectra All spectra were analyzed by Spectrum/Peaks Analysis in the Standard Mode ofChemStation for UV-visible Spectroscopy. The wavelength range was from 350 to 750nm and the software annotated 2 peaks within that range (Figure 7). Spectra wereoverlaid in the software to create the neutral, acid and base comparison spectrarequired for the identification. Figure 7. ChemStation for UV-visible Spectroscopy Analysis Parameter Results Prior to running samples, equivalency between manual and automated procedures wasestablished. First, it was established that adding only one drop of 50% sodium hydroxidesolution was equivalent to the stated procedure of adding one drop of concentratedhydrochloric acid and two drops of 50% sodium hydroxide for the basic spectra. Thesedrops were added manually with a glass Pasteur pipette to the blue standard solutionbefore being analyzed.Representative spectra can be seen below in Figures 8 and 9.Second, it was established that adding the drop manually via a glass pipette wasequivalent to adding the corresponding volume (23 pL) by the GX-274 ASPECTM from acapped 2 mL vial having a pierceable septa. A representative spectrum can be seen inFigure 10. Figure 8. Manual Addition of 1 drop HCl and 2 drops 50% NaOH Figure 9. Manual Addition of 1 drop 50% NaOH Figure 10. Automated Addition of 23 uL 50% NaOH lt was concluded that the automated acidification and basification of the samples wereequivalent to the manual methods described in AOAC 988.13. The differences inabsorbance from one method to another were within the %CV for the comparisonbetween the two manual methods. When comparing the manual method to theautomated method, the automated acid addition was within 1.5% of the manualabsorbance values, while the base addition was within 2.5 % of the manual absorbancevalues. After establishing equivalency, the standard solutions were analyzed to providecomparison spectra for the samples. The representative standard spectra for FD&CYellow No. 5, FD&C Red No.40 and FD&C Blue No. 1 can be found below in Figures 11,12 and 13 respectively. Figure 11. Standard Spectra for FD&C Yellow No. 5 Figure 12. Standard Spectra for FD&C Red No. 40 Figure 13. Standard Spectra for FD&C Blue No.1 McCormick brand black food coloring (Figure 14) was used as a primary test sample as ithas a relatively clean matrix associated with it. The ingredient labeling for the black foodcoloring indicated it contained FD&C Yellow No. 5, FD&C Red No. 40 and FD&C Blue No.1. The resultant spectra confirmed the presence of these color additives. Representativespectra from each of the fractions can be found below in Figures 15, 16 and 17. A slightcarryover of FD&C Red No. 40 into the FD&C Blue No. 1 fraction can be observed inFigure 17. Absorbance and wavelength information for each of the black food coloring samples canbe found below in Tables 5, 6 and 7. It should be noted that although the absorbancevalues from each sample could have up to a 5.8%CV, the %CV of the ratio of the neutralpeak to the acidic or basic peak was much more consistent, with the largest differencebeing 2.2% CV. Grape and Orange Kool-Aid@ powder were used as secondary testsamples for this application (Figure 18). Figure 14.McCormick Black Food Coloring Figure 15. FD&C Yellow No. 5 from Black Food Coloring Figure 16. FD&C Red No. 40 from Black Food Coloring Figure 17. FD&C Blue No. 1 from Black Food Coloring Table 5. FD&C Yellow No.5 Absorbance Values for Black Food Coloring Sample 入 (Neutral) AU (Neutral) 入 (Acid) AU (Acid) Acid/ Neutral 入 (Base) AU (Base) Base/Neutral 1 426 0.06627 432 0.05819 0.87813 400 0.05200 0.78459 2 427 0.07198 433 0.06358 0.88332 401 0.05533 0.76863 3 432 0.06992 432 0.06380 0.91243 400 0.05381 0.76953 4 432 0.06462 432 0.05887 0.91103 400 0.04833 0.74797 Ave 429.25 0.06820 432.25 0.06111 0.89623 400 0.05237 0.76784 %CV 0.75 4.93 0.12 4.90 2.01 0.12 5.76 1.96 Table 6. FD&C Red No. 40 Absorbance Values for Black Food Coloring Sample 入 (Neutral) AU (Neutral) 入 (Acid) AU(Acid) Acid/ Neutral 入 (Base) AU (Base) Base/Neutral 1 505 0.23225 499 0.20725 0.89236 447 0.12522 0.53916 2 505 0.22156 498 0.19814 0.89429 444 0.12479 0.56323 3 505 0.20416 499 0.18510 0.90664 445 0.11468 0.56172 4 505 0.21741 499 0.19816 0.91146 447 0.11824 0.54386 Ave 505 0.21885 498.75 0.19716 0.90119 445.8 0.12073 0.55199 %CV 0.00 5.31 0.10 4.62 1.03 0.34 4.26 2.22 Table 7. FD&C Blue No. 1 Absorbance Values for Black Food Coloring Sample 入 (Neutral) AU (Neutral) 入(Acid) AU(Acid) Acid/ Neutral 入 (Base) AU(Base) Base/Neutral 1 630 0.46048 630 0.37377 0.81170 631 0.43197 0.93809 2 630 0.47513 630 0.40056 0.84305 630 0.45019 0.94751 3 630 0.47172 630 0.38937 0.82543 631 0.44424 0.94175 4 630 0.46956 630 0.38524 0.82043 631 0.44575 0.94929 Ave 630 0.46922 630 0.38724 0.82515 630.75 0.44304 0.94245 %CV 0.00 1.33 0.00 2.86 1.60 0.08 1.76 0.50 Figure 18. Kool-Aid Unsweetened Drink Mix in Grape and Orange Flavors The drink mixes provided a slightly more complex sample matrix, containing chemicalssuch as citric acid, calcium phosphate and natural flavorings. The Grape Kool-Aid@powder was labeled as having FD&C Red No. 40 and FD&C Blue No. 1. The Orange Kool-Aid listed both FD&C Yellow No.5 and FD&CRed No. 40, as well as FD&C Red No.40Lake. Some overlapping of color bands was apparent in the spectra for both Kool-Aidflavors. Representative spectra for the Grape Kool-Aid can be found in Figures 19 and 20.Crossover between the FD&C Red No. 40 and FD&C Blue No. 1 fractions is apparent inboth spectra, but does not hinder the identification of the color additive. Figure 19. FD&C Red No. 40 from Grape Kool-Aid Figure 20. FD&C Blue No. 1 from Grape Kool-Aid The absorbance and wavelength information for the FD&C Red No. 40 and FD&C BlueNo. 1 in the Grape Kool-Aid samples can be found in Tables 8 and 9 respectively. It canbe noted that the %CV is higher for these samples than in the black food coloring. This isnot unexpected as the concentration is significantly lower. Slight differences with lowerconcentration and absorbance values have a greater impact. Table 8. FD&C Red No. 40 Absorbance Values for Grape Kool-Aid@ Sample 入 (Neutral) AU (Neutral) 入 (Acid) AU (Acid) Acid/Neutral 入 (Base) AU (Base) Base/ Neutral 1 508 0.06693 503 0.05848 0.87363 449 0.03020 0.45116 2 508 0.07696 503 0.06832 0.88768 449 0.03816 0.49583 3 507 0.07105 504 0.06534 0.91961 451 0.03595 0.50593 4 508 0.06844 504 0.06166 0.90094 451 0.03024 0.44184 Average 507.75 0.07085 503.5 0.06345 0.89547 450.0 0.03364 0.47369 %CV 0.10 6.24 0.11 6.76 2.19 0.26 12.03 6.73 Table 9. FD&C Blue No. 1 Absorbance Values for Grape Kool-Aid Sample 入 (Neutral) AU(Neutral) 入 (Acid) AU(Acid) Acid/Neutral 入 (Base) AU (Base) Base/ Neutral 1 630 0.05307 630 0.04037 0.76054 630 0.04889 0.92109 2 630 0.05872 630 0.04312 0.73439 630 0.04811 0.81932 3 630 0.06036 630 0.04868 0.80655 630 0.05682 0.94135 4 630 0.05111 630 0.03895 0.76201 630 0.04752 0.92970 Average 630 0.05582 630 0.04278 0.76587 630 0.05033 0.89392 %CV 0.00 7.93 0.00 10.05 3.91 0.00 8.66 7.32 Representative spectra for the Orange Kool-Aid can be found in Figures 21 and 22. Dueto low concentration in the Orange Kool-Aid, as well as the observance of some FD&CYellow No. 5 remaining in the fraction, the absorbance for the FD&C Red No. 40 was notquantifiable. The characteristic shapes seen in the standard are, however, apparent inthe 475 to 575 nm range and the fraction can thus still be qualitatively identified. Figure 21. FD&C Yellow No. 5 from Orange Kool-Aid Figure 22. FD&C Red No. 40 from Orange Kool-Aid@ The absorbance and wavelength information for the FD&C Yellow No. 5 fraction of theOrange Kool-Aid can be found below in Table 10. As stated above, the FD&C Red No. 40fraction was not quantifiable due to low concentration and overlap with the FD&CYellow No. 5 peaks. The FD&C Yellow No.5 has a slightly higher absorbance thatresulted in a more consistent reading than the color additives in the Grape Kool-Aid and%CV values near 5%. The %CV for the ratio of the neutral peak to the acidic or basicpeak was improved over the Grape Kool-Aid sample, with values less than 3% CV. Table 10. FD&C Yellow No. 5 Absorbance Values for Orange Kool-Aid Sample 入 (Neutral) AU(Neutral) 入 (Acid) AU (Acid) Acid/Neutral 入 (Base) AU (Base) Base/Neutral 1 429 0.09544 432 0.08661 0.90745 399 0.07062 0.73993 2 429 0.09108 430 0.08315 0.91295 401 0.06745 0.74059 3 432 0.08857 432 0.08515 0.96141 400 0.06936 0.78311 4 432 0.08430 432 0.07823 0.92802 400 0.06483 0.76906 Average 430.5 0.08985 431.5 0.08329 0.92746 400.0 0.06807 0.75817 %CV 0.40 5.19 0.23 4.39 2.61 0.20 3.70 2.83 Finding viable automation solutions to tedious and manual methods creates efficiencyand day-to-day consistency. By automating standard lab practices such asspectrophotometer readings and sample preparation, a typical laboratory is able toincrease sample throughput,eliminate personnel to personnel variation and uselaboratory personnel for other more important laboratory work such as data analysis.The basic process of how the manual method was automated can also be applied toother manual methods requiring both qualitative, as in AOAC 988.13, and quantitativespectrophotometric sample readings,expanding its application into many differentsample categories. This application shows equivalency between established manual methodology and itsautomated counterpart across different sample matrices. Through additionaldevelopment and optimization the overlapping of color bands could be eliminated.Using flow cells with longer pathlengths could also assist with obtaining higherabsorbance readings for low concentration samples. References 1. Barrows, Julie N., Lipman, Arthur L., and Bailey, Catherine J. “Color Additives: FDA'sRegulatory Process and Historical Perspectives." Food Safety Magazine Oct. -Nov.2003.11 May 2011. 2. Horwitz, William and Latimer, George W.“AOAC Official Method 988.13 FD&C ColorAdditives in Foods."Official Methods of Analysis of AOAC International.Gaithersburg, MD: AOAC International, 2005. ASPECTM is a trademark of Gilson, Inc.TRILUTION LH is a registered trademark of Gilson, Inc.Kool-Aid@is a registered trademark of Kraft Foods, Inc.Strata@ is a registered trademark of PhenomenexAlltech is a registered trademark of GraceExtract-CleanTM is a trademark of Grace Gilson, Inc. World HeadquartersMiddleton, WI USATelephone: age| A color additive is any dye, pigment or other substance which imparts color to a food, drug or cosmetic or to the human body (1). Color additives for food are commonly found in expected places, such as candies and powdered drink mixes, but also can be added to fruit skins to make them look more appealing. The addition of synthetic color additives is regulated closely by the FDA and is examined from the manufacturing of the pigment itself, through to its use and appropriate product labeling. Color additives have come under scrutiny recently because of their potential adverse physical and mental health effects that may be linked to ingestion, especially in children.AOAC method 988.13 qualitatively tests for the presence of eight synthetic color additives, one of which is now banned. These color additives are FD&C colors approved for use in food, drugs and cosmetics. Additives are extracted from the sample matrix using solid phase extraction (SPE), and then identified by spectrum analysis on a spectrophotometer. The color additives examined by the method – FD&C Red Nos. 3 and 40, Blue Nos. 1 and 2, Yellow Nos. 5 and 6, Green No. 3 and the now banned Red No. 2 – are listed in Table 1, along with the E Number used in the EU and UK, common chemical name and chemical structure.In this application, AOAC method 988.13 was automated using a GilsonGX-274 ASPEC to perform the SPE process just prior to automated spectrum analysis using the Agilent 8453 UV-visible Spectrophotometer with the Agilent 8-position Multicell Transport. Automation of routine and tedious manual methods allows for consistent reproducibility and higher throughput, freeing laboratory personnel to perform analysis and interpretation of spectra as well as other laboratory applications.KeywordsGX-274 ASPEC™, AOAC, Spectrophotometer, Food and Beverage, Solid Phase Extraction, SPE, Color Additives, FD&C, FDA, TRILUTION ® LH, Liquid HandlingAutomation of AOAC 988.13 for the Identification of FD&C Color Additives in Foods using Solid Phase ExtractionApplication Note FB0112
确定
还剩16页未读,是否继续阅读?

香港华运有限公司为您提供《food中Color additives检测方案(固相萃取仪)》,该方案主要用于其他食品中过敏原检测,参考标准--,《food中Color additives检测方案(固相萃取仪)》用到的仪器有
相关方案
更多