


The increasing use of new automotive fuel mixtures such as E85 and biodiesel is dramatically changing the chemical monitoring landscape in the development and manufacture of catalysts used to reduce vehicle emissions. Catalyst manufacturers have found that achieving regulatory compliance with these new and chemically complex fuels requires a level of knowledge of the combustion chemistry that goes well beyond the conventional need for CO, CO2, NO, NO2 and THCs analyses.
方案详情

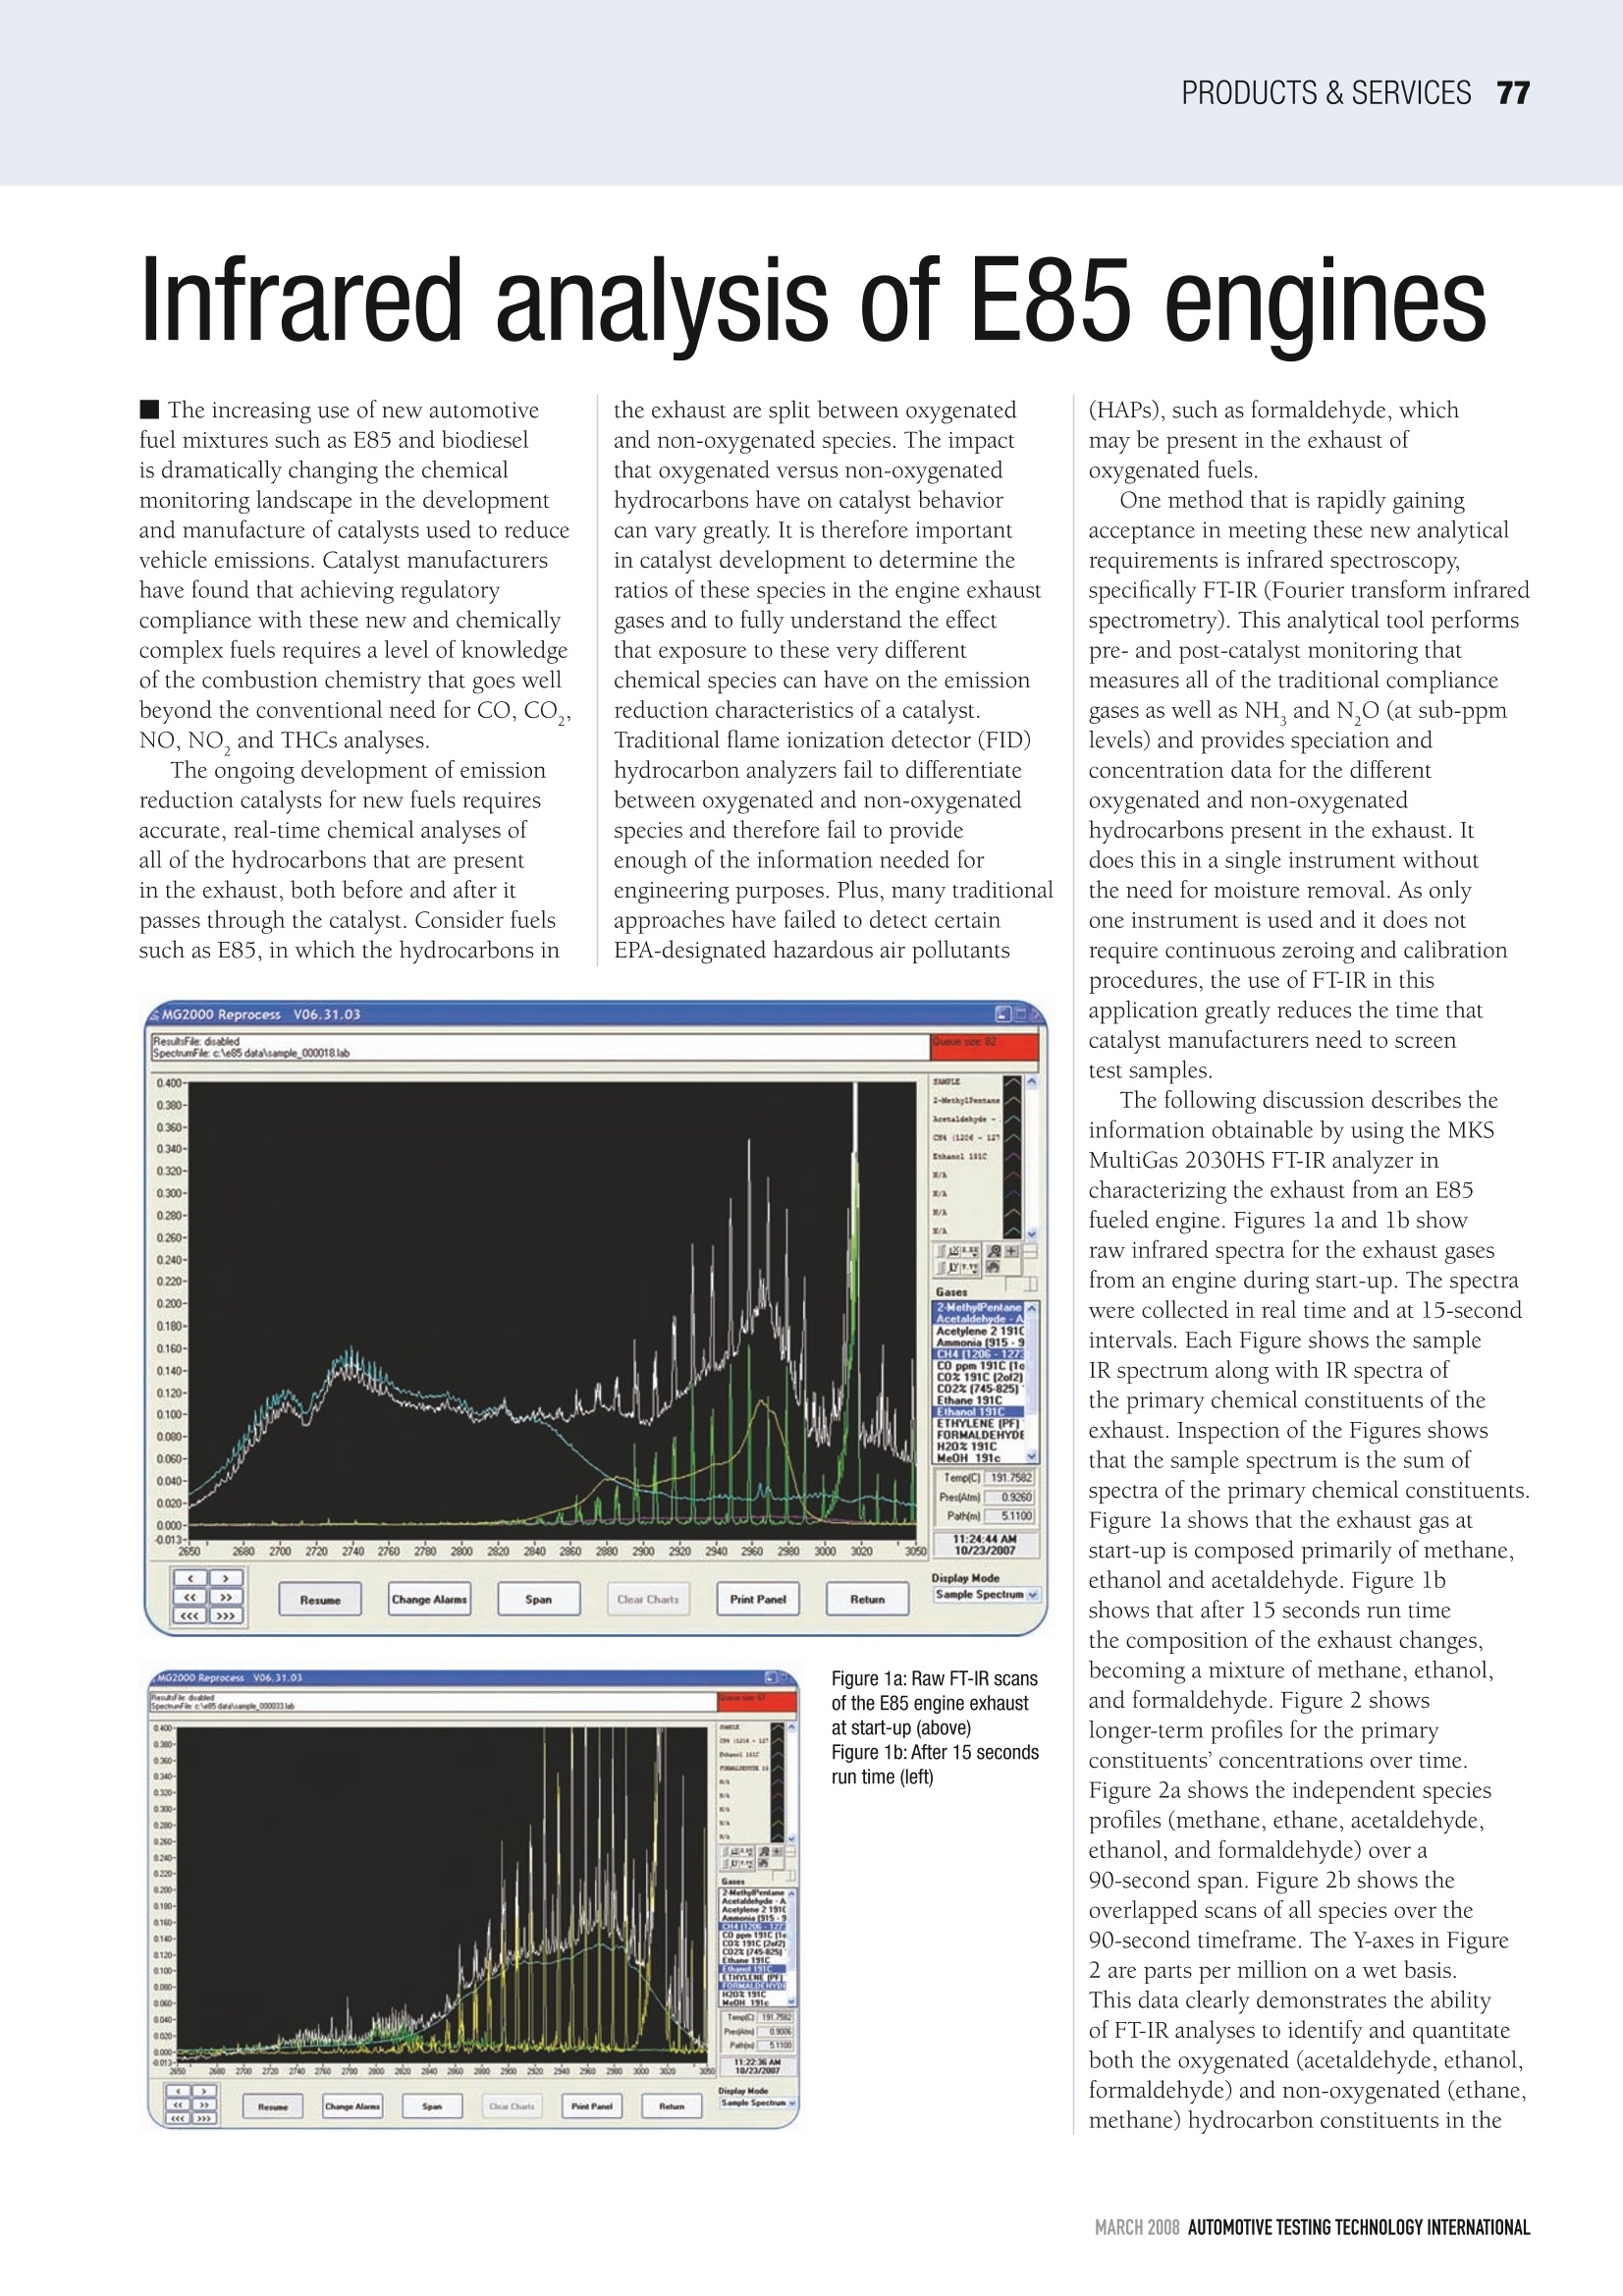
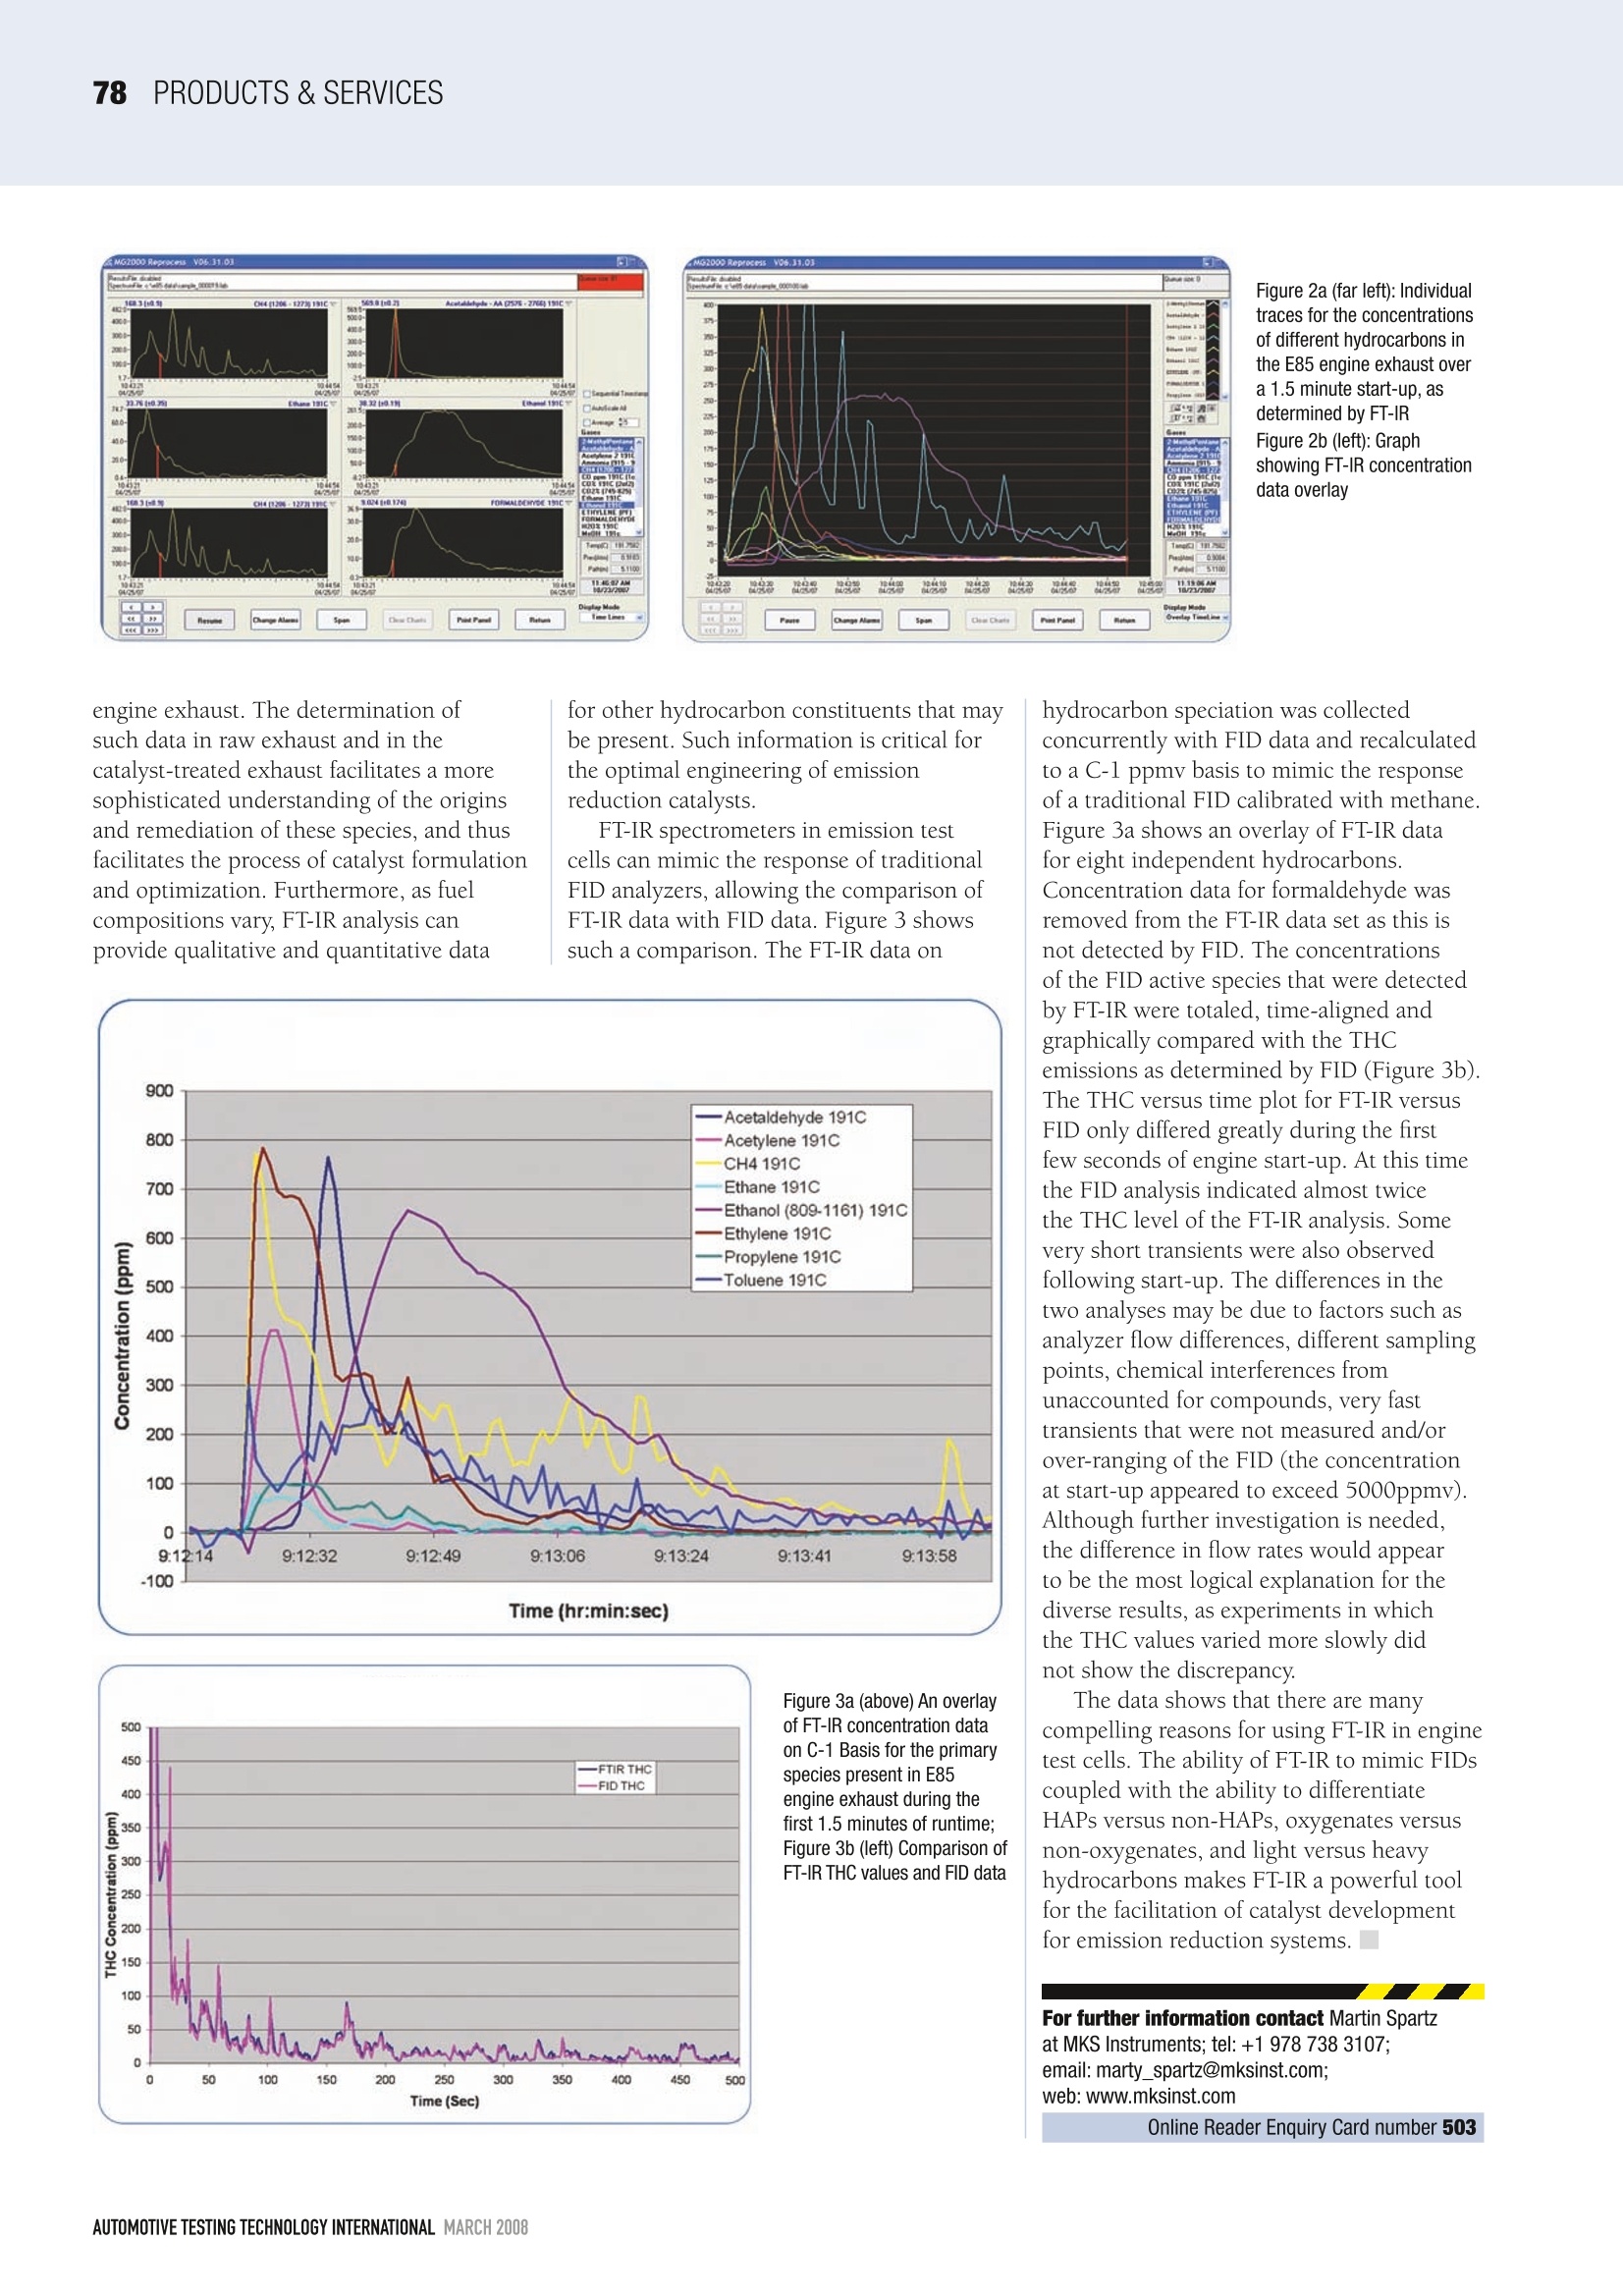
PRODUCTS & SERVICESS77 Infrared analysis of E85 engines The increasing use of new automotivefuel mixtures such as E85 and biodieselis dramatically changing the chemicalmonitoring landscape in the developmentand manufacture of catalysts used to reducevehicle emissions. Catalyst manufacturershave found that achieving regulatorycompliance with these new and chemicallycomplex fuels requires a level of knowledgeof the combustion chemistry that goes wellbeyond the conventional need for CO, CO,,NO,NO, and THCs analyses. The ongoing development of emissionreduction catalysts for new fuels requiresaccurate, real-time chemical analyses ofall of the hydrocarbons that are presentin the exhaust, both before and after itpasses through the catalyst. Consider fuelssuch as E85, in which the hydrocarbons in the exhaust are split between oxygenatedand non-oxygenated species. The impactthat oxygenated versus non-oxygenatedhydrocarbons have on catalyst behaviorcan vary greatly. It is therefore importantin catalyst development to determine theratios of these species in the engine exhaustgases and to fully understand the effectthat exposure to these very differentchemical species can have on the emissionreduction characteristics of a catalyst.Traditional flame ionization detector (FID)hydrocarbon analyzers fail to differentiatebetween oxygenated and non-oxygenatedspecies and therefore fail to provideenough of the information needed forengineering purposes. Plus, many traditionalapproaches have failed to detect certainEPA-designated hazardous air pollutants Figure 1a: Raw FT-IR scansof the E85 engine exhaustat start-up (above)Figure 1b: After 15 secondsrun time (left) (HAPs), such as formaldehyde, whichmay be present in the exhaust ofoxygenated fuels. One method that is rapidly gainingacceptance in meeting these new analyticalrequirements is infrared spectroscopy,specifically FT-IR (Fourier transform infraredspectrometry). This analytical tool performspre- and post-catalyst monitoring thatmeasures all of the traditional compliancegases as well as NH, and N,O (at sub-ppmlevels) and provides speciation andconcentration data for the differentoxygenated and non-oxygenatedhydrocarbons present in the exhaust. Itdoes this in a single instrument withoutthe need for moisture removal. As onlyone instrument is used and it does notrequire continuous zeroing and calibrationprocedures, the use of FT-IR in thisapplication greatly reduces the time thatcatalyst manufacturers need to screentest samples. The following discussion describes theinformation obtainable by using the MKSMultiGas 2030HS FT-IR analyzer incharacterizing the exhaust from an E85fueled engine. Figures la and 1b showraw infrared spectra for the exhaust gasesfrom an engine during start-up. The spectrawere collected in real time and at 15-secondintervals. Each Figure shows the sampleIR spectrum along with IR spectra ofthe primary chemical constituents of theexhaust. Inspection of the Figures showsthat the sample spectrum is the sum ofspectra of the primary chemical constituents.Figure la shows that the exhaust gas atstart-up is composed primarily of methane,ethanol and acetaldehyde. Figure lbshows that after 15 seconds run timethe composition of the exhaust changes,becoming a mixture of methane,ethanol,andformaldehyde. Figure 2 showslonger-term profiles for the primaryconstituents'concentrations over time.Figure 2a shows the independent speciesprofiles (methane, ethane,acetaldehyde,ethanol, and formaldehyde) over a90-second span. Figure 2b shows theoverlapped scans of all species over the90-second timeframe. The Y-axes in Figure2 are parts per million on a wet basis.This data clearly demonstrates the abilityof FT-IR analyses to identify and quantitateboth the oxygenated (acetaldehyde, ethanol,formaldehyde) and non-oxygenated (ethane,methane) hydrocarbon constituents in the Figure 2a (far left): Individualtraces for the concentrationsof different hydrocarbons inthe E85 engine exhaust overa 1.5 minute start-up,asdetermined by FT-IRFigure 2b (left): Graphshowing FT-IR concentrationdata overlay engine exhaust. The determination ofsuch data in raw exhaust and in thecatalyst-treated exhaust facilitates a moresophisticated understanding of the originsand remediation of these species, and thusfacilitates the process of catalyst formulationand optimization. Furthermore, as fuelcompositions vary, FT-IR analysis canprovide qualitative and quantitative data FT-IR spectrometers in emission testcells can mimic the response of traditionalFID analyzers, allowing the comparison ofFT-IR data with FID data. Figure 3 showssuch a comparison. The FT-IR data on Figure 3a (above) An overlayof FT-IR concentration dataon C-1 Basis for the primaryspecies present in E85engine exhaust during thefirst 1.5 minutes of runtime;Figure 3b (left) Comparison ofFT-IR THC values and FID data hydrocarbon speciation was collectedconcurrently with FID data and recalculatedto a C-1 ppmv basis to mimic the responseof a traditional FID calibrated with methaneFigure 3a shows an overlay of FT-IR datafor eight independent hydrocarbons.Concentration data for formaldehyde wasremoved from the FT-IR data set as this isnot detected by FID. The concentrationsof the FID active species that were detectedby FT-IR were totaled, time-aligned andgraphically compared with the THCemissions as determined by FID (Figure 3b).、..4..The THC versus time plot for FT-IR versusFID only differed greatly during the firstfew seconds of engine start-up. At this timethe FID analysis indicated almost twicethe THC level of the FT-IR analysis. Somevery short transients were also observedfollowing start-up. The differences in thetwo analyses may be due to factors such asanalyzer flow differences, different samplingpoints, chemical interferences fromunaccounted for compounds, very fasttransients that were not measured and/orover-ranging of the FID (the concentrationat start-up appeared to exceed 5000ppmv).Although further investigation is needed,the difference in flow rates would appearto be the most logical explanation for thediverse results, as experiments in whichthe THC values varied more slowly didnot show the discrepancy. The data shows that there are manycompelling reasons for using FT-IR in enginetest cells. The ability of FT-IR to mimic FIDscoupled with the ability to differentiateHAPs versus non-HAPs, oxygenates versusnon-oxygenates, and light versus heavyhydrocarbons makes FT-IR a powerful toolfor the facilitation of catalyst developmentfor emission reduction systems. ■ ( For further information contact Martin S p artz at MKS I nstruments; tel:+1 978 738 3107; e mail: marty _ spartz@mksinst.com; web: www.mksinst.com O nline Reader Enquiry Car d number 503 ) MARCH AUTOMOTIVE TESTING TECHNOLOGY INTERNATIONAL
确定
还剩1页未读,是否继续阅读?

万机仪器(上海)有限公司为您提供《Infrared analysis of E85 engines》,该方案主要用于其他中--检测,参考标准--,《Infrared analysis of E85 engines》用到的仪器有
相关方案
更多