哪位哥哥知道ASTM D2415煤焦油和沥青中灰分分析方法,给个帮助,谢谢
哪位朋友有煤沥青检测方法?给发一份,谢谢![em0904][em0904][em0904]
哪位朋友有下列关于沥青的分析标准:GB/T 2288 焦化产品水份测定方法GB/T 2291 煤沥青试验室试样的制备方法GB/T 2292 焦化产品甲苯不溶物含量的测定GB/T 2293 焦化固体类产品 哇啉不溶物试验方法GB/T 2294 焦化固体类产品 软化点测定方法GB/T 2295 煤沥青灰份测定方法GB/T 8727 煤沥青结焦值测定方法GB/T 9977 焦化产品术语先谢谢各位朋友!
沥青做红外光谱测试时制样能采用溴化钾晶体涂片法吗?[color=#333333]另外,溴化钾晶体涂片法的详细操作步骤是怎样的?[/color]
我现在做原油含蜡、胶、沥青分析时还是用老方法、老仪器,气味大,还要用到苯和丙酮。不知大家都怎么做的?另外本人试着用2004年的新行业标准测蜡,比方法结果少一半出蜡量。
近红外方法开发完,并完成方法及方法报告的编写,然后投入使用 。当近红外分析结果异常,补加建模数据后方法参数变了,需要从新编写方法规程吗?是没次改变方法参数都要写方法规程吗?
名称:傅里叶变换红外光谱方法通则起草单位:国家教育委员会实施日期:1997.4.1适用范围:本通则规定了傅里叶变换红外光谱仪近红外,中红外,远红外波段的定性,定量分析方法。适用于各种类型的傅里叶变换红外光谱仪。主要技术要求:1,定义 2,方法原理 3,试剂材料 4,仪器 5,样品和制样方法 6,分析步骤 7,分析结果表述出版单位:科学技术文献出版社[img]http://www.instrument.com.cn/bbs/images/affix.gif[/img][url=http://www.instrument.com.cn/bbs/download.asp?ID=59753]傅里叶变换红外光谱方法通则[/url]
摘要:通过海能SOX500脂肪测定仪测定石棉沥青中沥青含量,探索了不同萃取时间其萃取效果的不同,最终采用索氏热萃取的方法连续回流3h.沥青是由不同分子量的碳氢化合物及其非金属衍生物组成的黑褐色复杂混合物,是高黏度有机液体的一种,呈液态,表面呈黑色,可溶于二硫化碳。沥青是一种防水防潮和防腐的有机胶凝材料。沥青主要用于涂料、塑料、橡胶等工业以及铺筑路面等。在实际应用中,人们一般会通过和其他材料进行混合使用来改变沥青材料的性能,比如石棉等,在道路交通方面,石棉纤维可以提高沥青的软化温度及降低其在低温下的脆性,从而改善路面的使用质量。在研究过程当中,为了达到最优质的道路质量参数,精确控制石棉沥青的配比十分重要。通常情况下人们通过索氏萃取的方法获得实验数据,而索氏提取器的使用需要大量的时间,费时费力。综合以上情况,我们通过使用海能仪器股份有限公司生产的SOX500脂肪测定仪进行实验,所得结果如下。实验方法:溶剂及萃取温度的选择 针对石棉和沥青的物理特性,石棉具有较好的耐腐蚀性,而沥青属于憎水性材料,它不透水,也几乎不溶于水、丙酮、乙醚、稀乙醇,溶于二硫化碳、四氯化碳、氢氧化钠,甲苯和石脑油。鉴于采用索氏回流提取,我们采用了甲苯作为萃取溶剂。甲苯的沸点为110.6℃,为了保证较好的回流萃取效果,将萃取温度设定为180℃。1. 将特氟龙溶剂杯清洗干净,在干燥箱烘至恒重。准备甲苯的500ml以上2. 将烘干恒重后溶剂杯自然冷却然后称取重量并记录,称取棉酸化油样品5g放进滤纸筒内(滤纸筒底部放入适量脱脂棉,用于吸收液体样品),可做五个样品,一个样品空白,以确保测试准确度。3. 将样品缓慢放入仪器萃取室中,并保证回流液恰好滴落在滤纸筒内,萃取室可加入80ml左右甲苯(甲苯添加量以漫过样品为标准)并拧紧上盖,防止溶剂泄漏。萃取温度设置180℃适宜萃取时间,预干燥时间30分钟以上(实验过程请保证冷却水正常流通,特氟龙溶剂杯放置准确 并确保不漏气)4. 试验结束后待仪器上溶剂杯冷却后,取下放置烘箱150左右°烘干30min,放置于干燥器内冷却,后迅速称取总重m1计算粗脂肪含量 file:///C:\Users\zhang\AppData\Local\Temp\ksohtml\wps2CB9.tmp.png式中:X————样品中粗脂肪的含量(g/100g);m1————溶剂杯和粗脂肪的质量(g);m0————干燥溶剂杯质量(g);m———— 样品质量file:///C:\Users\zhang\AppData\Local\Temp\ksohtml\wps2CE9.tmp.png如上图所示,五份样品同时测试,随着萃取时间的延长,沥青萃取量逐步增加,6h后基本达到萃取平衡。因此采用6h为萃取时间。
[color=#444444]红外分析沥青老化的时候,发现1375的峰增强了,1375代表甲基弯曲振动,但是1460代表代表甲基+亚甲基弯曲振动,2960,2872代表甲基伸缩振动。我想问的是我能不能只通过1375的变化表征甲基强度的变化?也就是说代表同一官能团的不同峰,他们的变化是一致的吗?[/color]
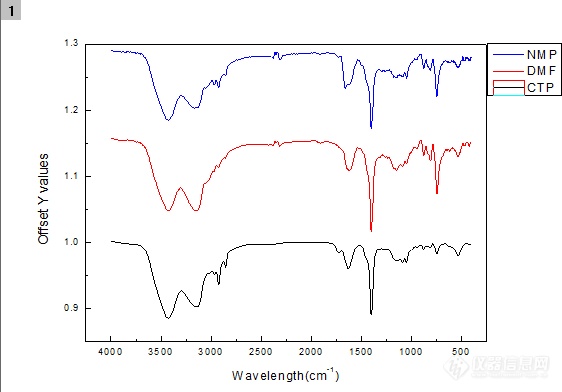
[color=#444444]这是煤沥青和其处理后的红外谱图,请各位大神分析下有什么区别?能得出哪些信息,任何信息均可,最好详细点儿,非常感谢![/color][color=#444444][img=,562,392]https://ng1.17img.cn/bbsfiles/images/2019/09/201909300940074289_4083_1849104_3.png!w562x392.jpg[/img][/color]
现有40件天然沥青矿,需要作四组份分析。
大家好,请问谁用液相色谱做过沥青的族组成分析或者有没有这方面的文献?
哈哈,本版主从火星回来啦~~~~http://simg.instrument.com.cn/bbs/images/brow/em09502.gif有奖讨论,参与有奖:你的近红外预测值与标准方法分析数据可比吗?你是怎么评价你的近红外预测值是否满足应用需求呢?是通过与标准方法分析数据比较吗?是完全依赖模型的预测偏差吗?标准方法的分析精度是ASTM标准提供的,还是多次实验计算的标准偏差呢?近红外预测值满足标准方法误差要求吗?近红外预测值大于标准方法误差要求,又如何判断数据是否可以接受呢?大家有什么关于近红外数据方面的心得和疑惑,都一起来讨论讨论吧!http://simg.instrument.com.cn/bbs/images/brow/em09505.gif
【讲座预告】基于反射技术的红外光谱分析方法对红外光谱来说,常规的透射分析分析方法已经远远不能满足现在样品多样化的要求。针对没的的样品要设计与之相适应的分析方法,不仅可以得到更加准确的结果,而且可能有效地节省分析时间,简化分析过程。但同时,在分析方法的完善及相关资料的全面性上来说,其它的分析方法还无法与透射法相比,但随着反射法硬件及分析方法的完善,反射分析方法正越来越多地受到重视,本讲座就对利用反射原理来进行样品分析的衰减全反射技术、漫反射技术及镜面反射技术做一个简单的介绍。本讲座分衰减全反射技术、漫反射技术及镜面反射技术三部分。讲座即将上线,大家猜猜:主讲专家会是论坛里何方人物? ——下周一揭晓。

[align=center][font='times new roman'][size=16px]乳化沥青[/size][/font][font='times new roman'][size=16px]的[/size][/font][font='times new roman'][size=16px]加速[/size][/font][font='times new roman'][size=16px]稳定性分析[/size][/font][/align][font='times new roman'][size=16px]沥青是由化学成分复杂的多种高分子组成的混合物,具有独特的流变性能。因其良好的粘结性、抗老化性和防水能力,长期以来被广泛地用于防水和[/size][/font][url=https://baike.baidu.com/item/%E5%AF%86%E5%B0%81%E6%9D%90%E6%96%99/9769370][font='times new roman'][size=16px]密封材料[/size][/font][/url][font='times new roman'][size=16px]、道路修补等。[/size][/font][font='times new roman'][size=16px]乳化沥青是[/size][/font][url=https://baike.baidu.com/item/%E6%B2%A5%E9%9D%92/2225284][font='times new roman'][size=16px]沥青[/size][/font][/url][font='times new roman'][size=16px]和[/size][/font][url=https://baike.baidu.com/item/%E4%B9%B3%E5%8C%96%E5%89%82/2531692][font='times new roman'][size=16px]乳化剂[/size][/font][/url][font='times new roman'][size=16px]在一定工艺作用下,生成水包油或油包水的液态沥青。[/size][/font][font='times new roman'][size=16px]乳化沥青主要由沥青、乳化剂、稳定剂和水等组分所组成。在众多的道路建设应用中,乳化沥青提供了一种比热沥青更为安全、节能和环保的系统,因为这种工艺避免了高温操作、加热和有害排放。[/size][/font][font='times new roman'][size=16px][color=#333333]本文应用LUMiSizer[/color][/size][/font][font='times new roman'][size=16px][color=#333333][/color][/size][/font][font='times new roman'][size=16px][color=#333333]611[/color][/size][/font][font='times new roman'][size=16px][color=#333333]分散体系分析仪,[/color][/size][/font][font='times new roman'][size=16px]探讨在[/size][/font][font='times new roman'][size=16px]不同[/size][/font][font='times new roman'][size=16px]温度、相同乳化沥青的分离[/size][/font][font='times new roman'][size=16px]稳定性[/size][/font][font='times new roman'][size=16px]。[/size][/font][font='times new roman'][size=16px][color=#333333]一、[/color][/size][/font][font='times new roman'][size=16px][color=#333333]实验[/color][/size][/font][font='times new roman'][size=16px][color=#333333]目的[/color][/size][/font][font='times new roman'][size=16px]通过LUMiSizer[/size][/font][font='times new roman'][size=16px][/size][/font][font='times new roman'][size=16px]611[/size][/font][font='times new roman'][size=16px]分散体系分析仪[/size][/font][font='times new roman'][size=16px]分析乳化沥青A、B、C样品分别在2[/size][/font][font='times new roman'][size=16px]5[/size][/font][font='times new roman'][size=16px]℃[/size][/font][font='times new roman'][size=16px]和6[/size][/font][font='times new roman'][size=16px]0[/size][/font][font='times new roman'][size=16px]℃[/size][/font][font='times new roman'][size=16px]条件下的分离情况。[/size][/font][font='times new roman'][size=16px]二、实验[/size][/font][font='times new roman'][size=16px]准备[/size][/font][font='times new roman'][size=16px][color=#333333]1.实验仪器:[/color][/size][/font][font='times new roman'][size=16px][color=#333333] [/color][/size][/font][font='times new roman'][size=16px][color=#333333]LUMiSizer[/color][/size][/font][font='times new roman'][size=16px][color=#333333][/color][/size][/font][font='times new roman'][size=16px][color=#333333]611[/color][/size][/font][font='times new roman'][size=16px][color=#333333]分散体系分析仪[/color][/size][/font][font='times new roman'][size=16px][color=#333333]。[/color][/size][/font][font='times new roman'][size=16px][color=#333333]2.实验条件:[/color][/size][/font][font='times new roman'][size=16px][color=#333333]NIR近红外光源、2300倍重力加速度,在25℃条件下测试90min, [/color][/size][/font][font='times new roman'][size=16px][color=#333333] NIR近红外光源、2300倍重力加速度,在60℃条件下测试90min。[/color][/size][/font][font='times new roman'][size=16px][color=#333333]三[/color][/size][/font][font='times new roman'][size=16px][color=#333333]、[/color][/size][/font][font='times new roman'][size=16px][color=#333333]实验步骤[/color][/size][/font][font='times new roman'][size=16px][color=#333333]1.样品[/color][/size][/font][font='times new roman'][size=16px][color=#333333]A、[/color][/size][/font][font='times new roman'][size=16px][color=#333333]B[/color][/size][/font][font='times new roman'][size=16px][color=#333333]、[/color][/size][/font][font='times new roman'][size=16px][color=#333333]C[/color][/size][/font][font='times new roman'][size=16px][color=#333333]分别在[/color][/size][/font][font='times new roman'][size=16px][color=#333333]25℃[/color][/size][/font][font='times new roman'][size=16px][color=#333333]、[/color][/size][/font][font='times new roman'][size=16px][color=#333333]60[/color][/size][/font][font='times new roman'][size=16px][color=#333333]℃[/color][/size][/font][font='times new roman'][size=16px][color=#333333]条件下预热10 分钟。[/color][/size][/font][font='times new roman'][size=16px][color=#333333]2.[/color][/size][/font][font='times new roman'][size=16px][color=#333333]搅拌[/color][/size][/font][font='times new roman'][size=16px][color=#333333]样品[/color][/size][/font][font='times new roman'][size=16px][color=#333333],[/color][/size][/font][font='times new roman'][size=16px][color=#333333]使其混合均匀,用注射器取样装入P[/color][/size][/font][font='times new roman'][size=16px][color=#333333]C[/color][/size][/font][font='times new roman'][size=16px][color=#333333] [/color][/size][/font][font='times new roman'][size=16px][color=#333333]2mm样品管中。[/color][/size][/font][font='times new roman'][size=16px][color=#333333]3.样品管放入[/color][/size][/font][font='times new roman'][size=16px][color=#333333]LUMiSizer[/color][/size][/font][font='times new roman'][size=16px][color=#333333][/color][/size][/font][font='times new roman'][size=16px][color=#333333]分散体系分析仪[/color][/size][/font][font='times new roman'][size=16px][color=#333333]中[/color][/size][/font][font='times new roman'][size=16px][color=#333333]进行测试。[/color][/size][/font][font='times new roman'][size=16px][color=#333333]四、实验数据[/color][/size][/font][font='times new roman'][size=16px][color=#333333]讨论[/color][/size][/font][img]https://ng1.17img.cn/bbsfiles/images/2021/11/202111121645454058_7280_5427429_3.png[/img][font='times new roman'][size=16px][color=#333333] [/color][/size][/font][font='times new roman'][size=16px][color=#333333] [/color][/size][/font][font='times new roman'][size=16px][color=#333333]上[/color][/size][/font][font='times new roman'][size=16px][color=#333333]图为样品[/color][/size][/font][font='times new roman'][size=16px][color=#333333]A、[/color][/size][/font][font='times new roman'][size=16px][color=#333333]B[/color][/size][/font][font='times new roman'][size=16px][color=#333333]、[/color][/size][/font][font='times new roman'][size=16px][color=#333333]C[/color][/size][/font][font='times new roman'][size=16px][color=#333333]在NIR近红外光源、[/color][/size][/font][font='times new roman'][size=16px][color=#333333]2300倍重力加速度,[/color][/size][/font][font='times new roman'][size=16px][color=#333333]25[/color][/size][/font][font='times new roman'][size=16px][color=#333333]℃条件下测试[/color][/size][/font][font='times new roman'][size=16px][color=#333333]9[/color][/size][/font][font='times new roman'][size=16px][color=#333333]0min后的透光率指纹图谱。图中红色谱线表示实验开始时的谱线,绿色谱线表示结束时的最后一条谱线。[/color][/size][/font][font='times new roman'][size=16px][color=#333333]由样品A、B、C的透光率指纹图谱可以看出,在25℃条件下,[/color][/size][/font][font='times new roman'][size=16px][color=#333333]样品B的分离[/color][/size][/font][font='times new roman'][size=16px][color=#333333]效果[/color][/size][/font][font='times new roman'][size=16px][color=#333333]与样品A、C相比较弱。[/color][/size][/font][img]https://ng1.17img.cn/bbsfiles/images/2021/11/202111121645456576_1950_5427429_3.png[/img][font='times new roman'][size=16px][color=#333333]上图为样品A、B、C在NIR近红外光源、2300倍重力加速度,[/color][/size][/font][font='times new roman'][size=16px][color=#333333]60[/color][/size][/font][font='times new roman'][size=16px][color=#333333]℃条件下测试90min后的透光率指纹图谱。图中红色谱线表示实验开始时的谱线,绿色谱线表示结束时的最后一条谱线。[/color][/size][/font][font='times new roman'][size=16px][color=#333333]由样品A、B、C的透光率指纹图谱可以看出,在[/color][/size][/font][font='times new roman'][size=16px][color=#333333]60[/color][/size][/font][font='times new roman'][size=16px][color=#333333]℃条件下,样品[/color][/size][/font][font='times new roman'][size=16px][color=#333333]C[/color][/size][/font][font='times new roman'][size=16px][color=#333333]的分离效果与样品A、[/color][/size][/font][font='times new roman'][size=16px][color=#333333]B[/color][/size][/font][font='times new roman'][size=16px][color=#333333]相比较弱[/color][/size][/font][font='times new roman'][size=16px][color=#333333]。[/color][/size][/font][img]https://ng1.17img.cn/bbsfiles/images/2021/11/202111121645459330_9543_5427429_3.png[/img][font='times new roman'][size=16px] [/size][/font][font='times new roman'][size=16px] [/size][/font][font='times new roman'][size=16px][color=#333333]上图为样品[/color][/size][/font][font='times new roman'][size=16px][color=#333333]A[/color][/size][/font][font='times new roman'][size=16px][color=#333333]、[/color][/size][/font][font='times new roman'][size=16px][color=#333333]B[/color][/size][/font][font='times new roman'][size=16px][color=#333333]、[/color][/size][/font][font='times new roman'][size=16px][color=#333333]C[/color][/size][/font][font='times new roman'][size=16px][color=#333333]的分离指数柱状图。[/color][/size][/font][font='times new roman'][size=16px][color=#333333]分离[/color][/size][/font][font='times new roman'][size=16px][color=#333333]指数[/color][/size][/font][font='times new roman'][size=16px][color=#333333]柱状图,横坐标表示样品编号,纵坐标表示[/color][/size][/font][font='times new roman'][size=16px][color=#333333]分离[/color][/size][/font][font='times new roman'][size=16px][color=#333333]性指数。[/color][/size][/font][font='times new roman'][size=16px][color=#333333]分离[/color][/size][/font][font='times new roman'][size=16px][color=#333333]指数越大则表示样品相对越不稳定。[/color][/size][/font][font='times new roman'][size=16px][color=#333333]样品的[/color][/size][/font][font='times new roman'][size=16px][color=#333333]分离指数[/color][/size][/font][font='times new roman'][size=16px][color=#333333]排序会因为实验时长的不同有差异[/color][/size][/font][font='times new roman'][size=16px][color=#333333]。[/color][/size][/font][font='times new roman'][size=16px][color=#333333]从上图可以直观的看出[/color][/size][/font][font='times new roman'][size=16px][color=#333333]25℃条件下[/color][/size][/font][font='times new roman'][size=16px][color=#333333],样品[/color][/size][/font][font='times new roman'][size=16px][color=#333333]B[/color][/size][/font][font='times new roman'][size=16px][color=#333333]的分离指数最小。样品A的分离指数最大,相对分离程度越大;[/color][/size][/font][font='times new roman'][size=16px][color=#333333]60[/color][/size][/font][font='times new roman'][size=16px][color=#333333]℃条件下,样品[/color][/size][/font][font='times new roman'][size=16px][color=#333333]C[/color][/size][/font][font='times new roman'][size=16px][color=#333333]的分离指数最小。样品[/color][/size][/font][font='times new roman'][size=16px][color=#333333]B[/color][/size][/font][font='times new roman'][size=16px][color=#333333]的分离指数最大,相对分离程度越大。[/color][/size][/font][font='times new roman'][size=16px][color=#333333]五、总结[/color][/size][/font][font='times new roman'][size=16px][color=#333333]1. [/color][/size][/font][font='times new roman'][size=16px][color=#333333]LUMiSizer[/color][/size][/font][font='times new roman'][size=16px][color=#333333][/color][/size][/font][font='times new roman'][size=16px][color=#333333]分散体系分析仪[/color][/size][/font][font='times new roman'][size=16px][color=#333333]可以[/color][/size][/font][font='times new roman'][size=16px][color=#333333]快速测试[/color][/size][/font][font='times new roman'][size=16px][color=#333333]不同温度下的[/color][/size][/font][font='times new roman'][size=16px][color=#333333]乳化沥青[/color][/size][/font][font='times new roman'][size=16px][color=#333333]分离过程。[/color][/size][/font][font='times new roman'][size=16px][color=#333333]2[/color][/size][/font][font='times new roman'][size=16px][color=#333333]. 利用865 nm的近红外波长,可以分辨肉眼无法观察的样品。[/color][/size][/font][font='times new roman'][size=16px][color=#333333]3[/color][/size][/font][font='times new roman'][size=16px][color=#333333].[/color][/size][/font][font='times new roman'][size=16px][color=#333333] [/color][/size][/font][font='times new roman'][size=16px][color=#333333]LUMiSizer[/color][/size][/font][font='times new roman'][size=16px][color=#333333][/color][/size][/font][font='times new roman'][size=16px][color=#333333]分散体系分析仪可以同时测试12个样本,成为一种快捷有效的工具。[/color][/size][/font][font='times new roman'][size=16px][color=#333333]4[/color][/size][/font][font='times new roman'][size=16px][color=#333333].[/color][/size][/font][font='times new roman'][size=16px][color=#333333] [/color][/size][/font][font='times new roman'][size=16px][color=#333333]多波长(近红外[/color][/size][/font][font='times new roman'][size=16px][color=#333333]8[/color][/size][/font][font='times new roman'][size=16px][color=#333333]65[/color][/size][/font][font='times new roman'][size=16px][color=#333333]nm[/color][/size][/font][font='times new roman'][size=16px][color=#333333]+蓝[/color][/size][/font][font='times new roman'][size=16px][color=#333333]光4[/color][/size][/font][font='times new roman'][size=16px][color=#333333]10[/color][/size][/font][font='times new roman'][size=16px][color=#333333]nm[/color][/size][/font][font='times new roman'][size=16px][color=#333333])[/color][/size][/font][font='times new roman'][size=16px][color=#333333]灵活的应用于[/color][/size][/font][font='times new roman'][size=16px][color=#333333]样品[/color][/size][/font][font='times new roman'][size=16px][color=#333333]性能测试[/color][/size][/font][font='times new roman'][size=16px][color=#333333],[/color][/size][/font][font='times new roman'][size=16px][color=#333333]为用户提供全方位的[/color][/size][/font][font='times new roman'][size=16px][color=#333333]研究[/color][/size][/font][font='times new roman'][size=16px][color=#333333]体验[/color][/size][/font][font='times new roman'][size=16px][color=#333333]。[/color][/size][/font]
自从[url=https://insevent.instrument.com.cn/t/1p][color=#3333ff]近红外光谱[/color][/url]分析最初在我国应用,到现在已经有20个春秋了。这期间尽管走过了许多风风雨雨,现在我国已经有了自己开发的各种类型[url=https://insevent.instrument.com.cn/t/1p][color=#3333ff]近红外光谱仪[/color][/url]器,应用水平有了很大的提高,但依然存在一些问题。我们只有充分认识[url=https://insevent.instrument.com.cn/t/1p][color=#3333ff]近红外光谱[/color][/url]分析方法的不足,才能更好地使用它。为此,借这块宝地,请大家谈谈[url=https://insevent.instrument.com.cn/t/1p][color=#3333ff]近红外光谱[/color][/url]分析方法的主要弱点,它的死穴在哪里,谢谢。
做过工业分析的会经常遇到这样的问题,塑胶表面残留油污,最快的分析方法就是红外光谱分析。1、油污含量比较多,呈珠状,用干净KBr片在塑胶表面轻轻贴一下,将沾有油污的KBr放在红外显微镜下透射扫描,并在空白KBr上扣背景;2、油污含量很少,在强光下看见彩色痕迹,用正己烷或石油醚轻轻洗刷污染区域,将溶剂用干燥气体吹,浓缩至几个ml时,用镊子沾取,滴在KBr片上做透射扫描,并在空白KBr上扣背景。
目前,快速分析煤质的方法主要有活化中子法、电容法、微波法和双能,射线衰减法等。这些方法具有一定的优点,能快速分析燃煤成分,但是它们只能对燃煤的一个或几个指标进行测量,且具有一定的放射危险性。 利用红外线测量原理分析煤质是目前快速分析煤质的一种新手段。它能快速准确地对燃煤进行全面的分析,而且具有样品准备时间短、信噪比高、非破坏性、能在非接触的条件下进行测量及无放射性等优点,是煤质快速分析技术的一个研究热点。 一、原理 1.1基本原理 在有机物及部分无机物分子中,化学键结合的各种集团(如C=C、N=C、O=C、0=H、N=H)的运动(伸缩、振动、弯曲等)都有它固定的振动频率。当受到红外线照射时,分子被激发而产生振动,同时光的一部分能量被吸收,测量其吸收光可以得到复杂的图谱,这种图谱包含了被测物质的特征信息。被测物质的每一种成分都有特定的吸收特性,就像每一个人都有唯一的指纹。通过图谱解析,可以获得这种成分的含量。燃煤的某一种成分含量越高,对特定波长的红外光吸收能力就越强。 收能力就越强。图1主要描述了四种煤样的三种主要无机物和有机物(芳香族、脂肪氢、甲基或经基)在所对应波长处不同的吸收特性。其中T为透射率,log(1/T)是获得透射率的方式。 傅里叶变换光谱技术可以保证信号的稳定性,减轻传统红外测量所遇到的噪声干扰问题;而相对于单色光,干涉光更能测量煤粉中的各种成分含量。所以,对煤质的红外光谱分析是以傅里叶变换红外光谱干涉仪(FT-MIR)为基础的。傅里叶变换漫反射红外干涉光谱仪分析煤质成分装置。
红外光谱定量分析方法有哪些?
JB/T9359.1-1999 红外线气体分析器技术条件JB/T9359.2-1999 红外线气体分析器试验方法
高频红外碳硫分析方法的英文简称是什么?如原子吸收法为AAS,原子荧光光谱法AFS。请赐教!
红外光谱分析制样方法在红外光谱分析的具体操作中,对于固体样品,常用的制样方法有以下四种:(1)压片法,是把固体样品的细粉,均匀地分散在碱金属卤化物中并压成透明薄片的一种方法;(2)粉末法,是把固体样品研磨成2μm以下的粉末,悬浮于易挥发溶剂中,然后将此悬浮液滴于KBr片基上铺平,待溶剂挥发后形成均匀的粉末薄层的一种方法;(3)薄膜法,是把固体试样溶解在适当的的溶剂中,把溶液倒在玻璃片上或KBr窗片上,待溶剂挥发后生成均匀薄膜的一种方法;(4)糊剂法,是把固体粉末分散或悬浮于石蜡油等糊剂中,然后将糊状物夹于两片KBr等窗片间测绘其光谱[1]。其中最常用的是压片法,但此法常因样品浓度不合适或因片子不透明等问题需要一再返工。 对于液体样品,常用的制样方法有以下三种:(1)液膜法,是在可拆液体池两片窗片之间,滴上1~2滴液体试样,使之形成一薄的液膜[2];(2)溶液法,是将试样溶解在合适的溶剂中,然后用注射器注入固定液体池中进行测试;(3)薄膜法,用刮刀取适量的试样均匀涂于窗片上,然后将另一块窗片盖上,稍加压力,来回推移,使之形成一层均匀无气泡的液膜。其中最常用的是液膜法,此法所使用的窗片是由整块透明的溴化钾(或氯化钠)晶体制成,制作困难,价格昂贵,稍微使用不当就容易破裂,而且由于长期使用也会被试样中微量水分将其慢慢侵蚀,到一定时候这对窗片也就报废了。 现在采用溴化钾压片作片基,在得到同等效果图谱的情况下,降低了重新压片的次数,减少了清洗液体池和窗片的时间,避免了窗片破裂和损耗的可能性,而且此方法成本很低。[img]http://ng1.17img.cn/bbsfiles/images/2006/06/200606272220_20668_1614961_3.gif[/img]
自从[url=https://insevent.instrument.com.cn/t/1p][color=#3333ff]近红外光谱[/color][/url]分析最初在我国应用,到现在已经有20个春秋了。 现在我国已经有了自己开发的各种类型[url=https://insevent.instrument.com.cn/t/1p][color=#3333ff]近红外光谱仪[/color][/url]器,应用水平有了很大的提高,但远没有达到普及程度。为此,借这块宝地,请大家谈谈[url=https://insevent.instrument.com.cn/t/1p][color=#3333ff]近红外光谱[/color][/url]分析方法的到底有哪些优点,有什么优势,让更多人了解它,使用它!谢谢。
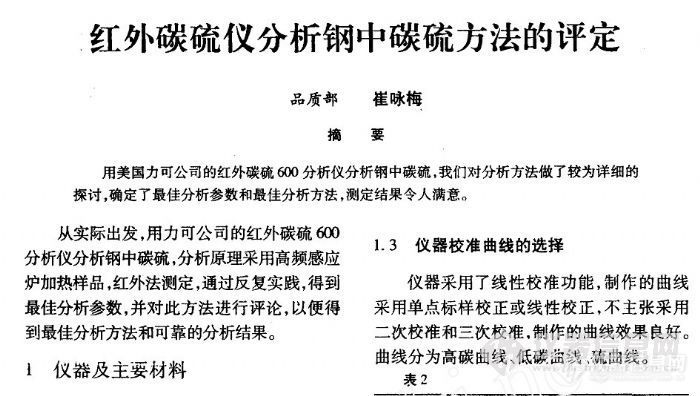
红外碳硫仪分析钢中碳硫方法的评定-----这个资料给大家分享下http://ng1.17img.cn/bbsfiles/images/2011/09/201109132112_316304_1622447_3.jpg
滤光片式近红外成分分析仪价格低,一般用于专一对象,像日常的化验室或在线分析,广泛应用于食品、农业及化学工业等多种领域。滤光片式近红外成分分析仪一般配有多个近红外干涉滤光片,允许特定波长的光通过。我以前做过好多全谱分析的,用的是赛默飞世尔科技(Thermo Fisher Scientific)的AntarisII傅立叶变换近红外(FT-NIR)光谱仪和布鲁克的一个,但对于仅有几个滤光片的(对应几个信号值)除多元线性回归MLR,还有其它方法适合吗?个人感觉 像PCR和PLS 对几个滤光片这种 是不是就没有所谓的主成分了,它本身变量就很少,希望有经验的专家朋友不惜赐教!
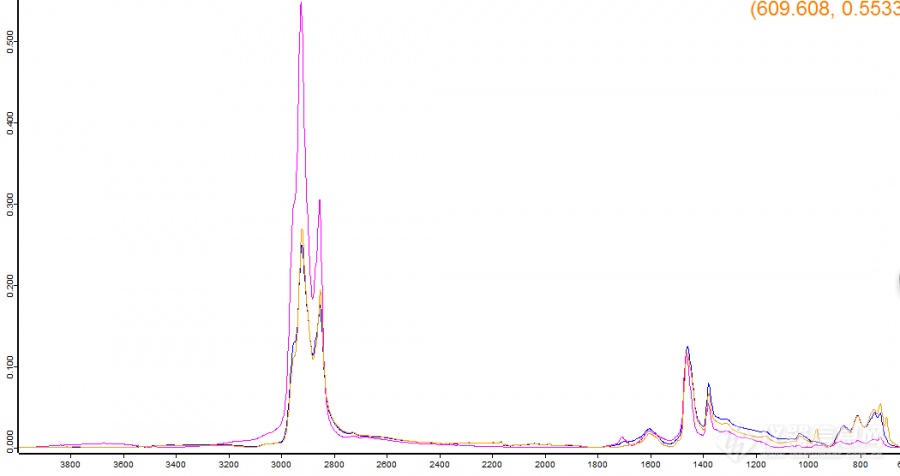
[color=#444444]如题,在用红外光谱做沥青检测时,发现红外谱图在1800-2400之前出现波浪形小峰,有时有,有的时候没有,请教一下各位,具体是什么原因产生的呢?具体见下图:完整的红外图谱和1800-2400之间放大的图谱。[/color][color=#444444][img=,690,364]https://ng1.17img.cn/bbsfiles/images/2019/08/201908121341325783_9117_1752342_3.png!w690x364.jpg[/img][img=,690,295]https://ng1.17img.cn/bbsfiles/images/2019/08/201908121341330723_4397_1752342_3.png!w690x295.jpg[/img][/color]
[font=宋体]馏程是炼化生产过程物料的重要参数指标,馏程测定是炼厂化验室最繁重的工作任务之一。采用[url=https://insevent.instrument.com.cn/t/1p][color=#3333ff]近红外光谱[/color][/url]分析技术可以测定馏程,替代传统分析方法,减轻化验室工作压力。从应用实践来看,采用[url=https://insevent.instrument.com.cn/t/1p][color=#3333ff]近红外光谱[/color][/url]分析技术测定初馏点和终馏点误差较大,主要是由于决定初馏点和终馏点的组分在样品中的含量很低,而且与样品的本底接近,比较难以确定它们的数学关系。[/font]
请教大家用红外碳硫仪器对钛合金的碳含量测定的分析方法~
红外分析中固体样品有哪些制样方法
这是一片采用傅立叶近红外来分析黄酒品质和酒龄的博士论文,对近红外的基本原理,建模方法等都有较好和深入的阐述,相信对大家定有帮助。[~96995~]


 我要推广仪器
 下载APP
下载APP