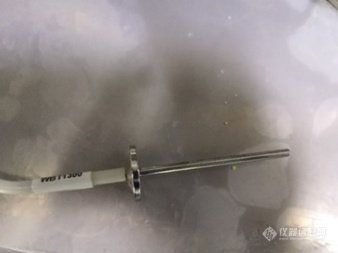
[align=center][size=16px][b]流化床在线设备改造[/b][/size][/align]常规的顶喷式制粒流化床的主要组成系统分为温度控制系统、喷雾系统以及其他控制系统等。主要的结构有底锅、喷嘴、空气进出口、滤袋、取样口等,需要调整的工艺参数比较少,因此操作比较简单。在制粒过程中,粘合剂在蠕动泵和压缩空气的作用下经过喷嘴喷到处于流化状态的物料上,使得粉末在粘合剂的作用下和周围粉末聚并成粒子核,粒子核与粒子核之间慢慢形成比较大的颗粒。继续向流化床内部喷入粘合剂,使得颗粒和颗粒之间,颗粒与粒子核之间发生聚并作用形成更大的颗粒。同样,粘合剂喷入量过少,在进风量和温度等工艺参数的影响下,聚并的颗粒也会破碎,变成小颗粒和小的粒子核。颗粒生长过程如下。[img]https://ng1.17img.cn/bbsfiles/images/2020/09/202009031750279617_8904_3890113_3.jpeg[/img]本实验采用的是山东新马制药装备有限公司的实验型流化床(LGL 002),设备实物图如上图。此流化床设备操作简单方便,但是缺乏信息采集装置,不能及时准确地得到颗粒的水分含量,而且制粒过程中需要进行操作的实时工艺参数数据也不能够及时记录,这样就无法对每一时刻的工艺参数数据与颗粒的水分含量进行关联分析,影响颗粒水分含量的关键工艺参数不能掌握,对制粒工艺也就不能有更为充分的理解。为了及时获取相关的颗粒水分信息和工艺参数信息,需要对流化床进行改造。安装[url=https://insevent.instrument.com.cn/t/1p][color=#3333ff]近红外光谱仪[/color][/url]为了获得流化床制粒过程中颗粒的实时水分数据,需要在流化床设备上添加[url=https://insevent.instrument.com.cn/t/1p][color=#3333ff]近红外光谱仪[/color][/url]用于实时在线获取颗粒的[url=https://insevent.instrument.com.cn/t/1p][color=#3333ff]近红外光谱[/color][/url]数据。NIRS在线分析光谱采集方式主要有接触式和非接触式两种,非接触式主要通过从流化床的视镜进行对颗粒的采谱,接触式是将近红外探头安装到流化床底锅内部,直接与颗粒接触进行采谱。本文选用微型[url=https://insevent.instrument.com.cn/t/1p][color=#3333ff]近红外光谱仪[/color][/url](MicroNIR PAT-U)在流化床制粒过程中采集颗粒的光谱数据进行水分含量的在线监测。与传统的近红外仪器相比,MicroNIR PAT-U体积较小、方便携带、质量较轻,对生产过程不会产生太大影响,因此在实际生产中适合用来对颗粒进行监测。温度对近红外仪器具有较显著的影响[50],同一个仪器在不同的温度条件下采集到的光谱也会所差异。流化床内温度比较高,并且随着实验过程物料温度在不断变化,如果直接将近红外探头与物料进行接触,采集到的光谱会有较大的误差,对实验结果的准确性也会产生影响。因此,为了尽可能地减少温度对近红外仪器的影响,将MicroNIR PAT-U外接探头,让近红外仪器不与物料直接接触,从而可以采集到较为稳定和准确的光谱数据。MicroNIR PAT-U与探头的连接方式为螺纹连接,在距离探头顶端与底锅厚度相同的地方安装材料为聚四氟乙烯的密封圈,保证采集光谱过程中的密封性与可靠性。MicroNIR PAT-U和探头的整体安装图如下图所示。为了采集颗粒的光谱,要将近红外探头伸入流化床内部,这就需要在流化床的底锅上进行打孔,孔的直径要比探头的直径大0.2~0.3mm,使得生产过程中探头不会发生晃动,保证光谱采集位置的一致性。孔的位置要尽量与取样口保持在同一条水平线上,这样可以减小近红外仪器采集的光谱数据与物料离线测量的数据在外部环境条件下的差异,尽可能减少采集数据的误差。探头具体的安装位置如下图所示。近红外探头吹扫装置在物料未成粒之前,粉末状的物料具有很强的粘附性,随着实验的进行,粉末会粘附在近红外探头上,从而对光谱的正确性产生严重的影响。这就要求在制粒过程中及时地清除掉粘附在探头上的粉末以消除这种不利影响。然而,频繁地把探头拿出来手动擦净不但会影响探头地使用寿命,而且由于光谱地采集是一个连续的过程,这样做反而会更加影响光谱数据的准确性。因此,流化床上安装近红外探头吹扫装置是非常有必要的。上节已经提到,近红外探头伸入流化床的长度与底锅的厚度一样,因此,近红外探头与底锅内壁是平行的。在近红外探头孔内径的下方孔壁上开一个直径为5mm的小孔,设计一个端部带螺纹的空心装置,外部接上吹入压缩空气的橡胶管,用于在制粒过程中对探头的吹扫,使物料尽量少的粘附在探头上。吹扫装置的原理示意图及安装实物图如图所示。吹扫装置要设置适当的吹扫频率和吹扫时间,并不是频率越快、时间越长越好。吹扫频率太快,每次吹扫时间过长,可能在探头采集光谱的时间段,刚好物料被吹扫装置吹跑,使得近红外探头实际采集的为空气的光谱,这会对结果造成较大的误差。近红外探头采集光谱的时间大约在2s左右,因此设置吹扫装置的脉冲频率设置在15s吹一次,每次吹1s为最适宜频率。工艺参数采集装置流化床制粒过程中使用的工艺参数比较少,因此每个工艺参数都对颗粒质量属性产生重要的影响。在制粒过程中,流化床的主要工艺参数有雾化压力、蠕动泵流量、进风温度、排风温度、进风量和物料温度。为了获取这些工艺参数数据,需要在流化床的相应位置上安装风量传感器、温度传感器、流速计、压力表等。流化床工艺参数采集装置的原理示意图如下图所示。进风温度、排风温度、风量的传感器,流量计和压力表都是安装在流化床系统内部,只有物料温度传感器需要在制粒的过程中将传感器加入到流化床内部。物料温度传感器采用热电偶式,为了测量流化床制粒过程中物料的温度,也需要在底锅上进行打孔,使温度传感器伸入到流化床内部,通过与物料直接接触的方式感受物料的温度并转换成可用于输出的信号。传感器孔的位置尽可能与近红外测量的位置在同一水平线上,保证测量的物料温度与近红外探头测量的物料是同一状态下的。物料温度传感器如下图所示。 [img]https://ng1.17img.cn/bbsfiles/images/2020/09/202009031750281516_7229_3890113_3.png[/img][img]https://ng1.17img.cn/bbsfiles/images/2020/09/202009031750284280_7065_3890113_3.png[/img]物料温度传感器暴露在外部,容易受外部环境的影响。为了确保传感器的稳定性和可靠性,保证在制粒过程中传感器不会发生晃动,需要对物料温度传感器增加固定装置。采用管夹作为温度传感器的增固装置,如上图所示。
[align=center][size=16px][b]流化床制粒[/b][/size][size=16px][b]发展现状[/b][/size][/align]药品是人们常备的不可或缺的日常用品。近年来,随着国民生活水平的提高,人们对药品质量和药物安全问题广泛关注,制药领域也随之越来越多的进入到我们的视野中。长期以来,制药行业都采用传统的方式进行生产,无论是自动化、信息化水平还是认知观念水平都与其他行业存在着一定的差距。“十三五”规划以来,国家大力发展智能制造,制药行业作为制造业的一部分,需要紧跟发展潮流,朝着信息化、智能化方向发展。固体制剂是目前最常见的剂种之一,其生产过程是将原料通过一系列操作包括粉碎、混合、制粒、包衣及压片等过程转化成药物制剂。无论是制作胶囊还是压片,制粒都是非常重要的关键步骤。制粒是将药物粉末与相关的辅料进行混合,待混合均匀后再喷入润湿剂或者粘合剂,在设备中制成具有颗粒形态的过程。干法制粒和湿法制粒是目前固体制粒中最常用的两种方法[font='calibri'][size=13px][1][/size][/font]。干法制粒不需要使用粘合剂,常用于对水分比较敏感的制剂;湿法制粒是常用的制粒方法,在混合均匀的粉末中喷入粘合剂,将粉末表面打湿,粉末通过粘合剂的媒介作用聚结在一起可以慢慢形成颗粒。流化床制粒是常见的湿法制粒方法之一。流化床制粒过程中使用的工艺参数较少、且操作方法简单,广泛应用于固体制粒中。然而,目前的流化床制粒大多依靠于人工经验,对于制粒过程中颗粒的质量属性的变化都是离线进行分析,严重滞后于生产过程。制粒过程信息不透明,对制粒过程影响因素不能准确把握,容易导致药物疗效达不到预期甚至造成制粒批次的失败。随着计算机信息技术、人工智能、传感器技术的发展,及时获取流化床制粒过程工艺参数与颗粒的关键质量属性,通过数据挖掘出工艺参数变化对于流化床制粒过程的影响,通过质量属性的变化及时调整工艺参数,从而可以大大提高制粒成功率,打破国外技术封锁,实现连续化、智能化生产的目标。针对流化床制粒信息化、自动化水平低,数据采集困难等问题,合理改造设备以及通过机器学习等人工智能算法了解工艺参数的内部机理,达到准确调控,对流化床制粒连续化、智能化生产具有重要指导意义。流化床制粒技术只在一个腔体中就可以完成整个制粒过程。药物粉末和辅料等一次性的投入到密封的腔体中,在腔体内进行混合,直至腔体内的各种物料都混合均匀,接着从底部通入热空气,药物粉末在从下方而来的热空气作用下能够保持悬浮,从而达到理想的流化状态。接着将按照一定比例配成的黏合剂液体在蠕动泵和一定压力的压缩空气作用下,以雾化的形式从喷枪中向流化层喷入,使药物粉末聚结成颗粒。在整个制粒过程中,颗粒只受到流化床内部气流的作用,上下流动,因此形成的颗粒之间的粘合度较低,颗粒密度比较小,粒度比较均匀,并且有较好的可压缩性和流动性。流化床制粒设备的整体情况都大同小异,主要的不同在于雾化的粘合剂喷入的方式。按照喷嘴所在位置的不同,可以大体将流化床分为顶喷式、底喷式和流化床三类,这三类流化床的示意图如下图1-1所示。顶喷式流化床是将喷枪从腔体外部伸入到制粒室中,从流化层的上方自上而下进行喷液。颗粒通过气流的作用上升至喷嘴的位置,雾化的粘合剂从喷嘴喷出并将颗粒包裹起来,颗粒上升到一定的高度后回落,如此往复,顶喷式流化床一般用于制粒。底喷式流化床是喷枪中粘合剂的喷洒方向与进风气流的方向一致,侧喷式流化床的喷嘴安装在制粒室的内壁上,最明显的特点是在其底部安装有布风板,底喷式流化床和侧喷式流化床一般用于包衣。[align=center][font='times new roman']图[/font][font='times new roman']1-[/font][font='times new roman']1 [/font][font='times new roman']制粒[/font][font='times new roman']流化床[/font][font='times new roman']分类[/font][/align][font='times new roman'][size=16px][b]流化床制粒技术研究现状[/b][/size][/font]1959年,美国的Wurst首先提出了流化床技术,该技术以其工艺简单,操作时间短,劳动强度低等特点广泛应用于固体制药领域。我国于上世纪八十年代才引入流化床制粒设备,相对于国外来说起步较晚,因此对于流化床制粒技术的研究也相对较少。石海涛[font='calibri'][size=13px][3][/size][/font]等人使用流化床制粒技术解决了采用传统的湿法制粒批次间颗粒质量属性差异大,制粒终点难以把握的缺点,制出崩解性能良好的甲磺酸吉米沙星片。申楼[font='calibri'][size=13px][4][/size][/font]等人把颗粒的流动性、表面性状和崩解时限作为衡量颗粒质量的标准,采用正交试验的方法确定出流化床制粒的最佳工艺参数。东北大学的王正松[font='calibri'][size=13px][5][/size][/font]以颗粒的粒度为研究对象,建立并验证了流化床制粒最终颗粒粒度的机理模型,并且建立了预测颗粒粒度的回归模型。浙江大学的周家辉[font='calibri'][size=13px][6][/size][/font]针对流化床制粒室温度难以控制的问题,分析了流化床制粒温度影响因素,对流化床进行了热力学分析,并且设计了温度控制器。在国外近几年的研究中,Neugebauer[font='calibri'][size=13px][7][/size][/font]等人针对流化床分层制粒过程中颗粒形成干燥区的问题,提出了一种用于研究各种工艺参数对粒子动力学和工艺稳定性的影响的模型。Hayashi[font='calibri'][size=13px][8][/size][/font]等人对流化床造粒过程中颗粒生长和破碎的机理进行了研究,提出了一种基于离散元法和计算流体动力学相结合的粒子碰撞频率函数的粒子平衡模型。Heidari[font='calibri'][size=13px][9][/size][/font]等人考虑液滴蒸发过程引起的体积变化等因素,综合考虑粘合剂粘性与液滴表面张力的平衡力,建立了流化床制粒过程中液滴蒸发的力学模型,利用该模型研究了不同温度、蒸汽压力、接触角和液滴直径条件下蒸发速率对液滴扩散时间的影响。Teixeira[font='calibri'][size=13px][10][/size][/font]等人研究了提高姜黄素溶解度的多种策略并且以姜黄素为原料,采用流化床制粒法,制备姜黄素颗粒。国外的流化床技术已经取得了一定的成就,然而国内的流化床制粒领域中相关的文献报道却比较少,这种现状对于我们来说既是机遇也是挑战。通过文献可以看出,越来越多的学者都针对流化床制粒工艺进行研究,这也必将会是未来研究流化床制粒技术的一个趋势。
[font='times new roman'][size=16px][b]流化[/b][/size][/font][font='times new roman'][size=16px][b]床[/b][/size][/font][font='times new roman'][size=16px][b]生产[/b][/size][/font][font='times new roman'][size=16px][b]工艺影响因素及研究现状[/b][/size][/font][font='times new roman'][size=16px][b] [/b][/size][/font][font='times new roman'][size=16px][b]流化[/b][/size][/font][font='times new roman'][size=16px][b]床生产[/b][/size][/font][font='times new roman'][size=16px][b]工艺影响因素概述[/b][/size][/font]流化床生产过程的内部机理比较复杂,很多因素都会影响制得颗粒的质量属性。其中,设备、工艺、处方等因素通常会对制粒结果有较大影响。设备因素主要是由于流化床本身造成的,不同的流化床制得的颗粒有所不同;工艺因素是与生产过程中实际操作的工艺参数相关;处方因素是指使用的原辅料性质和粘合剂的性质等有关。(一)设备因素在流化床制粒中,容器材料和形状影响比较大,容器的形状会对粒子的运动轨迹产生影响。流化床设备不但要使得物料可以达到流化状态,还要保证不会黏附在容器内壁上,这样可以使得在制粒过程中避免产生不规则的颗粒以及大量的细粉[font='times new roman'][size=16px][11][/size][/font]。流化床锅体的主要形状是圆锥体,上面比较宽,下面部分比较窄,其样式和内部结果如下图所示。[align=center][font='times new roman'][size=16px] [/size][/font][/align][align=center][font='times new roman'][size=16px]图[/size][/font][font='times new roman'][size=16px]1[/size][/font][font='times new roman'][size=16px]流化[/size][/font][font='times new roman'][size=16px]床锅体图[/size][/font][font='times new roman'][size=16px] [/size][/font][font='times new roman'][size=16px] [/size][/font][font='times new roman'][size=16px]图[/size][/font][font='times new roman'][size=16px]1-[/size][/font][font='times new roman'][size=16px] [/size][/font][font='times new roman'][size=16px]流化[/size][/font][font='times new roman'][size=16px]床锅体内[/size][/font][font='times new roman'][size=16px]部图[/size][/font][/align]锅体一般是用低碳钢304作为材料,并且在锅体内部进行抛光处理。锅体的最底端是进风口,分流板就安装在进风口处,并且在分流板上固定一层不锈钢筛网。Borne等人提出,分流板不会对物料粉末粒子的运动产生影响。(二)工艺因素流化床的工艺因素主要有进风温度、进风量、雾化压力、粘合剂的流速等。流化床的进风温度要保持在合理的范围内,一般设定在25°C~55°C之间。如果进风温度过低,粘合剂不能够及时蒸发从而使得颗粒湿润过度,这样流化床内壁上就会黏附部分物料粉末,从而不能达到较好的流化状态,粒子容易粘成一团;如果进风温度过高,会使得颗粒上的粘合剂过早的被干燥,颗粒上附着的粘合剂变少,从而达不到良好的制粒效果。流化床的进风量也是一个很重要的影响因素之一,合适的风量可以使得物料能够处于很好的流化状态,对使粉末形成颗粒比较有利,提高进风量有利于大颗粒的形成[font='times new roman'][size=16px][13][/size][/font]。若进风量过大,细小颗粒中的粘合剂挥发过快,不能达到良好的粘合作用,使得颗粒的粒度分布比较宽,细粉相对来说也比较多;若进风量较小,颗粒不能够被很好的吹起来形成流化状态,在粘合剂的作用下容易形成粒径很大的颗粒,从而形成很大的一团,造成塌床。雾化压力可以影响喷雾雾滴的大小,雾化压力过低,形成的喷雾的雾滴变大,喷雾范围变小,造成粘合剂在物料中分布不均匀;雾化压力过高则喷雾的雾滴过小,不利于物料良好的流化状态,不能很好的制粒。粘合剂的流速跟流化床制粒室内的湿度有关系,粘合剂流速过高,颗粒不能够被及时干燥,容易有塌床的风险;流速过低时,喷入的粘合剂过少,则会使颗粒的粒径过小,粉末较多,导致制粒效率低下。(三)处方因素物料主要有疏水性和亲水性两种。疏水性物料一般采用干法制粒;亲水性物料由于亲水性的不同也会产生差异。亲水性越强的物料越不容易被粘合剂润湿,因此成粒难度较大,需要提高粘合剂喷入速度[font='times new roman'][size=16px][14][/size][/font]。粘合剂的种类和浓度也会影响粉末的成粒,是流化床制粒中比较重要的工艺[font='times new roman'][size=16px][15][/size][/font]。合适的粘合剂与物料之间具有较高的粘合力,有利于颗粒的形成。粘合剂浓度较高可以有较高的粘合力,制得的颗粒较大;浓度较低则会使得粘合力不够,导致制粒速度变慢,细粉增多。[font='times new roman'][size=16px][b]流化[/b][/size][/font][font='times new roman'][size=16px][b]床生产[/b][/size][/font][font='times new roman'][size=16px][b]工艺研究现状[/b][/size][/font]质量源于设计(Quality by Desigh, QbD)在药物制剂研究中常用的研究方法,通过对生产工艺的理解来对过程进行控制[font='times new roman'][size=16px][16][/size][/font][font='times new roman'][size=16px][17][/size][/font]。在流化床制粒过程中,如果采用不同的工艺参数,则制备出来的颗粒的尺寸、粒径分布、含水量、流动性、可压性和溶解特性等质量属性都会有所不同,从而影响制成的颗粒的最终品质[font='times new roman'][size=16px][18][/size][/font]。已经有不少国内外学者在流化床制粒工艺方面进行了研究。宋顺宗[font='times new roman'][size=16px][19][/size][/font]等人采用正交试验的方法研究了进风温度、雾化压力和包衣液流速等工艺参数对包衣颗粒完整度、效率和成品率的综合影响。余楚钦[font='times new roman'][size=16px][20][/size][/font]等人以进风温度、进风参数、粘合剂流量、雾化压力为自变量采用正交试验的方法,考察这些工艺参数对颗粒的粒度、流动性、表面性状及崩解时限的影响。比利时布鲁塞尔自由大学的Rambali [font='times new roman'][size=16px][21][/size][/font]等人研究制粒过程的进风温度、进风速度、喷雾速率和进风湿度等工艺参数,确定了颗粒的理论含水率和液滴尺寸的测量方法,并且用这些工艺参数作为变量,建立了与粒径尺寸的回归模型。Aleksić [font='times new roman'][size=16px][22][/size][/font]等人采用响应面分析、多层感知机神经网络和偏最小二乘法对流化床制粒过程进行了数值模型来设计工艺参数的调节范围,研究表明,粘合剂的粘度会在很大程度上影响颗粒的形状。Bellocq[font='times new roman'][size=16px][23][/size][/font]等人研究了流化床制粒在不同工艺条件下对团聚体结构和功能的影响。Ehlersa[font='times new roman'][size=16px][24][/size][/font]等人在粘合剂流速、流量和进风温度恒定的条件下,研究脉冲喷雾和雾化压力在顶喷式流化床中对颗粒粒径大小的影响,结果表明,雾化压力对粒径的影响取决于入口空气的相对湿度,脉冲喷雾的占空比对最终产品的质量至关重要。目前为止,流化床制粒工艺主要依靠工人的经验,具有较强的主观性,缺乏对工艺参数和质量属性之间的深入理解,很少考虑制粒过程中质量属性的变化,缺乏有效的实时监控手段,同时还有很多的不确定性因素。因此,实施过程监控手段,实时测量流化床制粒过程中的关键质量属性对理解工艺参数对颗粒质量属性的影响具有重要作用。
[align=center][url=https://insevent.instrument.com.cn/t/1p][color=#3333ff]近红外光谱[/color][/url]分析技术应用于流化床[color=#1d1b11]制粒和包衣[/color]过程的研究进展[/align][b][/b][align=left][b]摘要[/b][/align][align=left]目前流化床制粒、包衣技术在我国制药行业中因其具有制得颗粒流动性、压缩成型性好,微丸包衣厚度均匀等诸多优点而受到广泛应用。随着过程分析技术的推广,针对于关键质量属性的在线分析受到越来越多的关注,以采用[url=https://insevent.instrument.com.cn/t/1p][color=#3333ff]近红外光谱[/color][/url]分析技术为代表的过程分析技术可以对流化床制粒、包衣过程进行有效地监测,从而提高产品质量、保证产品安全性。本文针对流化床制粒、包衣过程中水分含量、粒径大小、包衣厚度等关键质量属性,综述了[url=https://insevent.instrument.com.cn/t/1p][color=#3333ff]近红外光谱[/color][/url]分析技术在监测流化床制粒、包衣过程的研究进展,表明[url=https://insevent.instrument.com.cn/t/1p][color=#3333ff]近红外光谱[/color][/url]分析技术可以有效的监测流化床生产过程各关键质量属性。通过综述旨在为我国制药行业的流化床制粒、包衣单元实现自动化控制和智能生产提供参考。[/align][align=left] [/align][align=left][b]关键词:[/b][url=https://insevent.instrument.com.cn/t/1p][color=#3333ff]近红外光谱[/color][/url]技术;流化床制粒;流化床包衣;过程分析技术;在线监测[/align][b]Abstract[/b][align=left]Thetechnologys of fluidized bed granulation and pellets coating are widely used inpharmaceutical industry. Particles made in a fluidized bed have good liquidity,compressibility, and coating thickness of pellets are homogeneous. Near-infraredspectroscopy can real time monitor in fluidbed granulation and coating process, so it can improve the productquality and ensure product security. This review gives research progress of Near-infraredspectroscopy monitoring in fluid bed granulationand coating process, and gives quantitative analysis model of moisture content, particle size and tablet/pelletthickness to realize in-line monitoring and controling.[/align][b][color=black]Key words[/color]:[/b][color=black]Near infraredspectroscopy [/color]Fluidized bed granulation Fluidized bed coating Process analytical technology In-line monitoring[align=left][b]前言[/b][/align]流化床又称沸腾床,其过程为通过气流将物料呈流态化,再喷入雾状液体对物料进行制粒或包衣。该方法可以集混合、制粒、干燥或包衣于一体,与湿法制粒、熔融制粒、包衣锅滚制等传统方法相比具有以下优点[sup][/sup]:工艺简单,生产效率高;在密闭的环境中生产,防止外界环境对物料的污染;制得的颗粒流动性好,粒度均匀、压缩成型性好;包衣厚度均匀,干燥效率高。近年来流化床技术在我国医药行业已得到广泛应用,但目前国内流化床技术(干燥、制粒、包衣)同样存在许多问题,产品关键参数的测定多依靠经验,传统的离线测定方法具有破坏性、昂贵、费时费力,且离线分析会使得参数的检测滞后于生产,检测结果难以反映生产过程的真实状态,因此产品多出现稳定性、均一性较差的问题,影响了最终产品的质量和安全性。目前一致性评价和连续化生产等对参数的在线优化提出了更高的要求。[align=left]美国FDA于2004年以工业指南的方式颁布了Processanalytical technology(PAT),旨在通过过程分析技术(PAT)提高对药品研发、生产和质量全过程更加科学性的控制[sup][/sup]。为保证产品的安全、有效、稳定、均一,近年来,研究出现多种用于流化床制粒和包衣过程的PAT在线分析仪器,以实现对生产过程的在线监控。[color=black]例如,[/color][color=black]3D[/color][color=black]图像分析技术([/color]3D imaging method)用于流化床制粒过程,在线测定颗粒粒径大小[sup][/sup];在流化床微丸包衣过程中,Mož ina等[sup][/sup]研究了数字成像技术(digital imaging)在线监测微丸包衣厚度以及判断微丸粘连问题的可行性。但应用图像分析技术需把颗粒或微丸当作理想的球体计算,难以准确测量颗粒粒径和包衣厚度。此外,聚焦束反射法(focusedbeam reflectance method,FBRM[color=#231f20])作为一种[/color]PAT工具用于监测因粘合剂溶液过量而产生的颗粒凝聚问题以及用于测定粒径大小[sup][/sup];[color=#231f20]Sheahan[/color][color=#231f20]等应用声波发射([/color]acoustic emissions[color=#231f20],[/color]AE)监测流化床顶喷包衣喷嘴的堵塞问题,且进行了用于监测包衣厚度的研究[sup][/sup]。[color=#231f20]FBRM[/color][color=#231f20]广泛应用于结晶过程,而应用在流化床制粒过程中,目前没有相关文件支持[/color][sup][/sup][color=#231f20];声波发射技术监测包衣厚度的可行性还需更深入的研究。为了克服以上分析方法的弊端,我们需要一种更实用的在线分析技术。[/color][color=#231f20]此外,[/color]Tok等[color=#131413][/color][color=#131413]研究了[/color]FBRM[color=#131413]、[/color]AE以及[color=#131413][url=https://insevent.instrument.com.cn/t/1p][color=#3333ff]NIR[/color][/url]S[/color][color=#131413]三种[/color]PAT技术应用于流化床制粒过程在线监测的可行性,在制粒生产过程中,其中AE技术易于受制粒过程中空气流速以及外界因素的影响;FBRM和[color=#131413][url=https://insevent.instrument.com.cn/t/1p][color=#3333ff]NIR[/color][/url]S[/color][color=#131413]的光纤探头易被样品污染,影响在线数据的采集。但许多研究表明[/color][color=#131413],可以通过安装吹扫装置保持[/color][url=https://insevent.instrument.com.cn/t/1p][color=#3333ff]NIR[/color][/url]S探头的清洁。[/align][align=left]目前[url=https://insevent.instrument.com.cn/t/1p][color=#3333ff]近红外光谱[/color][/url]技术(Near-infraredspectroscopy,[url=https://insevent.instrument.com.cn/t/1p][color=#3333ff]NIR[/color][/url]S)作为PAT的有力工具,其波长范围为700-2500nm(14286-4000cm[sup]-1[/sup])之间,主要反映含氢基团(如C-H,O-H,N-H、S-H等)振动的倍频和合频吸收[sup][/sup]。[url=https://insevent.instrument.com.cn/t/1p][color=#3333ff]NIR[/color][/url]S分析样品含量大于千分之一,这符合一般生产要求,且其以分析速度快、非破坏性、无污染、投资少、操作技术要求低等特点在制药行业的应用日趋广泛。本文综述了在线[url=https://insevent.instrument.com.cn/t/1p][color=#3333ff]NIR[/color][/url]S在流化床干燥、制粒和包衣过程中应用,旨在为我国制药行业的流化床制粒、包衣单元实现自动化控制和智能生产提供参考。[/align][b]1 [url=https://insevent.instrument.com.cn/t/1p][color=#3333ff]近红外光谱[/color][/url]应用于流化床制粒干燥过程[/b][align=left]随着计算机技术、光纤和化学计量学的发展,在制药行业质量要求日趋严格的大环境下,发展以[url=https://insevent.instrument.com.cn/t/1p][color=#3333ff]NIR[/color][/url]S为主的在线监测研究势在必行。[url=https://insevent.instrument.com.cn/t/1p][color=#3333ff]NIR[/color][/url]S在线监测流化床制粒干燥过程,连续采集过程中的光谱,可以对过程中颗粒的水分含量、粒径分布以及堆密度等关键参数进行监测[sup][/sup],从而对整个制粒干燥生产过程进行过程控制。[/align][align=left][b]1.1 颗粒的水分含量[/b][/align][align=left]在流化床制粒干燥过程中,颗粒的含水量可影响颗粒的流动性、可压性以及药物的稳定性。且含水量对制粒过程也会产生影响[sup][/sup],若在制粒过程缺少监测控制,易造成物料含水量过高或过低;含水量过高,易结成团块,造成塌床;含水量过低,颗粒的粒径小,会造成颗粒中粉末较多,由此可见,对流化床制粒过程进行过程控制[color=black]是非常重要的。水的[/color]O-H[color=black]伸缩振动一级倍频在[/color]1440 nm[color=black]附近,较强的合频吸收谱带在[/color]1940nm[color=black]附近,在早期,[/color]Rantanen[color=black]等[/color][sup][/sup] [color=black]采用[/color][url=https://insevent.instrument.com.cn/t/1p][color=#3333ff]NIR[/color][/url]S[color=black]对流化床制粒过程中颗粒的含水量进行监测研究,表明测定过程使用与水分相关的波长而去除无关波长信息,可以更准确、更迅速地监测制粒过程中含水量的变化。[/color][/align][align=left][color=black]而且,除了进行水分定量分析监测流化床制粒干燥过程外[/color],还可利用主成分分析(principal component analysis, PCA[color=black])对过程中的多维变量进行降维分析,实现数据的可视化。此外,[/color]Rantanen等还研究了在流化床制粒过程中,利用[url=https://insevent.instrument.com.cn/t/1p][color=#3333ff]NIR[/color][/url]S水分测定,结合过程中温度和湿度的测定对制粒过程的含水量进行监测,以实现制粒过程的控制与监测。以上研究中,是[url=https://insevent.instrument.com.cn/t/1p][color=#3333ff]NIR[/color][/url]S漫反射光纤探头透过流化床制粒机上的视镜来监测制粒过程中含水量的变化。[/align][align=left]除此之外,还可将光纤探头安装到流化床内部进行接触式在线采样。Kona等[color=black]在实验室规模流化床制粒机([/color]1-L)中安装一特制的勺状探头,并在探头上端位置安装压力吹扫装置,待光谱采集完毕后,启动吹扫装置,样品返回流化床[color=#231f20]内继续参加制粒,[/color]并在探头[color=red]等同的[/color]位置收集样品进行一级数据的测定。[color=#231f20]结合偏最小二乘[/color](partial least squares,PLS)算法对流化床制粒过程中样品的含水量进行在线监测,并且结合多维主成分分析(multi-way principal component analysis, MPCA)建立多元统计分析控制方法,对异常批次进行判断。同时研究中对制粒过程中的进风温度和湿度、产品的温度和湿度进行在线监测,通过对生产过程中产品的含水量、温度和湿度的监测以实现实时错误诊断和过程控制。与此类似,Peinado等[sup][/sup][color=#231f20]将[/color][url=https://insevent.instrument.com.cn/t/1p][color=#3333ff]NIR[/color][/url]S光纤探头嵌入到流化床中进行光谱采集,通过监测含水量的变化对生产规模流化床(300-L)干燥终点进行判断。研究中采用标准正态变量变换(Standard normal variate , SNV)预处理方法消除表面散射对[url=https://insevent.instrument.com.cn/t/1p][color=#3333ff]NIR[/color][/url]漫反射光谱的影响,1940nm附近有较强的O-H合频吸收谱带,由此,采用1854-2075 nm波长建立了PLS水分定量模型。为了证明模型的适用性,用外部验证集对模型进行独立验证,并对[url=https://insevent.instrument.com.cn/t/1p][color=#3333ff]NIR[/color][/url]S方法进行方法学验证。与前者的研究相比,后者没有配置吹扫装置,而是通过改变探头的位置和角度保证[url=https://insevent.instrument.com.cn/t/1p][color=#3333ff]NIR[/color][/url]S采集窗口的清洁。[/align][align=left][color=#231f20]此外,[/color][color=#231f20]Mä rk[/color]等[color=#231f20]则通过一旁路系统进行在线[url=https://insevent.instrument.com.cn/t/1p][color=#3333ff]近红外光谱[/color][/url]的采集,由此避免了流化床干燥过程中温度变化对光谱重复性的影响。[/color][/align][align=left] Green等[sup][/sup]研究了探头安装到流化床内进行接触式取样的3种装置对在线[url=https://insevent.instrument.com.cn/t/1p][color=#3333ff]NIR[/color][/url]S水分预测的准确性的影响,颗粒分别在不同规模的流化床干燥器(65-L,300-L,600-L)中进行实验,并研究使用3种不同的取样装置以提高[url=https://insevent.instrument.com.cn/t/1p][color=#3333ff]NIR[/color][/url]S方法的准确性。研究结果表明过程的不均匀性对表面预测的准确度会产生重要影响,此结论适合于易于不均一化的固体颗粒和混悬液系统的在线测量。此外,Heigl等采用实验室规模流化床研究了不同光谱背景和取样方式对PLS回归模型预测准确度的影响。结果显示透过流化床壁(聚甲基丙烯酸甲酯)采集的在线光谱和透过玻璃瓶采集的离线光谱建立的模型,与去除了此两个背景吸收所建立的模型相比,鲁棒性更好;其次,在线光谱建立的模型,与停止设备后取样采集的离线光谱所建立的模型相比,前者的鲁棒性和预测准确度更佳。[/align][align=left][b]1.2 颗粒的粒径大小[/b][/align][align=left][url=https://insevent.instrument.com.cn/t/1p][color=#3333ff]NIR[/color][/url]S不仅包含样品的化学信息(比如水分含量),而且还包含样品的物理信息,比如,颗粒粒径的不同可产生基线偏移。由此,可以根据光谱的基线偏移来检测颗粒粒径的大小。[/align][align=left]在线[url=https://insevent.instrument.com.cn/t/1p][color=#3333ff]NIR[/color][/url]S早期用来监测水分含量,但粒径作为质量控制的关键参数,影响压片过程片重均一性、可压性以及脆碎度等,因此为了进一步保证产品质量,提高生产效率,有必要对粒径进行在线监测。在20世纪90年代,相关研究人员对在线[url=https://insevent.instrument.com.cn/t/1p][color=#3333ff]NIR[/color][/url]S监测颗粒粒径的变化进行了初期探索。Frake等[sup][color=black][/color][/sup][color=black]在生产规模顶喷制粒流化床([/color]40-kg)内安装[url=https://insevent.instrument.com.cn/t/1p][color=#3333ff]NIR[/color][/url]光纤探头,用来连续采集颗粒的光谱信息。[url=https://insevent.instrument.com.cn/t/1p][color=#3333ff]NIR[/color][/url]光纤探头安装在偏下流处产品密度较高的位置以保证探头的清洁;研究中用原始光谱信息来表征颗粒粒径的变化,并绘制出2282nm处吸光度值随时间的变化图,其和粒径随时间变化图具有相似性,但由于颗粒变化模型的复杂性,并未能建立[url=https://insevent.instrument.com.cn/t/1p][color=#3333ff]NIR[/color][/url]S粒径定量模型。[color=black]Rantanen[/color][color=black]等[/color][sup][/sup]在流化床制粒机中采用[color=red]四波长检测器[/color][color=black]对不同等级的微晶纤维素进行[/color][url=https://insevent.instrument.com.cn/t/1p][color=#3333ff]NIR[/color][/url]光谱的采集,其中1740nm和2145nm两波长用于粒径的测定,并利用[url=https://insevent.instrument.com.cn/t/1p][color=#3333ff]NIR[/color][/url]S吸光度值区分微晶纤维素的等级。研究中采用激光衍射法测量微晶纤维素的中值粒径,与[url=https://insevent.instrument.com.cn/t/1p][color=#3333ff]NIR[/color][/url]光谱吸光度值进行关联得到两者的相关性图。[/align][align=left][color=black]Findlay[/color][color=black]等[/color][sup][/sup]在流化床制粒干燥过程中使用[url=https://insevent.instrument.com.cn/t/1p][color=#3333ff]NIR[/color][/url]S在线监测颗粒水分含量和粒径大小,并用两者的监测结果结合流化床传质传热特性来判断制粒喷雾终点和颗粒干燥终点。使用[url=https://insevent.instrument.com.cn/t/1p][color=#3333ff]NIR[/color][/url]光谱仪通过流化床上的玻璃窗采集样品光谱,此玻璃窗安装有一个特殊的垫圈以保持窗口的清洁。制粒过程中每隔5 min停机取样进行一级数据的测量,其中用干燥失重法测定样品含水量数据,用图像分析法测量颗粒的粒径大小。此外,样品在湿颗粒状态和干颗粒状态采集的[url=https://insevent.instrument.com.cn/t/1p][color=#3333ff]NIR[/color][/url]光谱存在差异(由于水对[url=https://insevent.instrument.com.cn/t/1p][color=#3333ff]NIR[/color][/url]光谱的影响),而且在制粒初期的前10min采集窗易被湿粉末污染,由此,与制粒的早期阶段相比,[url=https://insevent.instrument.com.cn/t/1p][color=#3333ff]NIR[/color][/url]S在接近喷雾结束和干燥阶段更能获得准确的粒径数据。研究结果表明当样品含水量超过3%([i]w/w[/i])时,需要调整粒径的测量值,使得制粒过程中采用[url=https://insevent.instrument.com.cn/t/1p][color=#3333ff]NIR[/color][/url]S测得的数据和通过一级方法测得的数据可以较好地吻合。随后对[url=https://insevent.instrument.com.cn/t/1p][color=#3333ff]NIR[/color][/url]数据进行电脑编程,可以对流化床制粒过程进行程序化控制。同样,Makoto Otsuka等[sup][color=black] [[/color][/sup][sup]20][/sup][color=black]使[url=https://insevent.instrument.com.cn/t/1p][color=#3333ff]近红外光谱仪[/color][/url]透过流化床的玻璃壁采集光谱,并使用定制的橡皮刮刀来保持玻璃壁的清洁,研究了[/color][url=https://insevent.instrument.com.cn/t/1p][color=#3333ff]NIR[/color][/url]S在线监测实验室规模流化床制粒过程粒径和水分的变化。此外,实验分别使用3种不同浓度的粘合剂([color=black]10%[/color][color=black],[/color]8.5%,[color=black]7.5%[/color][color=black]的羟丙基纤维素)溶液,取样后采用筛分法测定样品的[/color]D[sub]50[/sub],用[color=black]PLSR[/color][color=black]方法建立粒径定量模型,结果证明了[/color][url=https://insevent.instrument.com.cn/t/1p][color=#3333ff]NIR[/color][/url]S在流化床混合、制粒和干燥过程预测对乙酰氨基酚配方颗粒水分含量和D[sub]50[/sub]的可行性。[/align][align=left][color=#141314]Nieuwmeyer[/color][color=#141314]等[/color][sup][/sup]用[color=#141314]PLSR[/color][color=#141314]法分别建立了水分含量和粒径的[/color][url=https://insevent.instrument.com.cn/t/1p][color=#3333ff]NIR[/color][/url]定量模型。采用激光衍射法测得干样品的平均粒径(D[sub]50[/sub])作为一级数据,和干样品的[url=https://insevent.instrument.com.cn/t/1p][color=#3333ff]NIR[/color][/url]光谱数据关联,建立了具有4个主成分因子的平均粒径PLSR定量模型。Makoto Otsuka等[sup][color=black][[/color][/sup][sup]20][/sup]采用实验室规模的流化床制粒机研究[url=https://insevent.instrument.com.cn/t/1p][color=#3333ff]NIR[/color][/url]S监测制粒过程的粒径和水分变化。[url=https://insevent.instrument.com.cn/t/1p][color=#3333ff]NIR[/color][/url]光谱仪透过流化床的玻璃壁采集光谱,使用定制的橡皮刮刀来保持玻璃壁的清洁。研究实验分别使用3种不同浓度的粘合剂([color=black]10%[/color][color=black],[/color]8.5%,[color=black]7.5%[/color][color=black]的羟丙基纤维素)溶液,采用筛分法测定样品的[/color]D[sub]50[/sub],对[color=black][url=https://insevent.instrument.com.cn/t/1p][color=#3333ff]NIR[/color][/url][/color][color=black]光谱进行[/color]MSC预处理后,采用[color=black]PLSR[/color][color=black]方法建立粒径定量模型,并对模型进行了外部交叉验证。此研究结果证明了[/color][url=https://insevent.instrument.com.cn/t/1p][color=#3333ff]NIR[/color][/url]S在流化床混合、制粒和干燥过程预测对乙酰氨基酚配方颗粒水分含量和D[sub]50[/sub]的可行性,表明[color=black][url=https://insevent.instrument.com.cn/t/1p][color=#3333ff]NIR[/color][/url]S[/color][color=black]可以作为在线实时监测制粒过程的有力工具。[/color][/align][align=left][b][color=#0d0d0d]1.3 [/color]颗粒的堆密度[/b][/align][align=left]制粒过程中除了颗粒含水量和粒径两个关键参数外,颗粒的堆密度也是判断颗粒质量的重要参数,例如,可以通过测量堆密度大小判断颗粒的流动性和可压性。Manel等[sup][/sup]研究在线[url=https://insevent.instrument.com.cn/t/1p][color=#3333ff]NIR[/color][/url]S在生产规模流化床制粒系统(GLATTWSG300)生产过程中的应用,其不仅在线监测制粒过程中产品水分和粒径的变化,还对颗粒的堆密度进行实时监测。通过[url=https://insevent.instrument.com.cn/t/1p][color=#3333ff]NIR[/color][/url]反射光纤探头透过流化床制粒机上的玻璃窗采集光谱,采用[url=https://insevent.instrument.com.cn/t/1p][color=#3333ff]NIR[/color][/url]光谱数据建立基于主成分分析的定性多变量分析模型,监测制粒过程,判断制粒的操作环境是否正常以及判断制粒过程是否出现异常。同样,用PLS方法建立了多个定量分析模型来监测制粒过程中各参数的变化(堆密度、含水量、粒径分布),实现了对流化床制粒干燥过程进行实时在线控制。[/align][align=left][b]2 [url=https://insevent.instrument.com.cn/t/1p][color=#3333ff]近红外光谱[/color][/url]应用于流化床包衣过程[/b][/align][align=left][color=black]流化床包衣广泛用于膜缓控释、骨架缓控释胶囊[/color]、丸剂包衣等。通过包衣可以掩盖药物的不良气味,还可以隔绝空气,避光防潮,提高药物的稳定性;[color=black]此外,合适的薄膜包衣厚度可控制膜的渗透性,使所包药物在体内扩散释放,达到定时、定位给药的目的[/color][sup][/sup],因此在流化床包衣过程中,包衣厚度是其质量控制的重要指标,用[url=https://insevent.instrument.com.cn/t/1p][color=#3333ff]NIR[/color][/url]S对此过程进行实时在线监测,可以有效判断包衣终点,提高产品质量。[/align][align=left] 早期Kirsch等[sup][/sup]采用[url=https://insevent.instrument.com.cn/t/1p][color=#3333ff]NIR[/color][/url]S对片剂的包衣厚度进行了离线分析,验证了[url=https://insevent.instrument.com.cn/t/1p][color=#3333ff]NIR[/color][/url]S方法可作为快速、无损检测包衣厚度的有效方法。20世纪初期,Andersson等[sup][/sup]把[color=#231f20][url=https://insevent.instrument.com.cn/t/1p][color=#3333ff]NIR[/color][/url]S[/color][color=#231f20]光纤漫反射探头安装到流化床包衣机上,用于包衣过程中包衣厚度的在线监测。每批实验生产的样品量为[/color]0.5 kg,其中,包衣液材料和丸芯材料的化学组成不同,包衣液为乙基纤维素(具有荧光性),包衣厚度的一级测定方法采用图像分析法,通过包衣材料的荧光特性测定包衣厚度。采用Savitzky-Golay15点平滑和二阶导数对光谱进行预处理,选用1100-1250,[color=#231f20]1300-1450[/color][color=#231f20],以及[/color]1600-1800 nm的波长范围(纤维素类有较强的吸收)建立PLS定量模型,模型结果为R[sup]2[/sup]=0.97[color=#231f20],校正均方根误差为[/color]2.2 μm,可以较准确的判断包衣终点。Lee等[sup][/sup]使用平均聚类的方法建立了[url=https://insevent.instrument.com.cn/t/1p][color=#3333ff]NIR[/color][/url]包衣厚度的动态校正模型,此模型具有较好的预测能力。在流化床包衣过程中在线采集[url=https://insevent.instrument.com.cn/t/1p][color=#3333ff]NIR[/color][/url]光谱,并间隔一定时间收集样品来测定一级数据(包衣厚度)。为了保证在线光谱的准确性,把对应收集样品时间点的21或[color=#231f20]45[/color][color=#231f20]个光谱取平均,然后与相应的一级数据关联建立[/color]PLS模型,并对模型进行外部验证。结果表明[url=https://insevent.instrument.com.cn/t/1p][color=#3333ff]NIR[/color][/url]可以作为流化床包衣过程在线监测工具,准确的判断包衣终点。[/align][align=left][color=black]Hudovornik[/color][color=black]等[/color][sup][/sup]采用[color=black][url=https://insevent.instrument.com.cn/t/1p][color=#3333ff]NIR[/color][/url][/color][color=black]和空气滤波技术[/color](Spatial Filtering Technique, SFT)[color=black]监测中试流化床底喷包衣过程,建立了[/color][url=https://insevent.instrument.com.cn/t/1p][color=#3333ff]NIR[/color][/url]水分含量预测模型,并表明[url=https://insevent.instrument.com.cn/t/1p][color=#3333ff]NIR[/color][/url]实时预测包衣厚度的可能性,此外,评估了两种在线方法判断过程异常(丸芯磨损和沉积)的能力。研究中建立的[url=https://insevent.instrument.com.cn/t/1p][color=#3333ff]NIR[/color][/url]水分含量模型对包衣液的成分非常敏感,需要控制包衣液成分的变化以及采用合适的校正集范围来获得较好的预测结果。采用在线[url=https://insevent.instrument.com.cn/t/1p][color=#3333ff]NIR[/color][/url]光谱和[color=black]SFT[/color][color=black]数据关联建立了[/color]PLS包衣厚度定量模型,此[url=https://insevent.instrument.com.cn/t/1p][color=#3333ff]NIR[/color][/url]模型建立的物质基础为药物层的主药成分,随着包衣厚度的增加,主药成分的吸收峰(1670nm处)的强度逐渐降低,所以选择了1600-1751nm的波长范围建立此模型。结果表明采用[url=https://insevent.instrument.com.cn/t/1p][color=#3333ff]NIR[/color][/url]建立的包衣厚度、水分含量定量模型预测能力较好,同样能够实时判断包衣过程的异常状态,因此,表明[url=https://insevent.instrument.com.cn/t/1p][color=#3333ff]NIR[/color][/url]可以单独作为实时监测包衣过程的在线工具。[/align][align=left][b]3 结论与展望[/b][/align]近年来,随着[color=black]PAT[/color][color=black]在制药行业的推广,[/color][url=https://insevent.instrument.com.cn/t/1p][color=#3333ff]NIR[/color][/url]S技术已被应用到制剂生产的各个过程。流化床制粒和包衣作为制剂的关键环节,对其生产过程进行实时监测,不仅能够优化生产工艺,提高产品质量,还可以节省能源,为制药企业增加效益。本文综述了在线[url=https://insevent.instrument.com.cn/t/1p][color=#3333ff]NIR[/color][/url]S技术监测流化床制粒和包衣过程的研究进展,目前流化床技术在我国制药行业已得到广泛的应用,启示我们可以对流化床工艺进行在线工程化改造,采用在线[url=https://insevent.instrument.com.cn/t/1p][color=#3333ff]NIR[/color][/url]S实现流化床制粒和包衣过程实时监测,实现生产过程的自动化和智能化控制[color=black],保证产品的[/color]安全、有效、稳定、均一[color=black]。[/color][b][/b][align=left][b]参考文献[/b][/align][align=left] 张东利,郝东升,舒安庆,张维蔚.流化床喷雾造粒技术进展 . 化学工业与工程, 2005, 22(4): 289-295.[/align][align=left]宋顺宗,辛聪,宫国华,郭建鹏.利用流化床制备中药包衣颗粒的工艺研究.时珍国医国药,2007, 18(11): -2715.[/align][align=left]U.S. Food and Drug Administra2714tion. Guidance for Industry PAT-A Frameworkfor Innovative Pharmaceutical Development, Manufacturing and Quality Assurance.New Hampshire Avenue: FDA, 2004. [/align][align=left][color=black]Nä rvä nen T, Seppä lä K, Antikainen O, et al. A newrapid on-line imaging method to determine particle size distribution ofgranules, [i]AAPS Pharm Sci Technol, [/i]2008,9: 282-287.[/color][/align][align=left][color=black]Sandler N. Photometric imaging in particle sizemeasurement and surface visualization [/color][color=#231f20].[/color][i][color=black] Int J Pharm,[/color][/i][color=#231f20] 2011, 417: 227-234.[/color][/align][align=left][color=black]Mož ina M, Tomaž evič D, Leben S, et al. Digitalimaging as a process analytical technology tool for fluid-bed pellet coatingprocess[/color][color=#231f20].[/color][i][color=black]Eur J Pharm Sci, [/color][/i][color=black]2010,44: 156-162.[/color][/align][align=left] [color=black]Alshihabi F,Vandamme T, Betz G. Focused beam reflectance method as aninnovative (PAT) tool to monitor in-line granulation process in fluidized bed.[i]Pharm Dev Technol,[/i] 2011:73-84.[/color][/align][align=left] [color=#231f20]Sheahan T, Briens L. [/color]Passive acoustic emissions monitoring of the coating of pellets ina fluidized bed—A feasibility analysis . [i]PowderTechnol,[/i] 2015, 283: 373-379.[/align]褚小立.化学计量学方法与分子光谱分析技术. 北京:化学工业出版社,2011. 259.[align=left] Alcala M, Blanco M, BautistaM,et al. [color=black]On-line monitoring of a granulationprocess by [url=https://insevent.instrument.com.cn/t/1p][color=#3333ff]NIR[/color][/url] spectroscopy [/color][color=#231f20].[/color][color=black] [i]J Pharm Sci, [/i]2010,99(01): 336-345.[/color][/align][align=left]刘怡,马怡.流化床制粒影响因素的探讨. 中国医药工业杂志,2004,35(9): 566-568.[/align][align=left][color=black]Kona R, Haibin Qu, Mattes R, et al. Application ofin-line near infrared spectroscopy and multivariate batch modeling for processmonitoring in fluid bed [/color][color=#231f20]granulation . [/color][i][color=black]Int J Pharm,[/color][/i][color=#231f20]2013, 452: 63-72.[/color][/align][align=left][color=black]Rantanen J, [/color]Rasanen E[color=black], [/color]Tenhunen J[color=black], et al.In-line moisture measurement during granulation with a four-wavelength nearinfrared sensor: an evaluation of particle size and binder effects [/color].[color=black] [i]Eur J Pharm Biopharm[/i], 2000, 50: 209-217.[/color][/align][align=left][color=black]Peinado A, Hammond J, Scott A. Development, validationand transfer of a near infrared method to determine in-line the end point of afluidised drying process for commercial production batches of an approved oralsolid dose pharmaceutical product . [i]J Pharm Biomed Anal, [/i]2011,54: 13-20.[/color][/align][align=left] [color=black]Green RL,Thurau G, Pixley NC, et al. In-line monitoring of moisture content in fluid beddryers using near-IR spectroscopy with consideration of sampling effects onmethod accuracy [/color][color=#231f20]. [/color][i][color=black]Anal Chem,[/color][/i] 2005, 77: 4515-4522.[/align][align=left][color=black] Frake P,Greenhalgh D, Grierson SM, et al. Process control and end-point determinationof a fluid bed granulation by application of near infra-red spectroscopy [/color].[i][color=black]Int J Pharm,[/color][/i] 1997,151: 75-80.[/align][align=left][color=black] Rantanen J,Yliruusi J. Determination of particle size in a fluidized bed granulator with anear infrared set-up [/color][color=#231f20].[/color] [i]Pharm Pharmacol Commun[/i],1998,4:73-75.[/align][align=left] Findlay WP, Peck GR, Morris KR. Determination of fluidizedbed granulation end point using near-infrared spectroscopy and phenomenologicalanalysis [color=#231f20]. [/color][i][color=black]J Pharm Sci,[/color][/i] 2005,94: 604-612.[/align][align=left][color=black] NieuwmeyerFJS, Damen M, Gerich A, et al. Granule characterization during fluid bed dryingby development of a near infrared method to determine water content and mediangranule size [/color][color=#231f20]. [/color][i][color=black]Pharm Res[/color][/i], 2007, 24(10): 1854-1861.[/align][align=left] Otsuka M, Koyama A, Hattori Y. Real-time release monitoringfor water content and mean particle size of granules in lab-sized fluid-bedgranulator by near-infrared spectroscopy [color=black]. [i]RSC Adv, [/i]2014, 4: 17461-17468.[/color][/align][align=left] 柯博克[color=black], [/color][color=black]刘雪松[/color], 陈勇[color=black], [/color][color=black]等[/color].[color=black][url=https://insevent.instrument.com.cn/t/1p][color=#3333ff]近红外光谱[/color][/url]快速测定复方丹参滴丸的包衣厚度[/color][color=black].[/color]复方丹参滴丸论文集[color=black],2005-2010:487-490.[/color][/align][align=left] Kirsch JD, Drennen JK. Near-infrared spectroscopy monitoringof the filming coating process [color=#231f20][/color]. [i]Pharm Res,[/i] 1996,13(02): 234-237.[/align][align=left] [color=#231f20]Andersson M, FolestadS, Gottfries J, et al. Quantitative analysis of film coating in a fluidized bedprocess by in-Line [url=https://insevent.instrument.com.cn/t/1p][color=#3333ff]NIR[/color][/url] spectrometry and multivariate batch calibration [/color]. [i]Anal Chem, [/i]2000, 72:2099-2108.[/align][align=left] [color=#231f20]Lee MJ, Park CR, KimAY, et al. Dynamic calibration for the in-Line [url=https://insevent.instrument.com.cn/t/1p][color=#3333ff]NIR[/color][/url] monitoring of film thicknessof pharmaceutical tablets processed in a fluid-bed coater . [i]J Pharm Sci,[/i] 2010, 99(01): 325-335.[/color][/align][align=left] [color=#231f20]Lee MJ, [/color]Seo DY, [color=#231f20]Lee HE, etal. In line [url=https://insevent.instrument.com.cn/t/1p][color=#3333ff]NIR[/color][/url] quantification of film thickness on pharmaceutical pelletsduring a fluid bed coating process [/color][color=black].[/color][i]Int J Pharm[/i][color=black], 2011, 403:66-72.[/color][/align][align=left] [color=black]Hudovornik G, Korasa K, Vre[/color]č [color=black]er F. [/color]A study on the applicability of in-line measurements in themonitoring of the pellet coating process [color=black]. [i]Eur J Pharm Sci[/i], 2015, 75: 160-168.[/color][/align][align=left][color=black] [/color][/align]
[size=24px][font=仿宋][b]摘要[/b]:[/font][font=仿宋]聚合酶链反应分析仪(PCR仪)广泛用于疾控、出入境检测、药监、生物制药企业、医疗机构、专业基因检测和分子生物实验室等。应用于司法鉴定、临床诊断、基因研究、疾病控制等领域。其控温性能直接影响到检测结果的可靠性。而常用的铂电阻温度计、热电偶温度传感器因尺寸问题不适用于聚合酶链反应分析仪(PCR仪)控温性能的校准,所以在检测、校准过程中必须使用专用的检测设备,而此类设备大多依赖进口,价格昂贵,未能普遍应用,使得聚合酶链反应分析仪(PCR仪)实验的数据、结果的可靠性不能得到有效保证。本文依据聚合酶链反应分析仪(PCR仪)的检测、校准项目,结合国家相关计量校准规范,提出一种用于聚合酶链反应分析仪(PCR仪)温度性能校准的专用检测设备。[/font][font=仿宋][b]关键词:[/b][/font][font=仿宋]聚合酶链反应分析仪、温度、校准、检测设备[/font][/size][font=宋体][size=22.0000pt][b] 一、绪论[/b][/size][/font][font=仿宋][size=24px]1、聚合酶链反应分析仪(PCR仪)[/size][/font][font=仿宋][size=24px]1.1聚合酶链反应分析仪(PCR仪)的基本原理[/size][/font][img=,561,467]https://ng1.17img.cn/bbsfiles/images/2020/06/202006271433435955_7689_1638093_3.jpg!w561x467.jpg[/img][img=,550,269]https://ng1.17img.cn/bbsfiles/images/2020/06/202006271434048558_6420_1638093_3.jpg!w550x269.jpg[/img][font=宋体][size=18px] [b]图1 基因扩增原理图[/b][/size][/font][size=24px][font=宋体][font=仿宋] 聚合酶链反应分析仪(以下简称PCR仪)就是聚合酶链反应过程中的控温设备,能在变性温度、复性温度、延伸温度之间准确进行温度调整、控制。[/font][/font][font=宋体][font=仿宋]1.2 PCR仪的分类1.2.1按功能分类 a)普通定性PCR仪 仅具备温度控制功能,自动调节温度至不同温度点,完成聚合酶链反应的变性、退火及延伸过程,可自动进行聚合酶链反应,完成基因扩增。 b)荧光定量PCR仪 荧光定量PCR仪是在普通PCR仪的基础上增加一个荧光信号采集系统和计算机分析处理系统的PCR仪,称作荧光定量PCR仪。其PCR扩增原理和普通PCR仪扩增原理相同,只是PCR扩增时加入的引物是利用同位素、荧光素等进行标记,使用引物和荧光探针同时与模板特异性结合扩增。扩增的结果通过荧光信号采集系统实时采集信号连接输送到计算机分析处理系统得出量化的实时结果输出。荧光定量PCR仪有单通道、双通道和多通道。当只用一种荧光探针标记的时候,选用单通道,有多荧光标记的时候用多通道。单通道也可以检测多荧光的标记的目的基因表达产物,因为一次只能检测一种目的基因的扩增量,需多次扩增才能检测完不同目的基因片段的量。[/font][/font][/size][font=仿宋][size=24px]1.2.2按孔数分类[/size][/font][font=仿宋][font=仿宋][size=24px] 目前常见的[/size][/font][/font][font=仿宋][size=24px]PCR仪按试验孔数分主要包括:48孔、96孔、384孔。[/size][/font][font=仿宋][font=仿宋][size=24px]1.3、PCR仪的检测校准[/size][size=24px]1.3.1 PCR仪的检测校准依据和主要校准项目[/size][size=24px] 目前,PCR仪的校准可执行JJF1527-2015《聚合酶链反应分析仪校准规范》。主要检测项目包括:[/size][size=24px] a)温度示值误差;[/size][size=24px] b)温度均匀度(孔间温差);[/size][size=24px] c)平均升温速率;[/size][size=24px] d)平均降温速率;[/size][size=24px] e)样本示值误差;[/size][size=24px] f)样本线性。[/size][/font][/font][font=仿宋][font=仿宋][size=24px] 其中温度示值误差、温度均匀度、平均升温速率、平均降温速率需使用专用温度测量设备进行校准。因考虑到聚合酶链反应过程中,反映酶在温度较高的条件下会发生活性下降甚至失活,对试验结果造成影响的问题,在校准过程中还应加入温度过冲项目的校准。所以用于校准聚合酶链反应分析仪温度性能的检测设备需具备校准:温度示值误差、温度均匀度(孔间温差)、平均升温速率、平均降温速率和温度过冲的功能。[/size][/font][/font][font=仿宋][font=仿宋][size=24px]1.3.2 PCR仪检测仪的功能和技术要求 依据JJF1527-2015《聚合酶链反应分析仪校准规范》的要求,用于校准PCR仪的校准设备,其温度测量性能需满足: a)测温范围:(0~120)℃; b)温度测量结果的不确定度:[i]U[/i]≤0.1℃([i]k[/i]=2); c)可同时测量多个孔的温度。[/size][/font][/font][font=仿宋][font=仿宋][size=24px] 同时为方便平均升温速率、平均降温速率和温度过冲项目的校准,还应具备自动计时、最高温度点自动记录、检测数据定时记录等功能。[/size][/font][/font][font=仿宋][font=仿宋][size=24px]1.4、PCR仪检测仪的发展现状 PCR仪由于实验室应用的特点,其样品槽较小,温度测量中常用的铂电阻温度计、热电偶传感器因尺寸问题,一般不适用于PCR仪温度性能的检测、校准,要实现PCR仪温度性能的检测、校准必须使用专用的检测设备。目前用于PCR仪温度计量性能检测的设备主要分为有线式检测和无线式检测,其中:[/size][/font][/font][font=仿宋][font=仿宋][size=24px] a)有线检测。有线检测的准确度较高,基本满足量传溯源的要求,但因连接线影响PCR仪温度环境的密闭性,使用过程中经常出现因控温环境不密闭,造成检测、校准结果不能真实反应仪器实际控温性能的问题,并且不适用于必须在密闭条件下使用的PCR仪的校准,不具备自动检测和记录功能。 b)无线检测。无线检测设备随能实现自动检测、自动记录检测结果,一次实验可完成多个参数的检测、校准,但目前多依赖于进口,而且准确度较低,不能满足量传溯源的要求。同时此类无线检测设备多为PCR仪生产企业针对本公司仪器开发的专用检测设备,主要用于对本公司产品的质量控制,对其他品牌的PCR仪不具备广泛适用性。 我国第一台PCR仪温场检测仪由成都市计量检定测试院于2013年引进。目前,已有50余家计量检测机构配置了此类设备,开展PCR仪的温度校准工作。但大多计量检测机构配的设备均为PCR仪生产厂家开发的仅适用于本公司产品的检测设备,不能适用于多种品牌、不同型号的PCR仪的校准,而且准确度相对较低,不能满足JJF1527-2015《聚合酶链反应分析仪校准规范》对标准器的要求。由于进口设备,价格昂贵(售价数十万元),不仅一般PCR仪使用机构难以配置,而且专业计量检测机构也极少配置,检测、校准能力严重不足。即便具备PCR仪检测、校准能力的计量检测机构也因检测设备购置成本较高,在开展此项检测、校准工作中也会收取较高的检测费用,致使目前PCR仪的定期溯源率相对较低。[/size][/font][/font][font=仿宋][font=仿宋][size=24px]1.5、发展趋势 随着JJF 1527-2015 《聚合酶链反应分析仪校准规范》的发布,各实验室对PCR仪温度计量性能校准的需求日渐增强,同时对校准系统的适用性、准确性和规范性要求越来越高,市场亟需一套适用广泛,满足现行国家计量校准规范,满足计量溯源体系的,售价在大多数检测机构承受范围内的专用校准系统。[/size][/font][/font][font=仿宋][font=仿宋][size=24px][b]二、技术路线和技术方案[/b] 依据国家校准规范JJF1527-2015《聚合酶链反应分析仪校准规范》规定,PCR仪温场检测设备至少需要15个精密温度传感器,同时完成PCR仪温度计量性能的校准,测温范围:(0~120)℃,温度测量不确定度[i]U[/i]≤0.1℃([i]k[/i]=2)。因此温度采集器选用微小尺寸的高精度耐腐蚀同时具备线性的铂电阻PT1000作为传感器,探头按照PP标准反应管尺寸设计,PT1000涂导热胶后封于探头内。将温度传感器、信号放大采集、数据处理,数据存储集成到一个电路板产品上,非常有效的缩短传感器信号的距离,系统的抗干扰性和准确的提高,同时实现集成化小型化。 参照PCR仪温度控制标准程序,温度采集器将用恒温槽分段标定30℃、50℃、60℃、70℃、90℃、95℃六个温度点,其它温度通过线性换色,可以满足测温范围(0~120)℃,显示分辨率0.01℃,温度测量误差≤0.2℃,通过定期校准,进行修正后,可实现30℃、50℃、60℃、70℃、90℃、95℃六个温度点的测量结果的不确定度[i]U[/i]≤0.1℃([i]k[/i]=2)。 为了实现小型化集成化和无线连接等智能化,PCR仪温场检测设备设计包括温度采集器,无线信号接收器,电脑软件,手机软件;温度采集器功能包括温度传感器,信号放大采集,单片机数据采集和处理,蓝牙无线收发,锂电池充放电管理,USB数据通信等功能,系统复杂功能强大,物理尺寸很小方便工作人员使用;无线信号接收器通过USB插入电脑,用于无线连接温度采集器,实现动态实时数据交互,完成校准工作;电脑软件用于控制和数据接收工作,公司完成数据分析和报告;手机软件用于移动监控和数据下载。[/size][/font][/font][font=仿宋][font=仿宋][size=24px][b]三、技术创新点[/b] 3.1、设计开发的PCR仪温场检测设备,在满足我国JJF1527-2015《聚合酶链反应分析仪校准规范》的基础上,实现集成化、小型化,并采用无线连接,适用性较强;[/size][/font][/font][font=仿宋][font=仿宋][font=仿宋][img=,520,308]https://ng1.17img.cn/bbsfiles/images/2020/06/202006271440249432_2417_1638093_3.jpg!w520x308.jpg[/img][/font][/font][/font][font=仿宋][font=仿宋][size=18px] [b] 图2 采用无线传输方式的PCR仪温度校准系统[/b][/size][/font][/font][font=仿宋][font=仿宋][size=24px] 3.2、设计选用微小尺寸的高精度铂电阻RTD传感器,并将温度传感器、信号放大采集、数据存储集成到一个电路板产品上,系统的抗干扰性和准确度提高,同时实现小型化。温度传感器分布符合JJF1527-2015《聚合酶链反应分析仪校准规范》对温度传感器的分布要求,各温度传感器间距、尺寸与市场主流PCR仪相匹配,可直接替代PCR仪专用孔板嵌入PCR仪进行测量。[/size][/font][/font][font=仿宋][font=仿宋][font=仿宋][img=,548,365]https://ng1.17img.cn/bbsfiles/images/2020/06/202006271441522860_8625_1638093_3.jpg!w548x365.jpg[/img][/font][/font][/font][font=仿宋][size=18px] [b] 图3 PCR仪温度校准系统温度传感器的分布[/b][/size][/font][font=仿宋][size=24px][img=,325,228]https://ng1.17img.cn/bbsfiles/images/2020/06/202006271442214388_1285_1638093_3.jpg!w325x228.jpg[/img][/size][/font][size=18px][b][font=仿宋]图4 [/font][font=仿宋]JJF1527-2015[/font][font=仿宋]规定的温度传感器布点要求[/font][/b][/size][font=仿宋][size=24px] 3.3、PCR仪温度校准系统包括温度采集器,无线信号接收器,电脑软件,手机软件;温度采集器集成了温度传感器,信号放大采集,单片机数据计算,蓝牙无线收发,锂电池充放电管理,USB通信等功能; 3.4、本系统可采用恒温槽和标准温度计对实际校准点,30℃、50℃、60℃、70℃、90℃、95℃六个温度点进行温度分段标定,提高测量准确度;[/size][/font][font=仿宋][size=24px][font=仿宋] 3.5[/font][font=仿宋]、[/font][font=仿宋]本[/font][font=仿宋]系统的温度采集[/font][font=仿宋]器[/font][font=仿宋]采用[/font][font=仿宋]锂电池[/font][font=仿宋]供电[/font][font=仿宋],[/font][font=仿宋]方便[/font][font=仿宋]产品的[/font][font=仿宋]无线[/font][font=仿宋]连接[/font][font=仿宋]和[/font][font=仿宋]移动工作[/font][font=仿宋];[/font][font=仿宋]通过[/font][font=仿宋]电池[/font][font=仿宋]采用直流电压[/font][font=仿宋]供电提高了温度信号采集的稳定性,[/font][font=仿宋]隔离[/font][font=仿宋]了工频电源的[/font][font=仿宋]干扰;[/font][font=仿宋]通过USB[/font][font=仿宋]接口[/font][font=仿宋]给温度采集[/font][font=仿宋]器的[/font][font=仿宋]锂电池进行充电[/font][font=仿宋];[/font][font=仿宋] 3.6[/font][font=仿宋]、本[/font][font=仿宋]系统的温度采集[/font][font=仿宋]器设计数据[/font][font=仿宋]存储芯片,[/font][font=仿宋]用[/font][font=仿宋]电池供电工作自动[/font][font=仿宋]进行[/font][font=仿宋]温度采集[/font][font=仿宋]存储,校准工作[/font][font=仿宋]完成后,[/font][font=仿宋]再[/font][font=仿宋]连接电脑读出数据[/font][font=仿宋]做[/font][font=仿宋]分析[/font][font=仿宋]和[/font][font=仿宋]报告[/font][font=仿宋],可[/font][font=仿宋]实现[/font][font=仿宋]多台[/font][font=仿宋]机器同时校准工作;[/font][font=仿宋] 3.7[/font][font=仿宋]、[/font][font=仿宋]本[/font][font=仿宋]系统的温度采集[/font][font=仿宋]器设计USB[/font][font=仿宋]数据接口[/font][font=仿宋]和[/font][font=仿宋]无线[/font][font=仿宋]蓝牙;[/font][font=仿宋]可通过USB[/font][font=仿宋]或者[/font][font=仿宋]无线蓝牙[/font][font=仿宋]对[/font][font=仿宋]温度采集器进行监控[/font][font=仿宋]和[/font][font=仿宋]数据读取[/font][font=仿宋]。[/font][/size][/font][font=仿宋][font=仿宋][size=24px][b]四、产品功能[/b] 4.1、具有无线连接功能,可以使用USB无线接收器进行工作,也可以用手机APP进行操作工作; 4.2、采用高精度铂电阻RTD传感器,测温范围(0~120)℃,分辨率0.01℃,温度测量误差≤0.2℃,通过校准,进行修正后,可实现测量结果的不确定度[i]U[/i]≤0.1℃([i]k[/i]=2); 4.3、温度采集器设计了锂电池,通过USB充电; 4.4、温度采集器设计了数据存储芯片,用电池供电工作自动进行温度采集存储,校准工作完成后,再连接电脑读取数据,自动完成数据处理,生成校准报告。并根据采集得到的数据自动生成热成像图,通过热成像图直观体现PCR仪各加温孔内温度的偏移情况,为试验人员提供参考,避免使用温度明显偏移温度设定点的加温孔进行试验。同时可实现多台仪器同时校准,集中读取校准数据;[/size][/font][/font][font=仿宋][font=仿宋][font=仿宋][img=,563,395]https://ng1.17img.cn/bbsfiles/images/2020/06/202006271444186719_9018_1638093_3.jpg!w563x395.jpg[/img][/font][/font][/font][font=仿宋][font=仿宋][size=18px] [b]图5 PCR温场检测系统依据检测数据自动生成热成像图[/b][/size][/font][/font][font=仿宋][font=仿宋][size=24px] 4.5、温度采集器设计了无线蓝牙;电脑可通过USB或者无线蓝牙对温度采集器进行监控和数据读取。[/size][/font][/font][font=仿宋][font=仿宋][size=24px][b]五、技术指标[/b][/size][/font][/font][font=仿宋][font=仿宋][size=24px] 5.1、集成化小型化。温度传感器,检测探头,信号放大采集,数据计算,数据存储,无线蓝牙连接,USB通信接口,锂电池供电及充放电控制;实现以上功能产品,并且设计可以放入PCR仪([url=https://insevent.instrument.com.cn/t/jp][color=#3333ff][url=https://insevent.instrument.com.cn/t/jp][color=#3333ff]基因扩增仪[/color][/url][/color][/url])的物理尺寸。[/size][/font][/font][font=仿宋][font=仿宋][font=仿宋][img=,379,269]https://ng1.17img.cn/bbsfiles/images/2020/06/202006271445178540_2384_1638093_3.jpg!w379x269.jpg[/img][/font][/font][/font][font=仿宋][font=仿宋][size=18px] [b]图6 直接以PCR温场检测仪代替孔板放入PCR仪[/b][/size][/font][/font][font=仿宋][font=仿宋][size=24px] 5.2、实现无线接收器,可以无线连接温度采集器,发送控制命令,或者将温度数据通过USB转发给电脑。 5.3、实现电脑软件,用于人机控制,对PCR仪校准过程中的数据动态监控,数据分析和数据报告的输出。 5.4、实现手机软件,用于移动状态监控和数据监控。 5.5、适用于48孔、96孔PCR仪的检测、校准,温度采集共15个通道,分辨率0.01℃,测量误差≤0.2℃。 5.6、温度采集15个通道,每个通道温度数据10sps,即每秒实现采集10个温度数据。预估整个校准工作25分钟需要产生:10sps * (25 * 60)seconds * 15channel = 225000个温度数据。数据存储选择4Mbit闪存芯片。 5.7、PCR仪温度校准系统的温度采集器工作电流估算30mA,峰值电流估算50mA,电池工作有效时间设计2小时,选择输出3.7V的锂电池容量大于100mAh。 5.8、USB数据读取闪存芯片中的温度数据,不超过30秒。无线蓝牙传输温度数据,不低于每秒150(10sps*15channel)个温度数据。[/size][/font][/font][font=仿宋][font=仿宋][size=24px][b]六、市场分析[/b] 目前,我国在用PCR仪约300万台,并逐年递增。主要分布于疾控、出入境检测、药监、生物制药企业、医疗机构、专业基因检测和分子生物实验室等。应用于司法鉴定、临床诊断、基因研究、疾病控制等领域,特别是在病毒性传染病筛查过程中发挥着至关重要的作用。由于目前专用的PCR仪温场检测设备价格昂贵,全国仅50余家计量检测机构具备检测能力,无法满足每年PCR仪的检测需求。而此套检测设备的开发成功,在技术性能满足JJF1527-2015《聚合酶链反应分析仪校准规范》,达到国外同类产品技术水平的条件下,产品价格预计可降低50%,为中小型计量检测机构购置PCR仪温场检测设备开展校准工作提供了可能,同时也可用于PCR仪使用机构定期核查PCR仪温度性能,合理选用反应试剂,提高检测可靠性。[/size][/font][/font][size=24px]结束语[/size][font=仿宋][font=仿宋][size=24px] PCR仪专用检测仪是以实现PCR仪的计量校准为目的开发的专用检测设备,解决了长期以来此类设备依赖进口的问题,有助于PCR仪量值溯源体系的建立和完善,通过定期校准的方式保证PCR仪检测结果的可靠性。能够为我国基因研究、食品安全检测、医学诊断等领域提供必要的技术保障。[/size][/font][/font][size=32px][color=#cc0000][i]注:此套检测设备已于2020年实现技术成果转化,并开始小规模生产。[/i][/color][/size]
赛默飞世尔发布新型微型气相色谱分析仪http://lab.sciencenet.cn/upload/paper/images/2011/3/20113211358144860.jpgC2V-200微气相色谱分析仪赛默飞世尔科技公司近期发布了一款新型C2V-200微型气相色谱分析仪,用于快速分析天然气组成。C2V-200微气相色谱分析仪可用于实验室和在线分析,能够减少分析成本。分析器中独特紧凑的分离设计和集成芯片技术使它更易于产生较大的控制力和生产效率。赛默飞世尔科技在3月13日-18日亚特兰大举办的Pittcon 2011展览会上展示了其新型C2V-200微型气相色谱分析仪。自然资源短缺要求我们创造更高更快,更可靠的分析仪。C2V-200微型气相色谱通过精确分析天然气的热值提高生产力,能够在几秒钟内得到精确的结果。依据赛默飞世尔科技微型气相技术,C2V-200的核心技术是拥有一个只有信用卡大小的独特的分离柱,它包括一个注射系统,柱子和能够高效分析气体的检测器,能够提少维修费用和用气量。可交换柱盒提高了安装时的灵活配置和易用性。C2V-200增强型的控温装置使得微型气相柱的增温速率为240℃/min,以适用于更广泛的化合物分析。集成流路选择器的自动校准功能,提供了在线的、精准的分析数据。C2V-200微型气相色谱仪采用专用仪器控制和数据处理软件,在仪器运行中能够快速得到分析数据。报告结果完全遵循ISO、ASTM以及GPA标准。注明:该贴引自科学网。
握在手里的[url=https://www.bjutc.com/]USB微型频谱分析仪[/url],重量只有95克体积小,功能强大的USB频谱分析仪,可以应对频谱分析仪各种挑战,频谱监测,微波测量,EMC测试,WIFI和无线网络测试。其价格只有普通频谱分析仪的十分之一不到,既减少桌面使用空间,又方便携带。配备PC端配套软件(可免费下载)。最高频率6.2GHz,频率范围从100Hz到6.2GHz;最小频率步进1Hz,频率稳定度是±0.28ppm.参考电平范围:高频段 -70dBm至+30dBm ;低频段 -50dBm至+30dBm 。调解功能:AM、FM、PM、ASK、FSK、PSK、MSK、GMSK、BPSK、8PSK、I&Q data、EVM、Eye diagram、Constellation 。外形尺寸:100mm(长)×25mm(宽)×25mm(高)。外接IQ输出: 工作温度:-10°C至+50°C存放温度:-50°C至+70°C 幅度测量范围:低频段:平均噪声电平至+10dBm 高频段:平均噪声电平至+24dBm(连续波)高频段:平均噪声电平至+28dBm(脉冲波)[url=https://www.bjutc.com/]USB微型频谱分析仪[/url]设计体积小巧易携带,USB直接供电设计配合PC端的软件可以出色完成传统台式频谱仪的基本项目测试,工作方式与传统频谱仪基本相同,非常适合户外现场测试测量,室内测量又可以缩小作台空间。该硬件通过USB接口与PC电脑互连,再结合高效灵活的软件,在电脑里完成对硬件的控制、分析和显示等测试测量工作。[url=https://www.bjutc.com/about.html]北京普信创业科技有限公司[/url]
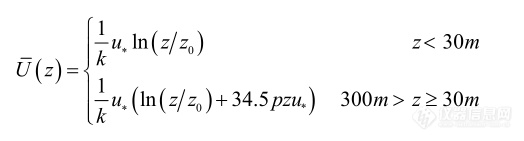
[align=center][size=16px][b]流化床风荷载模拟[/b][/size][size=16px][b]在[/b][/size][size=16px][b]matlab[/b][/size][size=16px][b]中的实现[/b][/size][/align]风是由空气流动形成的,结构处于风场中会受到顺风向力、横风向力及扭风力矩,对于流化床结构主要考虑顺风向风荷载及其作用效应,其风速时程曲线中主要包括长、短周期两种成分,因此可将顺风向风荷载分解为平均风(即稳定风)和脉动风(也称阵脉动风)两种成分。其中,由于风的长周期成分频率一般远小于结构的自振频率即频率比接近于零,所以结构的动力放大系数接近于一,这部分风荷载产生的结构动力效应很小,可以忽略,因此一般等效为静力作用,此部分风荷载的作用效果是使结构产生平均侧移;而脉动风是由湍流引起的,其变化具有随机性,且脉动风周期较短,其中会有一部分与结构的自振周期较为接近,此时结构的动力放大系数较大,产生了不可忽略的动力响应,脉动风部分将使得结构在平均侧移附近摇晃。由上述分析可见风荷载的模拟重点为两个方面,即平均风成分和脉动风成分的模拟。本文根据实验室流化床的设计资料及结构特点,使用 Matlab编制程序,通过基于自回归(Auto-Regressive,AR)模型的线性滤波法模拟了结构所受的风荷载时程,并验证了模拟风荷载的可靠性。与频域分析方法相比,时域分析方法更适用于流化床体系这种结构的分析(结构必然已经进入非线性阶段)。因此,在进行分析之前,首先要正确模拟结构所受到的风荷载时程。目前结构模拟风速时程的常用方法为谐波叠加法、线性滤波法 ,以及小波分析、逆傅立叶变换等,其中,最常用的方法即为谐波叠加法和线性滤波法。与谐波叠加法相比,线性滤波法的突出特点是计算量少,效率高,在脉动风风速的模拟中得到了广泛的应用 。针对这种情况,利用基于数字滤波技术AR 模型的线性滤波法来模拟其风荷载时程。如前文所述,风荷载可分为平均风成分和脉动风成分,因此接下来的风荷载模拟也主要分为这两个部分。根据实测结果,目前平均风速沿高度的变化关系(又称为风剖面)常用指数函数和对数函数来描述。本文采用对数风剖面建立平均风场,选取 ESDU建立的修正对数风剖面,其表达式如下式所示:[img]https://ng1.17img.cn/bbsfiles/images/2020/09/202009031744568784_7101_3890113_3.png[/img]式中, z 为任意一点的高度 ;z0 为地面粗糙长度; k 为 Karman 常数;u 是摩阻风速; p 是 Coriolis 参数,取 p =10 -4 s -1 。视脉动风速时程为平稳高斯随机过程,本文顺风向风速谱按照紊流尺度随高度变化 Kaimal 风速功率谱进行模拟,其谱密度函数如下:[img]https://ng1.17img.cn/bbsfiles/images/2020/09/202009031744570398_6514_3890113_3.png[/img][img]https://ng1.17img.cn/bbsfiles/images/2020/09/202009031744581558_6648_3890113_3.png[/img][img]https://ng1.17img.cn/bbsfiles/images/2020/09/202009031744591830_7644_3890113_3.png[/img][img]https://ng1.17img.cn/bbsfiles/images/2020/09/202009031745000308_6331_3890113_3.png[/img]其中, S 为输电塔的体形系数取值为 2.3; A 为结构沿风速方向的构件投影面积之和。 通过以上算法及公式成功的实现了使用matlab对流化床中风荷载进行模拟探究。
循环流化床锅炉(CFB)具有高效、低污染、煤种适应性广、负荷调节性好、不易灭火、灰渣可利用等特点,采用洁净燃烧技术,符合国家环保产业政策,再加上其较好的煤种适应性,在我国得到迅速推广,配套机组在向300MW及以上方向发展。 循环流化床锅炉由于其结构的特殊性,所安装的热工仪表测量、保护仪表与常规煤粉炉相比,有许多类似之处也有明显的区别。CFB锅炉汽水系统的测点及其作用与普通煤粉炉相同,烟风系统增加了一些为CFB锅炉专设的风机风道的压力、温度和流量的测点,其测量方法也同普通煤粉锅炉相同。CFB锅炉在参数测量方面的特别之处在于对炉膛、分离器、回料阀和冷渣器等固体流道参数的检测。 一、循环流化床锅炉的运行特点 CFB锅炉在运行过程中特别要注重对床温、分离器入口温度、风煤比以及床压的监测、调节及控制,注重对影响物料流化、循环及燃烧的各种风量的监控,确保建立一个平稳、足够的热物料循环,从而完成锅炉燃烧的燃料燃烧及热量传递过程。 按照循环流化床锅炉的特点,设置炉膛温度、床温、床料高度及其它有关测量仪表测点,以保证机组的安全、经济运行。压力测点应提供接口和防堵设施,温度测点要求留有热电偶插座,对有防磨要求的温度测点应加装防磨装置。 二、主要热工参数的作用和意义 2.1床温 床温是CFB锅炉的重要运行参数。所谓床温主要是指燃烧密相区内流化物料的料层温度,床温值是由锅炉结构、灰熔点、排放物指标(因煤种不同而有所区别)等综合因素决定的,通过调节流经布风板的一次风量和直接进入炉膛的二次风量之比来维持床温,同时注意控制给煤量,保证温度在850-925℃,使其处于最佳燃烧状态,并有利于炉内石灰石脱硫。床温过高或过低将造成锅炉结焦灭火。影响床温的因素主要有煤种、给煤量、一/二次风量、返料量及冷灰循环。在循环倍率一定时,主要与煤量和风量有关,其中一次风量起主要作用。 以一台480t/h容量的东锅锅炉为例,它设置了2层床温测点,下层24个测点,上层24个测点,左右侧分为四列三排。它们均在二次风口以下,密相区之内,每层测点沿炉膛前中后三排均匀、对称布置,每层测点的输出送入平均值计算回路,以计算床温平均值。同时各测点均进入DCS显示。当有点与平均温度相差150度时,判断此为坏点。 2.2床压 床压是料层高度的反映。运行中通常通过调整排渣量的多少控制床压的高低。床料多、床压高,对于稳定燃烧、减小短时间断煤波动的影响、减少排渣可燃物含量有利;但同时床压高会增大一次风压头,电耗增加,同时也大大增加了启动点火阶段加热床料的时间,降低运行经济性。床料薄、床压低,易造成布风不均匀,引起结焦。 床压一般是指密相区的床压,床压测孔一般布置在距布风板上端面250mm处,左侧3个,右侧3个,将3个压力测量值通过3取中逻辑判断后送至显示及报警回路;3者取平均值作为床压调节系统的反馈信号。控制床压的方法,通过控制排渣系统来维持炉膛床压恒定,也即确保炉内的灰平衡和床料构成。 2.3风量 循环流化床锅炉的运行基于流态化的高温物料悬浮燃烧。燃烧风量是运行人员调整燃烧的的重要依据,其测量的准确性直接影响到锅炉的经济安全运行。在机组安装完成后,调试运行前,应当对一、二次风机性能进行测定,并对风量的标定,主要是鉴定风机的出口风量、风压能否达到设计要求,能否满足燃烧需要,并且校正测量装置的准确性。有效的测量风量,有利于一二次风比例的调整,能改善炉内风、煤、灰的混合程度,达到最佳的燃料、供风混合方式。 2.4点火风道温度 由于CFB锅炉的炉膛密相区和旋风分离器等多个部位设有较厚的耐磨耐火材料,因此,在启动过程中必须严格控制加热升温速度,以防止这些非金属材料因受热不均而爆裂脱落。这就要求CFB锅炉的启动燃烧器设计既要位置合理又要有较宽的调节比,而且操作灵活,可控性高。 CFB锅炉的启动燃烧器一般有3类,即布置在布风板上的床上启动燃烧器、床枪和布置在布风板下的热烟发生器。东锅早期设计的流化床采用床上加床下点火器,但后来的产品仅仅保存了床下燃烧器,床下燃烧器的风温是个重要的监测参数。 在DG490/13.8-II2型锅炉,设计有风室温度和点火风道温度各二支,分为左右侧。在点火时,通过调整燃烧将床下油点火器出口烟气温度控制在980℃以下,且风室温度在870℃以下,在此期间,温升率建议不超过28/每20~30分钟。 三、运行情况与改进措施 由于CFB锅炉内进行固体燃料的循环燃烧,流动的物料极容易堵塞压力测点和测压管线,同时对测温元件产生强烈的磨蚀,用常规手段难以进行准确可靠的连续测量,床温和床压测量元件均采用耐热防磨及防堵措施使所测数据准确、可靠。而床温、床压等参数对保证CFB锅炉的安全经济运行至关重要,因此必须采用特殊的防堵、防磨测量手段。 3.1床温测量的改进 东锅的循环流化床炉膛床温元件通常是采用多点铠装热电偶,在布风板的前、中、后三个位置横向各安装8套铠装热电偶,每套热电偶由伸出布风板的距离为300mm,由耐磨保护套管保护;每套热电偶有双只铠装热电偶组成,一点测上床温,一点测下床温。热电偶安装方式为由前后墙平插入风室,经90°直角向上穿过并固定在布风板上的耐磨保护套管内。中间的测温元件从前墙插入。在机组启动调试期间,由于温度元件在风室内的部分太长,在一次风力作用下晃动太大,首批安装的24套热电偶全部损坏。经分析:床温元件在风室内的部分太长且不能很好固定,床温元件容易被风室内的高温风冲刷,造成损坏。后虽经过采取增加不锈钢保护套管、用耐磨浇筑料及钢丝网包裹、用耐火砖固定等方法进行处理,使床温元件的工作条件有所改善,但仍然没有从根本上解决问题。 因此,在大修期间我们建议对床温元件进行改造,安装方式均为炉底直插向上穿过布风板方式,同时加装耐磨保护套管,在套管外侧再增加耐磨浇筑料。如图所示,这种方式不但能有效保护测温元件,而且能够实现温度元件的在线更换。 3.2床压测量的改进 在国内440t的流化床锅炉在运行过程中,床层差压,床层密度,床层压力等几个测点经常结焦。在最初的安装中,测点取样与炉壁成45度向上,加装风烟自动分离器。但是使用时间较长后,依然会堵塞。后经改进后,采用自动吹扫装置,向测孔引入一股恒压吹扫空气,通过调节取样管与吹扫管的距离,实现自动补偿,解决了既要取压防堵又要测量准确的问题。如图所示,通过前后调节吹扫管在取样装置锥口的位置,实现自动吹扫补偿。 在吹扫口的吹扫气源上,特别且加装了调压稳压器,完全解决了电厂气源不稳的问题,确保了流量控制器的正常运行。 3.3点火风道温度的改进 在运行过程中,点火风道温度元件插入深度过长,被高温风吹刷,以致于保护管和热电偶同时损坏。经检查,热电偶保护管已穿过浇筑料80MM,测量的已不是壁温,而是烟温。后将热电偶保护管调整,露出浇筑料10-20MM,同时在测量元件对侧又加装一个测温点,构成A、B二点,即保证测量的灵敏度,又提高元件应用的可靠性,有利用缩短启动时间,为经济运行提供基础。 3.4风量测量元件的改进 风量对于流化床锅炉来说,无疑是一个重要参数,无论是设计还是调试、运行人员,都希望表计的读数能真实的反应实际的工状。一、二次风机性能的测定和风量的标定,主要是鉴定风机的出口风量、风压能否达到设计要求,能否满足燃烧需要,并且校正测量装置的准确性。在测量中应注意,虽然一般都采用标准的测风装置进行风量测量(目前最普遍的是采用机翼型测风装置)。 但是在实际施工中,设计的安装在锅炉风道上的风量测量装置,往往由于锅炉风道截面大,直管段长度短,弯头多,按厂家要求管道直段不能满足测量,在加上装置加工误差等原因使流量系数偏离设计值,因此必须对其进行标定。由于流量与风温、差压、风压的关系较大,有的采用了三种取样元件分别测量其参数,造成测量装置折线系数公式相当繁琐,其故障自检能力也基本没有。因此当然,有必要采用先进的测量元件器可以减少测量误差。 在实际应有中,我们选用了热式质量流量计,经过一年多的运行,相比于其它测量风量的元件相比,具有性能优良、可靠性高的特点。该产品基于热扩散技术,其典型传感元件包括两个热电阻,当这两个热电阻被置于流体中时,其中一个被加热,另一个用于感应过程温度。两个热电阻之间的温差与过程流速及过程介质的性质有关,保持该温差恒定,则电子单元加热热电阻的能量与质量流量成一定的比例,我们就能推算出风量。 3.5给煤系统的改进 在锅炉试运过程中出现最频繁的问题是煤仓堵煤,为保证正常运行,在煤仓开设人工捅煤孔,有一次断煤时,就地观察员工打开捅煤孔捅煤,破坏了给煤机的压力平衡,炉内烟气反窜到给煤机,造成一台给煤机皮带及其它部件烧损。给煤机厂家对此进行了改造,在给煤机进煤口安装了测温元件,信号送入DCS作为是否超温的判断条件,同时联锁快关阀。当炉内有热烟气反窜到给煤机时,通过温度信号使快关阀迅速关闭。原来的电接点双金属温度计作为给煤机就地控制柜的报警信号。 通过调试,对电厂运行人员建议:六台给煤机尽量采用对称投运和两侧炉膛给煤量比

[font=宋体][font=宋体] 我们为什么要坚持做[/font][font=Calibri][/font][url=https://www.bjutc.com/USBwxppfxy.html][font=Calibri]USB[/font][font=宋体]微型频谱分析仪[/font][/url][font=宋体]和[/font][font=Calibri][url=https://www.bjutc.com/USBwxspxhy.html]USB[/url][/font][font=宋体][url=https://www.bjutc.com/USBwxspxhy.html]微型信号源[/url],因为它是市场上一款备受青睐的产品,用户体验好,其价格不到传统频谱分析仪的一半,而且包含免费的 [/font][font=Calibri]SignalVu-PC [/font][font=宋体]信号分析软件。对于项目预算少的客户是不二选择。[/font][font=Calibri]USB[/font][font=宋体]微型频谱分析仪[/font][/font][font=Calibri][font=宋体]是一款精度[/font][/font][font=宋体]高,[/font][font=Calibri][font=宋体]又具有超高性价的[/font]USB[font=宋体]频谱分析仪,外观小巧,无外置电源、这款 [/font][font=Calibri]USB [/font][font=宋体]频谱分析仪可连接到带有 [/font][font=Calibri]USB 3.0 [/font][font=宋体]的 [/font][font=Calibri]PC [/font][font=宋体]可定制 [/font][font=Calibri]– [/font][font=宋体]让您可以在您的 [/font][font=Calibri]PC [/font][font=宋体]上进行定制设置,而不会丢失原来的设置 最大程度缩短上市时间。出色完成传统台式频谱仪的基本项目测试,工作方式与传统频谱仪基本相同。频率范围高达[/font][/font][font=宋体][font=Calibri]6.2[/font][/font][font=Calibri]GHz[font=宋体]。[/font][/font][font=Calibri] [font=宋体]由于[/font][/font][font=宋体][font=Calibri][/font][url=https://www.bjutc.com/USBwxppfxy.html][font=Calibri]USB[/font][font=宋体]微型频谱分析仪[/font][/url][font=宋体][/font][/font][font=Calibri][font=宋体]设计体积小巧易便携,非常适合户外现场测试与测量,[/font][/font][font=宋体][font=宋体]不但方便携带,测试也非常的方便可通过您的[/font] [font=Calibri]PC [/font][font=宋体]进行定制设置而不会丢失原来的设置,也可以使用我们的 [/font][font=Calibri]API [/font][font=宋体]直接从 [/font][font=Calibri]MATLAB [/font][font=宋体]等程序导入数据。[/font][/font][font=Calibri][font=宋体]室内测量又对您的有限工作台空间释放更多空间。计算机通过互联网轻松实现对仪器的远程控制,更可配合近场探头,组建成非常便携的[/font]EMI[/font][font=宋体]测试[/font][font=Calibri][font=宋体]。[/font][/font] [img=USB微型频谱分析仪,121,75]https://ng1.17img.cn/bbsfiles/images/2024/01/202401121017567137_2756_3248856_3.jpg!w121x75.jpg[/img][font=Calibri][font=宋体]特点:[/font][/font][font=宋体]很[/font][font=Calibri][font=宋体]小的频谱分析仪;[/font][/font][font=Calibri][font=宋体]设计小巧、易便携、高性价;[/font][/font][font=Calibri][font=宋体]体积小、[/font][/font][font=宋体]减少[/font][font=Calibri][font=宋体]工作台[/font][/font][font=宋体]使用[/font][font=Calibri][font=宋体]空间[/font][/font][font=Calibri] [font=宋体]高精度、数字合成[/font][font=Calibri]RF[/font][font=宋体]系统;[/font][/font][font=Calibri] USB[font=宋体]直接供电、无需外置电源;[/font][/font][font=Calibri][font=宋体]非常适合户外现场测试与测量;[/font][/font][font=Calibri][font=宋体]适合[/font][font=Calibri]EMI[/font][font=宋体]射频[/font][/font][font=宋体]测试[/font]
[align=center][size=21px][b]流化床[/b][/size][size=21px][b]混合环节[/b][/size][size=21px][b]及与[/b][/size][size=21px][b]PAT[/b][/size][size=21px][b]技术的集成[/b][/size][/align][font='times new roman'][size=16px]流化床[/size][/font][font='times new roman'][size=16px]([/size][/font][font='times new roman'][size=16px]fluidized bed[/size][/font][font='times new roman'][size=16px]),指首先[/size][/font][font='times new roman'][size=16px]利用气[/size][/font][font='times new roman'][size=16px]流动使[/size][/font][font='times new roman'][size=16px]物料呈[/size][/font][font='times new roman'][size=16px]沸腾状态,再喷入雾化后的[/size][/font][font='times new roman'][size=16px]粘合剂进行后续的制粒、包衣、成丸等,最后得到干燥的[/size][/font][font='times new roman'][size=16px]颗粒、微丸、[/size][/font][font='times new roman'][size=16px]包衣粉末及包衣微丸[/size][/font][font='times new roman'][size=16px]的制药设备。在流化床制药[/size][/font][font='times new roman'][size=16px]过程中,物料的混合、制粒[/size][/font][font='times new roman'][size=16px]、[/size][/font][font='times new roman'][size=16px]包衣[/size][/font][font='times new roman'][size=16px]和[/size][/font][font='times new roman'][size=16px]干燥[/size][/font][font='times new roman'][size=16px]等[/size][/font][font='times new roman'][size=16px]同时完成。流化床技术是在上世纪五十年代发展起来的,最初设计只是用作干燥设备,以提高干燥效率。[/size][/font][font='times new roman'][size=16px]1964[/size][/font][font='times new roman'][size=16px]年[/size][/font][font='times new roman'][size=16px]Scott[/size][/font][font='times new roman'][size=16px]等将[/size][/font][font='times new roman'][size=16px]Wurster[/size][/font][font='times new roman'][size=16px]方法作了改进并应用于医药工业,我国于上世纪八十年代将流化床引入到口服固体制剂的制备过[/size][/font][font='times new roman'][size=16px]程[/size][/font][font='times new roman'][size=16px]中[/size][/font][font='times new roman'][size=16px][color=#080000][1][/color][/size][/font][font='times new roman'][size=16px]。[/size][/font][font='times new roman'][size=16px]与传统制药工艺相比,流化床工艺设备具有以[/size][/font][font='times new roman'][size=16px]下优[/size][/font][font='times new roman'][size=16px]点[/size][/font][font='times new roman'][size=16px][color=#080000][2, 3][/color][/size][/font][font='times new roman'][size=16px]:([/size][/font][font='times new roman'][size=16px]1[/size][/font][font='times new roman'][size=16px])将固体制剂制备过程中多个生产环节有机结合在一起,生产工艺高效、便捷且提高了自动化程度[/size][/font][font='times new roman'][size=16px],[/size][/font][font='times new roman'][size=16px]缩短了工艺周期;([/size][/font][font='times new roman'][size=16px]2[/size][/font][font='times new roman'][size=16px])所得制剂产品有更好的流动性、同质性、可压性;([/size][/font][font='times new roman'][size=16px]3[/size][/font][font='times new roman'][size=16px])生产在密闭环境中进行,无交叉污染;([/size][/font][font='times new roman'][size=16px]4[/size][/font][font='times new roman'][size=16px])为湿热敏感药物的制备提供了良好的解决方案。[/size][/font][font='times new roman'][size=16px]随着制药机械设备的发展,流化床设备发展趋势如下:([/size][/font][font='times new roman'][size=16px]1[/size][/font][font='times new roman'][size=16px])规格越来越齐全,批次处理能力从几升到几千升;([/size][/font][font='times new roman'][size=16px]2[/size][/font][font='times new roman'][size=16px])集成智能传感器,达到对[/size][/font][font='times new roman'][size=16px]生产工艺的全自动化[/size][/font][font='times new roman'][size=16px]监测[/size][/font][font='times new roman'][size=16px]控制[/size][/font][font='times new roman'][size=16px];([/size][/font][font='times new roman'][size=16px]3[/size][/font][font='times new roman'][size=16px])物料无交叉连续化传递,[/size][/font][font='times new roman'][size=16px]整个生产过程[/size][/font][font='times new roman'][size=16px]全密闭、无尘化操作[/size][/font][font='times new roman'][size=16px];([/size][/font][font='times new roman'][size=16px]4[/size][/font][font='times new roman'][size=16px])工艺灵活,通过与其他设备集成形成连续化生产。[/size][/font][align=center][img='']" alt="[/img][/align][align=center][font='times new roman']图[/font][font='times new roman']1-1[/font][font='times new roman'] [/font][font='times new roman']流化床与其他设备结合形成制粒流水线[/font][/align][align=left][font='times new roman'][size=16px][b]流化床混合[/b][/size][/font][/align][font='times new roman'][size=16px]流化床制药[/size][/font][font='times new roman'][size=16px]工艺凭借其无可复制的优点[/size][/font][font='times new roman'][size=16px][color=#080000][4, 5][/color][/size][/font][font='times new roman'][size=16px]在[/size][/font][font='times new roman'][size=16px]固体制[/size][/font][font='times new roman'][size=16px]剂生产过程中得到了广[/size][/font][font='times new roman'][size=16px]泛的应用[/size][/font][font='times new roman'][size=16px][color=#080000][6, 7][/color][/size][/font][font='times new roman'][size=16px]。然而,流化床制药生产过程是一个密闭的过程,物料的流化状态剧烈且不可见,很难获取腔室中物料的状态和理化性质。[/size][/font][font='times new roman'][size=16px][b]PAT[/b][/size][/font][font='times new roman'][size=16px][b]技术的集成[/b][/size][/font][font='times new roman'][size=16px]随着制药设备的发展,流化床设备与其他制药机械设备结合形成固体制剂连续化生产系统[/size][/font][font='times new roman'][size=16px],如[/size][/font][font='times new roman'][size=16px]图[/size][/font][font='times new roman'][size=16px]1-1[/size][/font][font='times new roman'][size=16px]。作为固体制剂生产的上游关键环节,混合过程物料的[/size][/font][font='times new roman'][size=16px]混合[/size][/font][font='times new roman'][size=16px]均匀度会影响到制药过程下游每个环节[/size][/font][font='times new roman'][size=16px]API[/size][/font][font='times new roman'][size=16px]含量的均匀度,[/size][/font][font='times new roman'][size=16px]这[/size][/font][font='times new roman'][size=16px]也是药品质量一致性评价的重点。因此,流化床混合过程粉末共混物中[/size][/font][font='times new roman'][size=16px]API[/size][/font][font='times new roman'][size=16px]含量[/size][/font][font='times new roman'][size=16px]的瞬态干扰检测是一个重要[/size][/font][font='times new roman'][size=16px]的[/size][/font][font='times new roman'][size=16px]研究课题。但目前国内流化床混合过程[/size][/font][font='times new roman'][size=16px]中[/size][/font][font='times new roman'][size=16px]CQAs[/size][/font][font='times new roman'][size=16px]的[/size][/font][font='times new roman'][size=16px]测定多采用离线方法,只有在混合过程的最后,分析人员才能检测产品的[/size][/font][font='times new roman'][size=16px]CQAs[/size][/font][font='times new roman'][size=16px],以决定产品是否达到放行标准。此外,离线分析具有破坏性、昂贵、费时费力的缺点,不能及时反映生产过程物料的真实状态,最终影响产品的质量和安全性。因此,对流化床混合过程[/size][/font][font='times new roman'][size=16px]API[/size][/font][font='times new roman'][size=16px]含量[/size][/font][font='times new roman'][size=16px]进行实时监测研究,能够加深对产品和工艺的理解及后续生产过程的控制,实现精益生产与偏差控制的结合。[/size][/font][font='times new roman'][size=16px]仿制药一致性评价的推行对制药行业提出了更高的要求。固体制剂是目前最重要的给药形式之一,作为固体制剂生产的上游关键环节,混合过程物料的[/size][/font][font='times new roman'][size=16px]均匀度会影响到制药过程下游每个环节[/size][/font][font='times new roman'][size=16px]API[/size][/font][font='times new roman'][size=16px]的含量均匀度,[/size][/font][font='times new roman'][size=16px]也是药品质量一致性评价的重点[/size][/font][font='times new roman'][size=16px]。[/size][/font][font='times new roman'][size=16px]只有实时在线监测产品的质量属性、过程中材料和工艺条件的变化,进一步对药品生产过程加以监测和控制,才能生产出符合要求的产品。但是目前通常采用的检测方法为离线取样检测,不能及时了解过程中物料的状态及理化信息。为此,探索并建立一套及时准确的流化床混合过程智能分析技术非常必要。[/size][/font][font='times new roman'][size=16px]过程分析技术的提出,为实现过程理解提供了技术及设备支持。[/size][/font][font='times new roman'][size=16px]NIRS[/size][/font][font='times new roman'][size=16px]作为重要的[/size][/font][font='times new roman'][size=16px]PAT[/size][/font][font='times new roman'][size=16px]工具,在混合过程中的应用稳步增加。[/size][/font][font='times new roman'][size=16px]将[/size][/font][font='times new roman'][size=16px]NIRS[/size][/font][font='times new roman'][size=16px]引入到流化床混合过程中,对混合过程[/size][/font][font='times new roman'][size=16px]API[/size][/font][font='times new roman'][size=16px]含量进行实时监测,加深对产品和工艺的理解及后续生产过程的控制,实现[/size][/font][font='times new roman'][size=16px]精益生产与偏差控制的结合。同时,获得了[/size][/font][font='times new roman'][size=16px]完整的关键质量参数数据,使产品质量有据可依、有据可查。因此,[/size][/font][font='times new roman'][size=16px]通过对流化床混合过程[/size][/font][font='times new roman'][size=16px]NIRS[/size][/font][font='times new roman'][size=16px]过程分析研究,建立混合过程智能控制关键技术,这将为整个固体制剂药物生产过程质量管理提供借鉴和技术手段。[/size][/font][font='times new roman'][size=16px]在[/size][/font][font='times new roman'][size=16px]流化床[/size][/font][font='times new roman'][size=16px]混合过程中,[/size][/font][font='times new roman'][size=16px]腔室内粉末共混物[/size][/font][font='times new roman'][size=16px]中[/size][/font][font='times new roman'][size=16px]API[/size][/font][font='times new roman'][size=16px]含量[/size][/font][font='times new roman'][size=16px]的瞬态干扰检测是一个重要的研究课题。然而,在实际生产中流化床混合过程具有[/size][/font][font='times new roman'][size=16px]不[/size][/font][font='times new roman'][size=16px]可见性,流化床腔室中物料的化学和物理性质的真实状态无从知晓。所以使用[/size][/font][font='times new roman'][size=16px]PAT[/size][/font][font='times new roman'][size=16px]技术监测混[/size][/font][font='times new roman'][size=16px]合过程[/size][/font][font='times new roman'][size=16px]API[/size][/font][font='times new roman'][size=16px]含量均匀性的价值不言而喻。为了实现流化床混合过程的可视化,[/size][/font][font='times new roman'][size=16px]在实验模拟型流化床上将过程分析技术[/size][/font][font='times new roman'][size=16px]NIRS[/size][/font][font='times new roman'][size=16px]引入到流化床混合过程中,对过程关键质量属性[/size][/font][font='times new roman'][size=16px]—API[/size][/font][font='times new roman'][size=16px]含量进行[/size][/font][font='times new roman'][size=16px]定量[/size][/font][font='times new roman'][size=16px]监测。[/size][/font][font='times new roman'][size=16px]目前,批次混合过程中的一种常见建模方法是使用多个批次的样本建立校准模型,但在生产条件下要收集具有代表性的[/size][/font][font='times new roman'][size=16px]校准[/size][/font][font='times new roman'][size=16px]集需要[/size][/font][font='times new roman'][size=16px]消耗大量的物料,否则会影响后续模型的稳健性。[/size][/font][font='times new roman'][size=16px]在小试实验型流化床中使用有限的原辅料建立校准光谱模型,用于监测流化床混合过程中[/size][/font][font='times new roman'][size=16px]API[/size][/font][font='times new roman'][size=16px]的[/size][/font][font='times new roman'][size=16px]含量[/size][/font][font='times new roman'][size=16px]。[/size][/font][font='times new roman'][size=16px]加之[/size][/font][font='times new roman'][size=16px]研究了光谱预处理和波段选择方法,建立[/size][/font][font='times new roman'][size=16px]PLS[/size][/font][font='times new roman'][size=16px]模型来[/size][/font][font='times new roman'][size=16px]预测[/size][/font][font='times new roman'][size=16px]API[/size][/font][font='times new roman'][size=16px]含量。在有效的光谱预处理和波段选择方法的帮助下,近红外传感器可以准确地测定混合物中[/size][/font][font='times new roman'][size=16px]API[/size][/font][font='times new roman'][size=16px]的含量,从光谱监测的角度[/size][/font][font='times new roman'][size=16px]NIRS[/size][/font][font='times new roman'][size=16px]用于流化床混合过程[/size][/font][font='times new roman'][size=16px]API[/size][/font][font='times new roman'][size=16px]含量均匀性检测的可行性。同时,增加了对工艺过程的了解,从而科学有效地控制生产过程,提高产品质量,保证产品安全。[/size][/font]
请问有哪位大哥知道,工厂用的振荡流化床的具体使用操作规程吗??发个给我,谢谢我这里用的振荡流化床型号:ZLG6*0.6邮箱:lwj2380@126.com [email]luwj@fenchem[/email].com
各位老师好,我是一个初学分析仪表的学徒,我有几个问题想问问各位老师,液相色谱分析仪是否需要将取样液体进行气化呢?微型液体采样阀的工作原理是?谢谢!
[align=center][color=#191919]如何在流化床包衣过程中实现智能制造[/color][/align]当前中国制造由大变强的序幕已经拉开,[color=#191919]“[/color][color=#191919]中国制造[/color][color=#191919]2025”[/color][color=#191919]和[/color][color=#191919]“[/color][color=#191919]工业[/color][color=#191919]4.0”[/color][color=#191919]正在促进一场新工业变革的到来。[/color][color=#070707]推进智能制造,能够有效缩短产品研制周期,提高生产效率和产品质量,降低运营成本和资源能源消耗,加快发展智能制造,对于提高制造业供给结构的适应性和灵活性、培育经济增长新能动都具有十分重要的意义。[/color][color=black]面临新一轮科技变革和产业变革,美国、德国等制造强国纷纷提出了制造业升级的思路和规划。而在[/color][color=black]“[/color]中国制造[color=black]2025”[/color]规划中,智能制造是主攻方向,是未来制造业发展的重大趋势和核心内容,也是解决我国制造业由大变强的根本路径。[color=#191919]智能制造的载体是智能工厂,核心是关键环节智能化,基础是信息物理系统,支撑是工业互联网。智能制造最后带来的效果是生产效率的提升,产品质量的提升,产品研发时间的下降,运营成本的下降,资源能源消耗下降。本文就如何在流化床包衣过程中实现智能制造,以包衣厚度的测量为例,结合[url=https://insevent.instrument.com.cn/t/1p][color=#3333ff]近红外光谱[/color][/url]等技术,比较几种测量方法的优缺点,结果证明:基于[url=https://insevent.instrument.com.cn/t/1p][color=#3333ff]近红外光谱[/color][/url]技术的测量方法最为有效,可用于工业化大生产,契合智能制造的理念。[/color][color=black]流化床是指用自下而上快速吹入的气流(进风),穿过固定颗粒,并维持固体颗粒处于不断往复运动状态而形成的固体颗粒床[/color][sup][color=black][/color][/sup][color=black]。[/color]流化床制粒设备目前广泛应用于药品生产过程中,优点显著,该方法是集混合、制粒、干燥、包衣在一个全封闭容器中进行操作的技术,与其它包衣技术相比,具有工艺简单、操作时间短、劳动强度低等特点。目前流化床包衣技术正得到越来越广泛的应用,国内外生产的流化机器的差距也越来越小,这项技术对我国药品生产现代化的发展意义重大。[color=black]此外,[/color]流化床包衣技术具有传质快、传热效率高、流动性好、压缩成型性好等优点。颗粒间较少或几不发生可溶性成分迁移,减小了由此造成片剂含量不均匀的可能性。[color=#191919]包衣是一门将聚合物包裹在固体剂型外形成衣膜的技术,有助于传递药物剂型的许多优势[/color][sup][color=black][/color][/sup][color=#191919]。比如,掩盖片芯中成分的气味,提高物质的稳定性,使药物制剂更加美观,更加干净,并且能够调节药物的释放使药物到达体内再开始释放。药物的包衣使消费者识别和吞咽药物变的更加容易。对于许多制造商来说,包衣可以帮助减少灰尘,并且可以改善药片的机械强度使之经得住触碰,不易破碎。包衣的厚度和均匀性是包衣药物质量好坏的重要指标。研究包衣的厚度对优化包衣设备和工艺有重要的意义。[/color][color=#191919]显微图像测量法[/color][sup][/sup]:[color=#191919]1[/color]、获取药物切片截面。首先,将待测包衣药物切片,切片表面的平整性对包衣厚度的测量至关重要;[color=#191919]2[/color]、显微镜的调节。把切片界面放在显微镜下,调节显微镜的放大倍数和相对位置;[color=#191919]3[/color]、图像传送。用高清数码相机拍摄切片显微图像,并传送至计算机中;[color=#191919]4[/color]、成像测量。在计算机的显示器中显示药片显微图像,利用[color=#191919] Image-Pro Plus [/color][color=#191919]图像处理分析软件标定,并测量包衣的厚度。[/color][color=#191919]拉曼光谱法[/color][sup][/sup]:拉曼光谱法是一种利用激光照射被检测位置发生散射现象,产生与入射光频率不同的散射光谱所进行的分析方法。利用拉曼光谱技术检测灵敏度高,样品基本无需制备,分析速度快,时间短,对样品无接触,无损伤,具有高空间分辨率,以及高光谱分辨率,并且不会对样品造成化学性的,机械的,光化学和热的分解。从检测假冒药品到检测活性物的含量,再到过程分析制造,拉曼光谱技术被广泛应用于生物医学,药物学,文物考古和法庭科学等诸多方面。[color=#191919]测试方法为:激光通过显微镜头聚焦到样品测试点,激发拉曼信号,再由显微镜头收集拉曼信号并传递到光谱仪系统,只要适当控制激光功率密度,热效应不至于破坏样品测试点,可以保证被测样品的完好和信号的真实。[/color][color=#191919]X [/color]射线荧光光谱法:特征[color=#191919] X[/color]射线经过探测器在不同的衍射角上检测,经电路放大,转变为脉冲信号,收集和显示谱线,最后由计算机采集,分析处理谱线。每种元素的原子本身具有独特的电子排列,对于给定特征的[color=#191919] X [/color]射线,能量取决于该原子的原子序数。不同的样本材料会产生不同能量的[color=#191919] X [/color]射线荧光,测定谱线的波长,得到样本中包含的元素,测定谱线的强度,得到该元素的含量,从而确定样本材料的特性,测定包衣的厚度。[color=#191919]太赫兹光谱法:太赫兹成像技术在药物分析以及无损检测等方面有着十分广泛的应用,可以为拉曼成像,[/color][color=#191919]X [/color]射线荧光成像,核磁共振成像以及红外成像提供补充。它可以在不破坏药片包衣的前提下,对包衣的结构情况和包裹情况进行检测分析,并通过传感器进行记录。检测的原理是根据脉冲时间的不同,药片包衣的空腔或微小的异物都可能使太赫兹射线脉冲照射的时间长短发生变化,从而确定包衣的厚度,并且可以检测量化包衣的缺陷和厚度分布。[color=black]近红外([/color][color=black][url=https://insevent.instrument.com.cn/t/1p][color=#3333ff]NIR[/color][/url][/color][color=black])在线检测技术:[/color][url=https://insevent.instrument.com.cn/t/1p][color=#3333ff]近红外光谱[/color][/url]是介于可见光和中红外光之间的电磁辐射波,具备无损、快速、多参数测定、无污染和可在线分析等优点[sup][color=black][/color][/sup][color=#191919],近年来被广泛应用于农业及制药行业中,其中在制药领域,包括制剂过程控制,成品药分析,药品真伪鉴定等多个方面的应用,大大减少了工作量,提升了经济效益。[/color][color=black][url=https://insevent.instrument.com.cn/t/1p][color=#3333ff]NIR[/color][/url]S [/color]是采用近红外的方法直接分析液体、固体粉末、半固体、胶状等多种物态样品,使实验室和工厂的产品分析实现在线化,在几秒钟得到待测参数,与反馈控制技术连用则实现生产过程的在线控制技术[sup][color=black][/color][/sup][color=black]。[/color][color=black]它克服了传统离线分析技术样品预处理复杂以及分析结果滞后的缺陷。[/color][color=black]该方法具有预处理简单、分析速度快、非破坏性及适合于在线分析等优点,在药物的定性鉴别、定量分析及质量控制等方面显示了很大的作用[/color][sup][color=black][/color][/sup][color=black]。[/color][color=black]药品质量与生产过程中的每个环节密切相关。[/color]制药过程关键工艺的监测、控制对于保证药品质量至关重要。[url=https://insevent.instrument.com.cn/t/1p][color=#3333ff]近红外光谱[/color][/url]分析技术在药物的在线检测方面显示了巨大的优势。[color=#191919]带光纤探头的[/color][color=#191919] [url=https://insevent.instrument.com.cn/t/1p][color=#3333ff]NIR[/color][/url] [/color][color=#191919]漫反射光谱仪使用[/color][color=#191919] PLS [/color][color=#191919]模式可以对包衣层进行检测。[/color][color=#191919]已发现微丸样品[url=https://insevent.instrument.com.cn/t/1p][color=#3333ff]近红外光谱[/color][/url]的变化与包衣的厚度之间存在相关性。[/color]在用乙基纤维素[color=#191919](EC)[/color]或羟丙基纤维素[color=#191919](HPMC)[/color]进行包衣的过程中,按一定的时间间隔取样,测定样品的[url=https://insevent.instrument.com.cn/t/1p][color=#3333ff]近红外光谱[/color][/url][sup][color=black][/color][/sup][color=#191919]。[/color][color=#191919]采用二阶导数变换和多元散射校正两种方法对光谱进行处理,然后用主成分分析建立计算包衣厚度的校正模型。[/color]再测定样品的溶出度,考察包衣厚度与溶出度的相关性,从而进行生产工艺的监控。[color=#191919]分析以上方法可知,直接用光学显微镜测量药片横截面的厚度相当的费时费力,但是通常能够得到精确的包衣层厚度的数据。[/color][color=#191919]X [/color]射线荧光光谱法操作快速方便,不受样本大小和形状的限制,但灵敏度偏低。拉曼光谱法与[url=https://insevent.instrument.com.cn/t/1p][color=#3333ff]近红外光谱[/color][/url]法相比,灵敏度更高,但是出现误差的可能性更大。[url=https://insevent.instrument.com.cn/t/1p][color=#3333ff]近红外光谱[/color][/url]法不需要在测量前进行大量复杂的处理,能够节省分析的时间。是最有效的方法,测量简单并且快速,能够基本实现对物体的快速无损检测。[color=#191919]相比其他技术手段[/color][color=#191919],[/color][color=#191919][url=https://insevent.instrument.com.cn/t/1p][color=#3333ff]NIR[/color][/url][/color]在过程控制方面具有快速、无损、样品预处理简单、可以在线监控的优势。可以细致地分析每个技术环节,为先进的理论提供充足的基础资料。[color=#191919]“[/color]质量源于设计([color=#191919]QbD[/color])[color=#191919] ”[/color]以及实时参数放行的理念也要求使用更先进的分析工具帮助人们加深对生产过程的理解,以便设计出更合理的药物生产工艺路线。所以在药品生产过程中,[color=#191919][url=https://insevent.instrument.com.cn/t/1p][color=#3333ff]NIR[/color][/url][/color]将会逐步普及,并成为一项常规的质量检测手段为人们的用药安全提供坚实的保障,为智能制造的早日实现作出重要的贡献。[color=#191919] [/color][color=#191919] [/color][color=#191919] [/color][color=#191919] [/color][color=#191919] [/color][color=#191919] [/color][color=#191919] [/color][color=#191919] [/color][color=#191919] [/color][color=#191919] [/color][color=#191919] [/color][color=#191919] [/color][color=#191919] [/color][color=#191919] [/color]参考文献[color=black] [/color]Naidu [i]et al.[/i] [color=black]PAT-BasedControl of Fluid Bed Coating Process Using [url=https://insevent.instrument.com.cn/t/1p][color=#3333ff]NIR[/color][/url] Spectroscopy to Monitor theCellulose Coating on Pharmaceutical Pellets [/color]. AAPS PharmSciTech, 2016,1149(5): 56-65. Snezana Markovica , Ksenija Poljanec, Janez Kerc [i]et al[/i]. In-line [url=https://insevent.instrument.com.cn/t/1p][color=#3333ff]NIR[/color][/url] monitoring of keycharacteristics of enteric coated pellets . EUR J PHARM BIOPHARM, 2014, 843(19): 170-174. Min-Jeong Lee, Da-Young Seo, Hea-Eun Lee[i] et al[/i].In line [url=https://insevent.instrument.com.cn/t/1p][color=#3333ff]NIR[/color][/url] quantification of film thickness on pharmaceuticalpellets during a fluid bed coating process. [color=#333333]INT J PHARM[/color], 2011, 29(9): 2471-2477. 陆庆华, 陈玉洁,严盈富.薄膜包衣厚度测量方法分析.南昌航空大学学报, 2014, 40(8): 1207-1212. 倪力军,朱静,张立国.[url=https://insevent.instrument.com.cn/t/1p][color=#3333ff]近红外光谱[/color][/url]法测定缓释制剂中冰片释放量.光谱学与光谱分析, 2012, 31(9): 1089-1094. 张振宾, 欧俊杰, 林辉等.[url=https://insevent.instrument.com.cn/t/1p][color=#3333ff]近红外光谱[/color][/url]分析技术在固体制剂生产中的应用.食品与药品,2013, 14(2): 139-142. Roland Hohl, Otto Scheibelhofer, Elena Stocker. Monitoring of a Hot MeltCoating Process via a Novel Multipoint Near-Infrared Spectrometer .AAPS PharmSciTech, 2017, 137(9): 4114-4118. 王小亮, 傅强, 绳金房等.[url=https://insevent.instrument.com.cn/t/1p][color=#3333ff]近红外光谱[/color][/url]技术在制药过程分析中的应用进展.西北药学杂志, 2009, 29(12): 464-469.[align=right] 邱素君,何雁,张国松.[url=https://insevent.instrument.com.cn/t/1p][color=#3333ff]近红外光谱[/color][/url]快速测定柴胡总皂苷肠溶片包衣膜厚度研究.中国药科大学学报,2012,67(7): 78-85.[/align]
(1)由于反应器中微通道宽度和深度比较小,一般为几十到几百微米,使反应物间的扩散距离大大缩短,传质速度快,反应物在流动的过程中短时间内即可充分混合(2)微通道的比表面积一般为5000—50000m2m-3,而在常规反应容器内,比表面积约为100m2m-3,少数为1000m2m-3。微通道的比表面积大,具有很大的热交换效率,即使是激烈的放热反应,瞬间释放出大量反应热也能及时移出,维持反应温度在安全范围内。由于反应物总量少,传热快,特别适用于研究异常激烈的合成反应而避免爆炸的危险。(3)在微通道反应器中进行合成反应时,需要反应物用量甚微,不但能减少昂贵、有毒、有害反应物的用量,反应过程中产生的环境污染物也极少,实验室基本无污染,是一种环境友好、合成研究新物质的技术平台。(4)在微通道反应器中得到产物的量与近代分析仪器,如GC、GC2MS、HPLC及NMR的进样量相匹配,使近代分析仪器可用于直接在线监测反应进行的程度,大大提高了研究合成路线的速度。(5)可以将各种催化剂固定在芯片微通道中得到高比表面积的微催化床,提高催化效率。(6)在微通道反应器中进行合成反应时,反应物配比、温度、压力、反应时间和流速等反应条件容易控制。反应物在流动过程中发生反应,浓度不断降低,生成物浓度不断提高,副反应较少。(7)在微通道反应器中采用连续流动的方式进行反应,对于反应速度很快的化学反应,可以通过调节反应物流速和微通道的长度,精确控制它们在微通道反应器中的反应时间。(8)随着微加工技术的发展,由微传感器、微热交换器、微混合器、微分离器、微反应单元、微流动装置等组成的集成系统,在合成反应研究中受到越来越多的关注。(9)微流控芯片高通量、大规模、平行性等特点使多个或大量微反应器的集成化与平行操作成为可能,从而提高了合成新物质、筛选新药物的效率,大幅度地降低了研究成本。文章来源:http://www.micromeritics.com.cn/news_view.aspx?id=819
寻求流化床造粒,实验室用,要求与样品接触部分是有机类材料,不能有不锈钢含铁类物质。拜托各位,发布内容有效日期17年12月5日-17年12月30日
那位高手能设计或制作小型实验室用秸秆流化床 要求: 物料尺寸:2-4mm 能同时用两种气化气氛 外部电加热 有兴趣的请联系:15940443185
准备购买流化床干燥机,那位厂家能介绍一下产品性能。
我国是以煤炭为主要一次能源的国家,一次能源消费中煤炭的占比达到62%。但我国的煤炭利用技术总体上是落后的,在煤炭的转化利用过程中普遍存在效率低、污染严重等问题。随着能源问题的日益突出,洁净煤技术越来越多地应用于实际生产过程中,其中大规模煤气化、煤气化多联产技术成为了煤炭综合应用的主要方向之一。“十一五”期间,煤气化属于国家鼓励项目,其中明确指出新型煤化工领域将重点开发和实施煤的焦化技术、大型煤气化技术和以煤气化为核心的“多联产”技术。2. 煤气化原理煤炭气化是指煤在特定的设备内,在一定温度及压力下使煤中有机质与气化剂(如蒸汽/空气或氧气等)发生一系列化学反应,将固体煤转化为含有CO、H2、CH4等可燃气体和CO2、N2等非可燃气体的过程。气化过程发生的反应包括煤的热解、气化和燃烧反应。煤的热解是指煤从固相变为气、固、液三相产物的过程。煤的气化和燃烧反应则包括两种反应类型,即非均相气-固反应和均相的[url=https://insevent.instrument.com.cn/t/Mp][color=#3333ff]气相[/color][/url]反应。煤炭气化时,必须具备三个条件,即气化炉、气化剂、供给热量,三者缺一不可。煤气化工艺根据气化炉内煤料与气化剂的接触方式不同可区分为固定床(移动床)、流化床、气流床,此外还有地下煤气化工艺。3. 煤气分析仪的原理和技术特点近年来红外煤气分析仪越来越多地应用于实际煤气化煤气分析当中。 红外煤气分析仪采用红外传感器测量煤气成分中的CO、CO2、CH4、CnHm的浓度,使用热导传感器测量H2的浓度,使用电化学传感器测量O2浓度,同时根据测量成分的浓度,计算得到煤气的理论热值。红外煤气分析仪取代了奥氏气体分析仪的人工取样和人工分析环节,可实现自动化测量,避免了人工误差;同时预处理系统和仪器相对燃烧法热值仪具有结构简单,操作维护方便的特点,更加适合煤气化实时在线的分析要求。红外煤气分析仪具备H2测量补偿功能,保证了H2浓度的准确测量。热导传感器用于测量多种混合气体时,必然要考虑到煤气中其他气体的影响因素。煤气主要成分中CO、O2 与背景气N2的热导系数相当,对H2的测量结果影响不大,但是CO2 、CH4 对H2测量影响明显。通过理论分析及实验表明,如果气体成分中含有CO2,会使H2的测量读数偏低;如果气体成分中含有CH4,会使H2的测量读数偏高。因此为了得到准确的H2含量,应对H2浓度进行CO2 、CH4的浓度校正。煤气分析仪对煤气的各气体成分进行分析,并将各种气体的相互影响进行了浓度修正和补偿,消除煤气中其他成分对H2的影响,保证了H2测量值的准确性。此外 煤气分析仪采用了旁流扩散式的热导检测池,流量在0.3―1.5L/min的范围内变化对热导的测量没有影响,减少了因流量波动造成H2测量的误差影响。煤气化过程中产生的煤气中的碳氢化合物除了CH4外,还有少量的CnHm,大多数红外分析仪仅以CH4为测试对象,折合成碳氢化合物总量计算热值。根据红外吸收原理,如图1,乙烷等碳氢化合物在甲烷的特征波长3.3um左右有明显吸收干扰。当煤气中其他碳氢化合物含量较大时,CH4的测试值会明显偏大,导致热值测试不准,其热值测试值也无法保证精度。甲烷、乙烷、丙烷、丁烷的红外吸收光谱图1:甲烷、乙烷、丙烷、丁烷的红外吸收光谱红外煤气分析仪采用了特殊的气体滤波技术,可实现无干扰的CH4测量,准确反应混合煤气中CH4和CnHm成分的实际变化,有利于热值的准确分析。4. 煤气分析仪在煤气化中的应用根据煤气化应用领域的不同,煤气分析仪可实现煤气热值分析和煤气成分分析两种用途。通常的应用如下:4.1 工业燃气应用作为工业燃气,一般热值要求为1100-1350大卡热的煤气,可采用常压固定床气化炉、流化床气化炉均可制得。主要用于钢铁、机械、卫生、建材、轻纺、食品等部门,用以加热各种炉、窑,或直接加热产品或半成品。实际应用中通常需要控制加热温度,以达到工艺或质量控制目的,燃气的热值稳定性就尤为重要。红外煤气分析仪针对H2和CH4的测量采用了测量补偿技术,可保证实际热值测试结果的准确性,为燃气的燃烧测控提供了有效有力的数据依据。4.2 民用煤气应用民用煤气的热值一般在3000-3500大卡,同时还要求CO小于10%,除焦炉煤气外,用直接气化也可得到,采用鲁奇炉较为适用。与直接燃煤相比,民用煤气不仅可以明显提高用煤效率和减轻环境污染,而且能够极大地方便人民生活,具有良好的社会效益与环境效益。出于安全、环保及经济等因素的考虑,要求民用煤气中的H2、CH4、及其它烃类可燃气体含量应尽量高,以提高煤气的热值;而CO有毒其含量应尽量低。 红外煤气分析仪测试煤气热值可知道气化站的煤气混合,保证燃气热值;同时可测得CO、H2、CH4的实际浓度,有效控制CO浓度,保证燃气安全。4.3 冶金还原气应用煤气中的CO和H2具有很强的还原作用。在冶金工业中,利用还原气可直接将铁矿石还原成海棉铁;在有色金属工业中,镍、铜、钨、镁等金属氧化物也可用还原气来冶炼。因此,冶金还原气对煤气中的CO含量有要求。 红外煤气分析仪可实时有效测量CO或H2浓度,指导调整气化工艺,保证产气效率。4.4 化工合成原料气随着新型煤化工产业的发展,以煤气化制取合成气,进而直接合成各种化学品的路线已经成为现代煤化工的基础,主要包括合成氨、合成甲烷、合成甲醇、醋酐、二甲醚等。化工合成气对热值要求不高,主要对煤气中的CO、H2等成分有要求,一般德士古气化炉、Shell气化炉较为合适。目前我国合成氨的甲醇产量的50%以上来自煤炭气化合成工艺。若煤气成分中CO2浓度过高,直接会影响合成工序压缩机的运行效率(一般降低10%左右),必然造成电耗和压缩机维修费用增加。红外煤气分析仪用于CO、CO2、H2等气体的浓度测量,用于指导合成气工艺控制,可保证化工产品的产量和质量,同时可达到节能的目的。4.5 煤制氢应用氢气广泛的用于电子、冶金、玻璃生产、化工合成、航空航天、煤炭直接液化及氢能电池等领域,目前世界上96%的氢气来源于化石燃料转化。而煤炭气化制氢起着很重要的作用,一般是将煤炭转化成CO和H2,然后通过变换反应将CO转换成H2和H2O,将富氢气体经过低温分离或变压吸附及膜分离技术,即可获得氢气。实际应用中由于CO含量的增加,必然会导致变换工序中变换炉的负荷增加。它不但会使催化剂的使用寿命缩短,而且使变换炉蒸汽消耗增加。红外煤气分析仪用于煤气成分分析,提供煤气中各气体成分的浓度数据,指导气化和转换工艺的控制,可起到节能增效的作用。此外, 红外煤气分析仪还可在煤气化多联产的应用中提高化工生产效率,提供清洁能源,改进工艺过程,以达到效益大化,有助于提升产业技术水平。5. 结论随着煤气化技术在国内的应用和发展,对于煤气化过程的监测和控制提出了更高的要求。 红外煤气分析仪集成了红外、热导和电化学三种气体传感器技术,可实现对煤气的成分分析和热值分析。在实际应用中解决了H2测量补偿和CH4测量抗干扰的问题,更广泛地应用于工业燃气、民用煤气、冶金、化工等行业,可指导工艺控制和改善,并达到节能增效的作用,有利于促进煤气化技术的提升。
我公司采用微光电技术生产高精度微型近红外光谱仪,并在此基础上配置嵌入式计算机系统,形成便携式近红外光谱分析仪欢迎有感兴趣的厂家与我们联系。
石灰石反应活性对脱硫效率的影响 【摘要】:简要说明循环流化床锅炉炉内脱硫机理,分析两种矿石粉在循环流化床锅炉加钙脱硫实际运行中对脱硫效率的影响;从两种矿石粉各自物理化学特性浅析用循环流化床锅炉脱硫优劣做出评价,对提高脱硫效率提出建议。【关键词】:循环流化床锅炉;石灰石;脱硫。1、石灰石脱硫原理与影响脱硫效率的因素:1.1 脱硫原理循环流化床锅炉炉内脱硫是采用石灰石干法脱硫来实现的,即:将进入炉膛内的CaCO3高温煅烧分解成CaO,与烟气中的SO2发生反应生成CaSO4,随炉渣排出,从而达到脱硫目的。石灰石脱硫过程主要分为以下三步:1.1.1 石灰石煅烧:在常压流化床锅炉中石灰石中的CaCO3遇热煅烧分解为CaO煅烧析出CO2时,会生成并扩大CaO中的孔隙,增加其表面积,为下步的固硫反应奠定基础。反应方程: CaCO3→CaO +CO21.1.2 硫的析出与氧化:煤中的硫主要以黄铁矿、有机盐、和硫酸盐三种形式存在,有关试验表明,煤在加热并燃烧时,SO2的析出呈现明显的阶段性,黄铁矿燃烧氧化后生成SO2,有机硫在200℃分解并释放出H2S、硫醚、硫醇等,这些物质氧化后都生成SO2。反应方程:S+O2=SO21.1.3 硫的固化反应:SO2与O2克服外部的扩散阻力,到达氧化钙的表面,并扩散到微孔中,吸附在微孔的表面,最终反应生成CaSO4,以达到脱硫的效果。反应方程: CaO + SO2 + 1/2O2 →CaSO4这是一个比较复杂的,涉及到反应气体在多孔氧化钙及产物层硫酸钙内扩散的复杂反应。2、石灰石反应活性对脱硫效率的影响2.1 石灰石反应活性:主要表现为石灰石煅烧后生成空隙的大小、分布及比表面积等。不同石灰石的反应活性差别主要在于煅烧后微孔的结构不同,对脱硫反应来说, 直径大的孔隙有利于硫固化反应的快速进行,孔隙越小则产生扩散阻力越大,不利于脱硫反应进行,微孔很容易被CaSO4堵塞,其表面利用率更低,所使用的石灰石固有的反应活性在对炉内脱硫效率起决定性的作用。2.2 此外,石灰石所含杂质的影响:有些杂质的存在会对石灰石的转化率产生影响,使CaO颗粒在固硫过程中孔隙被堵塞的时间推迟,因而可以提高CaO颗粒的利用率;同样有些杂质的存在降低了石灰石的耐煅烧性,高温下CaO表面的空隙减少甚至是被烧结,比表面急剧下降,使固硫反应很难进行下去,极大程度的降低了脱硫效率。3、试验3.1 原材料来自A和B两处矿石粉,为了便于比较两处石粉各项物理化学指标,均采用75微米中位粒径作为试验对象,常规分析项目见下(表 1): H2O CaCO3% LOI%/850℃ LOI%/950℃A 0.38 92.94 39.99 41.53B 0.34 96.50 42.54 42.65 B矿石粉钙含量高于A矿石粉,两种矿石粉在950℃下烧失量比较极近,且接近于理论值(44%),表明两种石灰石在公司当前流化床密相区温度维持950℃的运行条件下均能够有效的分解,脱硫效率则取决于分解后CaO表面的孔隙特性以及比表面积的大小,通过高压电子束扫描成像仪对样品扫描和拍照,以及对样品的比表面积进行测量,综合分析两种石灰石的反应活性,850℃和950℃煅烧后比表面积的数据(表2):m2/g 850℃ m2/g 950℃A 6.119 2.077B 10.215 8.265 石灰石在高于770℃时开始逐步分解,在850℃附近为最佳反应温度,当温度高于900℃CaCO3晶体有部分被烧结,使孔结构减小,甚至消失,温度越高这种孔隙的烧结现象越来越严重,SO2向孔隙内部扩散变得比较困难,脱硫效率也随之急剧下降,由(表2)看出A船山矿石粉在高温下的烧结现象尤为严重,通过950℃下扫描图片也能得出同样的结论: A(图1) B(图2)B矿石粉在同等单位质量下,能够提供高出A矿石粉4倍之多的比表面积,但并不意味着脱硫效率也会有同等倍率的提高,因为单位质量同等粒度样品比表面积越高则说明其微孔分布相对较广,孔直径也相对偏小,小孔径容易造成CaSO4在入口处产生堵塞,降低石灰石的利用率。4、其他影响脱硫效率的因素:4.1 温度对脱硫效率的影响分析循环流化床底部的密相区处于“氧化―还原”气氛的不断更迭状态中, 并有80%左右的时间内处于还原性气氛,这主要是由于煤碳在燃烧初期产生较多的CO,以及煤的挥发分在密相区析出时产生还原性气体,CO、H2不能在密相区完全燃烧所致。脱硫反应会有各种不同的途径和产物,在密相区还原性气氛下,可出现以下的反应:CaSO4 +CO →CaO + SO2 + CO2 CaSO4 +4CO→CaS + 4CO2密相区内形成的CaS在进入稀相区后与氧发生分解:CaS +1.5 O2→SO2+CaO尤其是在床温大于850℃时候,CaS的分解将加剧,释放出已经捕集到的SO2。当密相区温度达到900℃以上时候,CaO孔结构被烧结,阻止SO2和O2向CaO内部扩散,使脱硫效率降低;同时,CaSO4在密相区内将发生分解反应,再次将SO2释放出来:CaSO4 +CO →CaO + SO2 + CO2根据当前我司流化床运行的实际情况,密相区内温度正常维持在950℃左右,该床温下的钙的利用率很低。4.2 Ca/S比:在CaO与SO2 结合生成CaCO3 过程中,分子明显加大,会堵塞气体分子进入多孔的石灰石颗粒中的内层通道,阻碍脱硫反应进行。因此,加入锅炉中的石灰石不可能全部用于脱硫,在实际生产运行中投入的钙硫比要大于理论钙硫比,(图4)反应了Ca/S比与脱硫效率的关系:4.3 石灰石的粒径分布石灰石粒径分布对床内脱琉反应工况具有较大的影响。较小的颗粒容易从分离器中逃逸不被捕捉送回炉膛充分利用。CaO与SO2反应后在石灰石颗粒表面形成CaSO4,致密的CaSO4层将阻止SO2向 CaO内部扩散。所以,石灰石颗粒越大,其相对孔容积和比表面积也越小,CaO的有效利用率也下降。5、结论:实验表明:B矿石粉含量高于A矿石粉,具有较好的耐煅烧性,在循环流化床锅炉炉内脱硫的应用中能够提供更广的反应接触面,公司CFB正常运行床温维持在950℃附近,A矿石粉在该温度下烧结现象严重,反应活性较弱。相比之下,B矿石粉更适用于干法炉内脱硫。
【亚洲流体网讯】 水质在线分析仪表及系统 由于环保的要求,水质在线分析仪表及系统已经成了环保部门对辖区水质状况进行实时监测的主要手段,已能够实时、连续、稳定、可靠地提供准确、快速的监测数据。作为水质自动监测,还要实行远程监控,达到掌握主要流域重点断面水体的水质状况,预警预报重大或流域性水质污染事故、解决跨行政区域的水污染事故纠纷、监督总量控制、排放达标情况等目的。在水质自动监控系统网络中,中心站通过卫星和电话拨号两种通讯方式实现对子站的实时监视,托管站也可以通过电话拨号方式实现对所托管子站的实时监控。其他经授权每个子站是一个独立的水质自动监测系统,一般子站有一台或多台的多参数水质自动化分析仪组成,另有固定式子站和流动式子站(拖车—监测小屋)共三种。子站分采水单元,配水单元,分析单元,控制单元,子站站房及配套设置。 国内在水质氨氮监测等复杂仪表的深入研究方面也取得很多成果。如北京市化学工业研究院研制出自动化程度很高的智能分析系统,为环境管理提供了有力的监管工具,目前我国已有30多家企业有了认证合格的相关产品,国内在2003年也颁布了“氨氮水质自动分析仪技术要求”(HJ/T101-2003)标准,规定了地表水、工业污水和市政污水的基于电极法和分光光度法的氨氮水质自动分析仪的技术性能要求和性能试验方法。 气体在线分析仪表及系统 从环保的角度看,气体在线分析仪表及系统比水质在线分析仪表及系统更为重要,大气污染物排放标准等,从法规上要求安装连续排放监测系统CEMS。近十余年间,我国固定污染源安装了1.8万套CEMS,具体标准有HJ/T75固定污染源烟气排放连续监测技术规范、HJ/T76固定污染源烟气排放连续监测系统技术要求及检测方法以及HJ/T212污染源在线自动监控(监测)系统传输标准。 目前还试点燃煤电厂排放烟气中汞的连续自动监测、超声波流速测定仪解决低流速(=3m/s)烟气测定、适应宽范围气体浓度的测定专项技术。此外,美国博纯公司提供的一种创新的冷干直抽法CEMS样气预处理技术是样气除湿的好技术。实现由“点末端监控”向“全过程监控”的转变,协调实验室检测项目、便携式仪器检测项目等控制工程网版权所有,适应新形势下对生态文明的要求。 为了环保的需要,环保部已修改了《环境空气质量标准》,将PM2.5列入环境空气基本监测项目,有条件的城市均开展了大气颗粒物PM2.5的监测。目前所用监测仪大部分是引进国外产品。为此,国内如青岛佳明测控公司也进行了开发。目前国际上的监测方法有微量振荡天平法和β射线法,β射线法按照输出方式不同,分为实时方法和时均值方式。青岛佳明测控公司就采用β射线法的实时显示方式。该公司解决了计数器选择和数据处理、等在炼油、石化、化工行业的应用 在炼油、石化行业、在线分析仪表的选用越来越普遍,投资越来越上升。据中石化咨询公司谢怀仁、石彦秋提供的数据显示:某大型乙烯装置,进口自控仪表设备费为2亿元,进口在线分析仪表设备费为5000万元,即4:1;某大型聚乙烯装置,进口自控仪表设备费8000万元,进口在线分析仪表设备费1700万元,其中远红外总碳氢分析仪500万元,在线气相色谱仪500万元,氧分析仪400万元,水分析仪300万元,即4:0.85;某大型硫磺回收装置,进口自控仪表设备费500万元,进口在线分析仪设备费250万元,即2:1;某油品长输管线分输站,进口自控仪表设备费200万元,进口在线分析仪设备费100万元,即2:1。而在线分析仪主要集中在如下几方面:在线质量分析仪(工业色谱、全镏程分析仪、质谱仪等)、在线近红外分析仪、工业核磁共振仪、放射性仪表(料位密度测量)以及环境监测和水质分析仪等。 通力分析自控技术公司罗海涛的“炼油过程应用在线分析技术提高油品品质和轻质油收率”的报告中,对油品质量在线分析工作进行了总结,主要产品有汽油镏程在线分析仪、倾点在线分析仪、饱和蒸汽压在线分析、粘度在线分析仪以及闪点在线分析仪等油品质量分析仪表,以及各类油品预处理系统、分析小屋及分析仪表成套系统、远程工作站,先后在兰州石化、新疆克拉玛依、天津大港石化、大连石化、华北石化、湖南长岭石化、广州石化、上海高桥炼油厂、陕西榆林石化、洛阳石化、河北沧州石化、山东济南石化、西安石化、新疆独山子石化、武汉石化、江苏清江石化、延安炼油厂等30个炼油企业得到了很好的应用。如武汉石化焦化柴油项目进行卡边操作,柴油95%点由投用前平均357℃提前到了投用后363℃,平均提高了6℃,按每提高1℃即产生680万元计算,柴油95%点提高了6℃,每年增加3500万元以上的经济效益。独山子石化公司炼油厂加氢裂化车间罗祥生在“全镏程在线分析仪在加氢裂化装置中的应用探讨”一文中指出,该厂60万加氢裂化装置采用了IDA系列全镏程在线分析仪(通力产品),2011年10月底开始调试,2012年1月15日正式投用。至今运行平稳,实现生产过程在线质量监测、全塔优化控制,年经济效益为1519.3万元。 在医药、食品行业的应用 医药等行业对于在线分析仪表及系统的需求,从PAT过程分析技术来说,与石化等行业是相似的,特别是塔、釜、罐等工艺设备的测控,燃烧、冷却等控制,节能环保的要求等,并无特别之处,但制药流程后处理部分,如颗粒和药丸干燥过程的测量控制,在线分析仪表及系统仍有用武之地。济南金宏利实业公司董海平等人在“AOTF-NIR光谱技术在线测量G/att流化床湿度”一文中,介绍了颗粒和药丸干燥过程的含水量和湿度的控制。作为现代制药领域对湿度控制主要手段,流化床喷雾制粒是一种复杂的生产过程,物料含水量变动较大,药物颗粒表的湿度和内部湿度准确的检测是个难题。将近红外(NIR)反射光谱法用于流化床干燥制粒,监测喷雾阶段并可以测定干燥终点。通过在线红外技术收集干燥不同阶段产品的近红外光谱图,结合其它过程测量技术组合建立线性校正模型,可以实时监测干燥过程。具体采用luminar3075小型AOTF-NIR光谱仪(美国Brimrose公司),AOTF为声光可调滤光器(Acousto-optictunablefilter),结构简单,光学系统无移动性部件,体积小,集光能力强,波长切换快、重现性好,程序化的波长控制使得灵活性强,在现场使用广泛。本文转载:亚洲流体网
长春长光格瑞光电技术有限公司(以下简称长光格瑞)以长春光机所光栅技术中心部分技术人员为核心组建,于2016年12月22日正式注册成立。依托于长春光机所光栅技术中心在光栅、分光部件以及光谱仪器设备研发过程中所积累的50余年的经验,长光格瑞将致力于高性能衍射光学元/部件的研发、生产和销售为一体,为吉林省和全国的光谱仪器生产领域机构提供具有国际竞争力的产品和技术解决方案,打破国际公司对我国的技术和产品的价格垄断,推动我国分析仪器制造产业迈向中高端水平。同时借鉴长春光机所光栅中心在航空航天、军工产品、民用产品等领域多年积累的研发、生产、管理等经验,针对省内及全国分析仪器企业围绕技术开发、技术合作、技术转让提供产品中试服务。长光格瑞将继承长春光机所特有的“安、专、迷”的匠人精神,以带动吉林省和我国分析仪器制造产业发展为历史使命,本着“发展、创新、共享、共赢”的企业精神,为吉林省光电子产业的发展壮大贡献一份力量。公司产品可根据客户不同需求提供产品开发定制服务,附件是公司两款微型光纤光谱仪GRS-100(195-345nm),GRS-200(200-850nm)产品样机展示说明。其他产品如格瑞成像光谱仪、中阶梯光栅光谱仪产品说明会逐步在后期提供完善的产品信息。我们现在所做的就是为国内同行业真正具有在研发、生产、销售的企业累计经验,道路很艰辛,但是我们会一直向前,做光栅我们是专业的,做微型光纤光谱仪我们是认真的。服务销售热线:13756468988;马先生。
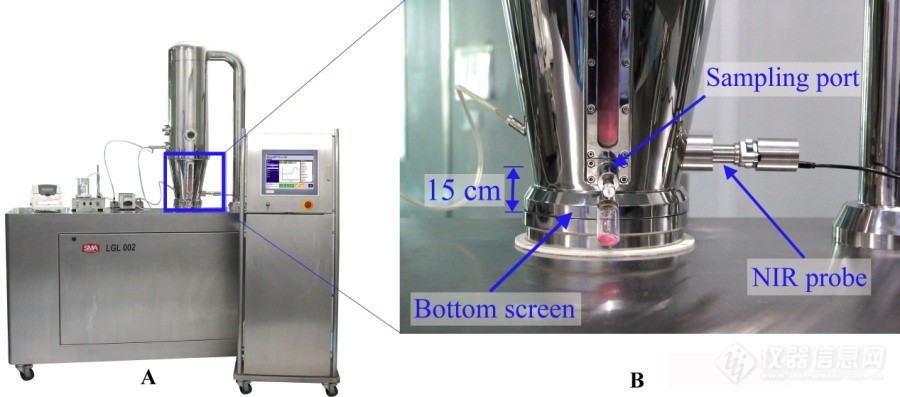
[align=center][font='times new roman'][size=20px][b]流化床混合过程[/b][/size][/font][font='times new roman'][size=20px][b][url=https://insevent.instrument.com.cn/t/1p][color=#3333ff]NIR[/color][/url]S[/b][/size][/font][font='times new roman'][size=20px][b]在线监测[/b][/size][/font][font='times new roman'][size=20px][b]API[/b][/size][/font][font='times new roman'][size=20px][b]含量[/b][/size][/font][font='times new roman'][size=20px][b]研究[/b][/size][/font][/align][font='times new roman'][size=16px]对小试流化床进行设备改造,将微型[url=https://insevent.instrument.com.cn/t/1p][color=#3333ff]近红外光谱仪[/color][/url]内嵌到流化床腔室中,通过实验设计,将常规流化床混合过程中监测[/size][/font][font='times new roman'][size=16px]腔[/size][/font][font='times new roman'][size=16px]室内原料药[/size][/font][font='times new roman'][size=16px]([/size][/font][font='times new roman'][size=16px]API[/size][/font][font='times new roman'][size=16px])[/size][/font][font='times new roman'][size=16px]浓度变化时遇到的变异性来源(原辅料、工艺过程、环境等)尽可能包含进去。采用接触式采集模式进行在线校正集光谱采集,将在线采集到的光谱进行光谱选择,预处理和波段选择,在有限的[/size][/font][font='times new roman'][size=16px]API[/size][/font][font='times new roman'][size=16px]消耗情况下建立定量[/size][/font][font='times new roman'][size=16px]PLS[/size][/font][font='times new roman'][size=16px]模型,最后用外部验证集验证模型的稳定性和预测能力。[/size][/font][font='times new roman'][size=18px][b]材料[/b][/size][/font][align=left][font='times new roman'][size=16px][b]试剂[/b][/size][/font][/align][font='times new roman'][size=16px]本文[/size][/font][font='times new roman'][size=16px]中使用的原辅料及试剂如表。[/size][/font][align=center][font='times new roman']表实验所用试剂及详细信息[/font][/align][table][tr][td][align=center][font='times new roman']试剂名称[/font][/align][/td][td][align=center][font='times new roman']厂家[/font][/align][/td][td][align=center][font='times new roman']批号[/font][/align][/td][/tr][tr][td][align=center][font='times new roman']对乙酰氨基[/font][font='times new roman']酚[/font][/align][/td][td][align=center][font='times new roman']山东昌达生物科技有限公司[/font][/align][/td][td][align=center][font='times new roman']190437[/font][font='times new roman'],[/font][font='times new roman']190438[/font][font='times new roman'],[/font][font='times new roman']190439[/font][/align][/td][/tr][tr][td][align=center][font='times new roman']微晶纤维素[/font][/align][/td][td][align=center][font='times new roman']安徽山河药用辅料股份有限公司[/font][/align][/td][td][align=center][font='times new roman']180559[/font][/align][/td][/tr][tr][td][align=center][font='times new roman']玉米淀粉(药品级)[/font][/align][/td][td][align=center][font='times new roman']山东聊城华阳医药辅料有限公司[/font][/align][/td][td][align=center][font='times new roman']18020501[/font][/align][/td][/tr][tr][td][align=center][font='times new roman']玉米淀粉(食品级)[/font][/align][/td][td][align=center][font='times new roman']北京闵松经贸有限公司[/font][/align][/td][td][align=center][font='times new roman']产品标准号:[/font][font='times new roman']GB31637[/font][/align][/td][/tr][tr][td][align=center][font='times new roman']一[/font][font='times new roman']水合乳糖[/font][/align][/td][td][align=center][font='times new roman']镇江市康富生物工程有限公司[/font][/align][/td][td][align=center][font='times new roman']20180323[/font][/align][/td][/tr][tr][td][align=center][font='times new roman']羟丙基甲基纤维素[/font][/align][/td][td][align=center][font='times new roman']安徽山河药用辅料股份有限公司[/font][/align][/td][td][align=center][font='times new roman']180205[/font][/align][/td][/tr][tr][td][align=center][font='times new roman']氢氧化钠[/font][/align][/td][td][align=center][font='times new roman']上海艾览化工科技有限公司[/font][/align][/td][td][align=center][font='times new roman']20190610[/font][/align][/td][/tr][/table][align=left][font='times new roman'][size=16px][b]仪器和软件[/b][/size][/font][/align][font='times new roman'][size=16px]LGL 002[/size][/font][font='times new roman'][size=16px]实验型流化床(山东新马制药装备有限公司);[/size][/font][font='times new roman'][size=16px]Micro [url=https://insevent.instrument.com.cn/t/1p][color=#3333ff]NIR[/color][/url] PAT-U [/size][/font][font='times new roman'][size=16px]微型[url=https://insevent.instrument.com.cn/t/1p][color=#3333ff]近红外光谱仪[/color][/url](美国[/size][/font][font='times new roman'][size=16px]Viavi[/size][/font][font='times new roman'][size=16px] Solutions[/size][/font][font='times new roman'][size=16px]公司);耐高温外接金属探[/size][/font][font='times new roman'][size=16px]头;紫外分光光度计;烘箱;干燥器;[/size][/font][font='times new roman'][size=16px]M[/size][/font][font='times new roman'][size=16px]atlab[/size][/font][font='times new roman'][size=16px] 2016b[/size][/font][font='times new roman'][size=16px](美国[/size][/font][font='times new roman'][size=16px]Mathworks[/size][/font][font='times new roman'][size=16px]公司);[/size][/font][font='times new roman'][size=16px]Unscrambler[/size][/font][font='times new roman'][size=16px] X 10.4 ([/size][/font][font='times new roman'][size=16px]挪威[/size][/font][font='times new roman'][size=16px] CAMO [/size][/font][font='times new roman'][size=16px]公司[/size][/font][font='times new roman'][size=16px]) orign85[/size][/font][font='times new roman'][size=16px](美国[/size][/font][font='times new roman'][size=16px]OriginLab[/size][/font][font='times new roman'][size=16px]公司)。[/size][/font][font='times new roman'][size=18px][b]方法[/b][/size][/font][align=left][font='times new roman'][size=16px][b]实验设计[/b][/size][/font][/align][font='times new roman'][size=16px]实验设计([/size][/font][font='times new roman'][size=16px]DOE[/size][/font][font='times new roman'][size=16px])的目的是将流化床混合过程中监测原料药([/size][/font][font='times new roman'][size=16px]API[/size][/font][font='times new roman'][size=16px])含量[/size][/font][font='times new roman'][size=16px]变化时遇到的变异性来源,包括原辅料理化性质、工艺过程参数、环境参数等尽可能包含进去。对于工艺过程因素,[/size][/font][font='times new roman'][size=16px]通过控制排风机开启的比例,选择了两种不同的进风比例[/size][/font][font='times new roman'][size=16px](15%[/size][/font][font='times new roman'][size=16px]和[/size][/font][font='times new roman'][size=16px]25%)[/size][/font][font='times new roman'][size=16px]来[/size][/font][font='times new roman'][size=16px]模拟在正常混合过程中每个校正集批次通过探头时的动态粉末流动量[/size][/font][font='times new roman'][size=16px]及流动速度[/size][/font][font='times new roman'][size=16px]。[/size][/font][font='times new roman'][size=16px]此外,混合过程中进风温度设定了两个不同的水平,分别为[/size][/font][font='times new roman'][size=16px]50[/size][/font][font='times new roman'][size=16px]℃[/size][/font][font='times new roman'][size=16px],[/size][/font][font='times new roman'][size=16px]70[/size][/font][font='times new roman'][size=16px]℃[/size][/font][font='times new roman'][size=16px],模拟实际混合过程中进风温度的预期范围。对于环境可变性,整个校正集所有混合批次,在[/size][/font][font='times new roman'][size=16px]20%[/size][/font][font='times new roman'][size=16px]和[/size][/font][font='times new roman'][size=16px]40% RH[/size][/font][font='宋体'][size=16px]([/size][/font][font='times new roman'][size=16px]设置点[/size][/font][font='宋体'][size=16px])[/size][/font][font='times new roman'][size=16px]条件下进行。[/size][/font][font='times new roman'][size=16px]64[/size][/font][font='times new roman'][size=16px]个校正集批次以全因子的方式设计,[/size][/font][font='times new roman'][size=16px] [/size][/font][font='times new roman'][size=16px]7[/size][/font][font='times new roman'][size=16px]个批次和批次[/size][/font][font='times new roman'][size=16px]8[/size][/font][font='times new roman'][size=16px]共计[/size][/font][font='times new roman'][size=16px]8[/size][/font][font='times new roman'][size=16px]个配方批次在两个进风温度设定水平、两个进风量设定点和两个环境湿度设定点条件下完成。[/size][/font][align=left][font='times new roman'][size=16px][b]设备改造及在线光谱采集[/b][/size][/font][/align][font='times new roman'][size=16px]原始光谱由[/size][/font][font='times new roman'][size=16px]Micro [url=https://insevent.instrument.com.cn/t/1p][color=#3333ff]NIR[/color][/url] PAT-U [/size][/font][font='times new roman'][size=16px]微型[url=https://insevent.instrument.com.cn/t/1p][color=#3333ff]近红外光谱仪[/color][/url](美国[/size][/font][font='times new roman'][size=16px]Viavi[/size][/font][font='times new roman'][size=16px] Solutions[/size][/font][font='times new roman'][size=16px]公司)漫反射模块在线接触式采样方式直接采集,保证了光谱的质量。为了避免温度对光谱仪的影响,[/size][/font][font='times new roman'][size=16px]PAT-U[/size][/font][font='times new roman'][size=16px]光谱仪连接到一个耐热金属探头上,然后将光谱仪及探头固定在物料车一侧,距底部筛网[/size][/font][font='times new roman'][size=16px]15[/size][/font][font='times new roman'][size=16px] [/size][/font][font='times new roman'][size=16px]cm[/size][/font][font='times new roman'][size=16px]高,与取样口在同一水平线且垂直于取样口,既不影响在线光谱的采集又保证了用于光谱采集的物料和取出的样品有相同或相似的理化性质。光谱仪探头的蓝宝石窗口附近配有吹扫装置,在光谱采集过程中,每[/size][/font][font='times new roman'][size=16px]30[/size][/font][font='times new roman'][size=16px] [/size][/font][font='times new roman'][size=16px]s[/size][/font][font='times new roman'][size=16px]对采集窗口进行一次吹扫,防止其被物料覆盖或者污染[/size][/font][font='times new roman'][size=16px][color=#080000][67, 68][/color][/size][/font][font='times new roman'][size=16px],[/size][/font][font='times new roman'][size=16px]详细信息如图所示。[url=https://insevent.instrument.com.cn/t/1p][color=#3333ff]近红外光谱[/color][/url]每[/size][/font][font='times new roman'][size=16px]3[/size][/font][font='times new roman'][size=16px] [/size][/font][font='times new roman'][size=16px]s[/size][/font][font='times new roman'][size=16px]自动采集一次,波长范围为[/size][/font][font='times new roman'][size=16px]908.1 nm-1676.0 nm[/size][/font][font='times new roman'][size=16px],每张光谱平均扫描[/size][/font][font='times new roman'][size=16px]100[/size][/font][font='times new roman'][size=16px]次。[/size][/font][img]https://ng1.17img.cn/bbsfiles/images/2020/09/202009170817236006_4126_3890113_3.png[/img][align=center][font='times new roman']图[/font][font='times new roman']A[/font][font='times new roman']流化床混合系统设备图[/font][font='times new roman'];[/font][font='times new roman']B[/font][font='times new roman'][url=https://insevent.instrument.com.cn/t/1p][color=#3333ff]近红外光谱仪[/color][/url]及探头的位置[/font][/align][font='times new roman'][size=16px][b]一级数据的测定[/b][/size][/font][font='times new roman'][size=16px]每个混合批次按经验预混合[/size][/font][font='times new roman'][size=16px]5[/size][/font][font='times new roman'][size=16px] [/size][/font][font='times new roman'][size=16px]min[/size][/font][font='times new roman'][size=16px]至基本均匀后,进行在线光谱采集。光谱采集的同时进行取样,每次[/size][/font][font='times new roman'][size=16px]取样约[/size][/font][font='times new roman'][size=16px]为[/size][/font][font='times new roman'][size=16px]3[/size][/font][font='times new roman'][size=16px] [/size][/font][font='times new roman'][size=16px]g[/size][/font][font='times new roman'][size=16px],[/size][/font][font='times new roman'][size=16px]64[/size][/font][font='times new roman'][size=16px]个校正集批次共收集[/size][/font][font='times new roman'][size=16px]64[/size][/font][font='times new roman'][size=16px]个样品。水分含量的测定采用药典规定的干燥失重法[/size][/font][font='times new roman'][size=16px]([/size][/font][font='times new roman'][size=16px]LOD[/size][/font][font='times new roman'][size=16px])[/size][/font][font='times new roman'][size=16px][color=#080000][69][/color][/size][/font][font='times new roman'][size=16px],在烘箱中完成。[/size][/font][font='times new roman'][size=16px]API[/size][/font][font='times new roman'][size=16px]含量的测定[/size][/font][font='times new roman'][size=16px]用[/size][/font][font='times new roman'][size=16px]UV[/size][/font][font='times new roman'][size=16px]法[/size][/font][font='times new roman'][size=16px]。[/size][/font][font='times new roman'][size=16px][b]模型的建立[/b][/size][/font][font='times new roman'][size=16px]通过实验设计,在实验模拟型流化床上用有限的物料采集到不同工艺参数、不同环境条件下的校正集光谱,用于建立[/size][/font][font='times new roman'][size=16px]PLS[/size][/font][font='times new roman'][size=16px]定量分析模型。然后,通过不同的光谱选择方法消除异常光谱的干扰。为了进一步提高模型的预测能力,对光谱选择处理后的校正集光谱进行预处理和波段选择,[/size][/font][font='times new roman'][size=16px]通过交互验证均方根误差[/size][/font][font='times new roman'][size=16px]([/size][/font][font='times new roman'][size=16px]Root Mean Squares Error of Cross-validation[/size][/font][font='times new roman'][size=16px],[/size][/font][font='times new roman'][size=16px] [/size][/font][font='times new roman'][size=16px]RMSECV[/size][/font][font='times new roman'][size=16px])[/size][/font][font='times new roman'][size=16px] [/size][/font][font='times new roman'][size=16px]对校正集模型进行评价。[/size][/font][font='times new roman'][size=16px]此外,外部独立验证集光谱在中试流化床上进行采集,对独立测试集光谱进行诊断分析,来验证模型的稳健性以及在小试实验型流化床上采集校正集光谱的适宜性,以便随后应用于生产型流化床混合过程中。进一步对近红外预测数据和参考值进行方法学考察,探究方法[/size][/font][font='times new roman'][size=16px]学结果[/size][/font][font='times new roman'][size=16px]的准确性、精密度等用于检测流化床混合过程中潜在的[/size][/font][font='times new roman'][size=16px]API[/size][/font][font='times new roman'][size=16px]含量[/size][/font][font='times new roman'][size=16px]瞬态干扰。[/size][/font][font='times new roman'][size=16px][b]模型评价与验证[/b][/size][/font][font='times new roman'][size=16px]图为优化后的[/size][/font][font='times new roman'][size=16px]PLS[/size][/font][font='times new roman'][size=16px]模型前三个潜在变量([/size][/font][font='times new roman'][size=16px]LV[/size][/font][font='times new roman'][size=16px])的二维得分图。如图所示,第一个[/size][/font][font='times new roman'][size=16px]LV[/size][/font][font='times new roman'][size=16px]解释了大部分的浓度变异性,第二个[/size][/font][font='times new roman'][size=16px]LV[/size][/font][font='times new roman'][size=16px]解释了大部分湿度的变化,第三个[/size][/font][font='times new roman'][size=16px]LV[/size][/font][font='times new roman'][size=16px]解释了大部分由进风温度引起的变化。同时,得分图中同一工艺和环境条件下,[/size][/font][font='times new roman'][size=16px]单簇样品[/size][/font][font='times new roman'][size=16px]点出现的变异代表了[/size][/font][font='times new roman'][size=16px]DOE[/size][/font][font='times new roman'][size=16px]中配方的变化,这些变化来源于不同的原料药批次、辅料[/size][/font][font='times new roman'][size=16px]1[/size][/font][font='times new roman'][size=16px]和辅料[/size][/font][font='times new roman'][size=16px]2[/size][/font][font='times new roman'][size=16px]的不同比例以及流化床腔室中物料粒径的不同。[/size][/font][table][tr][td][align=center][img]https://ng1.17img.cn/bbsfiles/images/2020/09/202009170817240488_6697_3890113_3.png[/img][/align][/td][td][align=center][img]https://ng1.17img.cn/bbsfiles/images/2020/09/202009170817241999_544_3890113_3.png[/img][/align][/td][/tr][tr][td][align=center][font='times new roman'][b]([/b][/font][font='times new roman'][b]a)[/b][/font][/align][/td][td][align=center][font='times new roman'][b]([/b][/font][font='times new roman'][b]b)[/b][/font][/align][/td][/tr][tr][td][align=center][img]https://ng1.17img.cn/bbsfiles/images/2020/09/202009170817242568_3144_3890113_3.png[/img][/align][/td][td][align=center][img]https://ng1.17img.cn/bbsfiles/images/2020/09/202009170817243942_1268_3890113_3.png[/img][/align][/td][/tr][tr][td][align=center][font='times new roman'][b]([/b][/font][font='times new roman'][b]c)[/b][/font][/align][/td][td][align=center][font='times new roman'][b]([/b][/font][font='times new roman'][b]d)[/b][/font][/align][/td][/tr][tr][td=2,1][align=center][font='times new roman']图[/font][font='times new roman'] [/font][font='times new roman']优化后的[/font][font='times new roman']PLS[/font][font='times new roman']模型在前三个潜在变量[/font][font='times new roman'](LV)[/font][font='times new roman']的得分图。图[/font][font='times new roman']([/font][font='times new roman']a)[/font][font='times new roman'] (LV1 [/font][font='times new roman'][i]vs[/i][/font][font='times new roman'] LV2)[/font][font='times new roman']中的多种颜色代表了[/font][font='times new roman']API[/font][font='times new roman']含量的分类;[/font][font='times new roman']([/font][font='times new roman']b)[/font][font='times new roman'] (LV1 [/font][font='times new roman'][i]vs[/i][/font][font='times new roman'] LV2)[/font][font='times new roman']中多种颜色代表了环境湿度的分类;[/font][font='times new roman']([/font][font='times new roman']c) [/font][font='times new roman'](LV1 [/font][font='times new roman'][i]vs[/i][/font][font='times new roman'] LV3)[/font][font='times new roman']中多种颜色代表了[/font][font='times new roman']API[/font][font='times new roman']含量的分类;[/font][font='times new roman']([/font][font='times new roman']d)[/font][font='times new roman'] (LV1 [/font][font='times new roman'][i]vs[/i][/font][font='times new roman'] LV3) [/font][font='times new roman']多种颜色代表进风温度的分类[/font][/align][/td][/tr][/table][font='times new roman'][size=16px]校正集中包涵了多种变量因素条件下采集的光谱,(包括工艺因素、环境因素和配方因素)提高了模型对后续实际应用中原辅料、过程和环境变化的稳定性。最后,对模型进行诊断和验证,验证集四批实验[/size][/font][font='times new roman'][size=16px]([/size][/font][font='times new roman'][size=16px]每个[/size][/font][font='times new roman'][size=16px]API[/size][/font][font='times new roman'][size=16px]理论含量配方进行一批实验[/size][/font][font='times new roman'][size=16px])[/size][/font][font='times new roman'][size=16px]在低的环境湿度和[/size][/font][font='times new roman'][size=16px]50℃[/size][/font][font='times new roman'][size=16px]进风温度条件下完成。图为校正集光谱诊断[/size][/font][font='times new roman'][size=16px]断[/size][/font][font='times new roman'][size=16px]图[/size][/font][font='times new roman'][size=16px]([/size][/font][font='times new roman'][size=16px]即[/size][/font][font='times new roman'][size=16px][i]F[/i][/size][/font][font='times new roman'][size=16px] [/size][/font][font='times new roman'][size=16px][i]vs[/i][/size][/font][font='times new roman'][size=16px] [/size][/font][font='times new roman'][size=16px]Hotelling[/size][/font][font='times new roman'][size=16px] [/size][/font][font='times new roman'][size=16px][i]T[/i][/size][/font][font='times new roman'][size=16px]2[/size][/font][font='times new roman'][size=16px])[/size][/font][font='times new roman'][size=16px]和得分图(包含校正集和验证集)表明,校正集和独立外部预测集光谱都在[/size][/font][font='times new roman'][size=16px]95%[/size][/font][font='times new roman'][size=16px]置信范围内,再次证明了模型的稳定性和可靠性,证明了近红外技术可用于流化床混合过程[/size][/font][font='times new roman'][size=16px]API[/size][/font][font='times new roman'][size=16px]含量监测的稳定性。进一步对近红外预测数据和参考值进行方法学考察,近红外测量具有良好的准确度[/size][/font][font='times new roman'][size=16px](RMSEP=2.3629%)[/size][/font][font='times new roman'][size=16px]、精密度[/size][/font][font='times new roman'][size=16px](100%[/size][/font][font='times new roman'][size=16px]含量下的[/size][/font][font='times new roman'][size=16px]SD=4.8%)[/size][/font][font='times new roman'][size=16px]和线性度[/size][/font][font='times new roman'][size=16px](R=0.903)[/size][/font][font='times new roman'][size=16px],说明了[url=https://insevent.instrument.com.cn/t/1p][color=#3333ff]近红外光谱[/color][/url]法在线监测[/size][/font][font='times new roman'][size=16px]API[/size][/font][font='times new roman'][size=16px]含量的可行性。[/size][/font][table][tr][td][align=center][img]https://ng1.17img.cn/bbsfiles/images/2020/09/202009170817244561_5080_3890113_3.png[/img][/align][/td][/tr][tr][td][align=center][font='times new roman'][b]([/b][/font][font='times new roman'][b]a)[/b][/font][/align][/td][/tr][tr][td][align=center][img]https://ng1.17img.cn/bbsfiles/images/2020/09/202009170817245752_7165_3890113_3.png[/img][/align][/td][/tr][tr][td][align=center][font='times new roman'][b]([/b][/font][font='times new roman'][b]b)[/b][/font][/align][/td][/tr][/table][font='times new roman']图[/font][font='times new roman'] [/font][font='times new roman'] [/font][font='times new roman'](a) [/font][font='times new roman']校正集光谱诊断图[/font][font='times new roman']([/font][font='times new roman']即[/font][font='times new roman'][i]F[/i][/font][font='times new roman'] [/font][font='times new roman'][i]vs[/i][/font][font='times new roman'] [/font][font='times new roman']Hotelling[/font][font='times new roman'] [/font][font='times new roman'][i]T[/i][/font][font='times new roman'][size=13px]2[/size][/font][font='times new roman'])[/font][font='times new roman']和[/font][font='times new roman'] ([/font][font='times new roman']b) [/font][font='times new roman']得分图(包含校正集和[/font][font='times new roman']验证集)[/font][font='times new roman'][size=18px][b]小结[/b][/size][/font][font='times new roman'][size=16px]本章节对小试流化床进行设备改造,将微型[url=https://insevent.instrument.com.cn/t/1p][color=#3333ff]近红外光谱仪[/color][/url]内嵌到流化床腔室中,通过实验设计,考察了流化床混合过程中影响原料药([/size][/font][font='times new roman'][size=16px]API[/size][/font][font='times new roman'][size=16px])含量的变异性来源,包括原辅料、工艺过程、环境等因素。在有限的[/size][/font][font='times new roman'][size=16px]API[/size][/font][font='times new roman'][size=16px]消耗情况下建立定量[/size][/font][font='times new roman'][size=16px]PLS[/size][/font][font='times new roman'][size=16px]模,验证了流化床混合过程[/size][/font][font='times new roman'][size=16px]API[/size][/font][font='times new roman'][size=16px]含量在线监测的可行性。采用接触式采集模式进行在线校正集光谱采集,保证了光谱的质量。另外,[/size][/font][font='times new roman'][size=16px]提出并研究了不同的光谱选择方法以提高模型的预测能力,其中余弦距离法效果最好。余弦距离法是一种非常普遍的光谱选择方法,可作为一种优化方法对其他动态过程的光谱进行选择。此外,光谱预处理和变量选择方法对模型预测能力的提高也很重要。[/size][/font][font='times new roman'][size=16px]通[/size][/font][font='times new roman'][size=16px]过研究不同的预处理和波段选择方法提高了模型的预测能力,[/size][/font][font='times new roman'][size=16px][i]R[/i][/size][/font][font='times new roman'][size=16px]2[/size][/font][font='times new roman'][size=16px][i]c[/i][/size][/font][font='times new roman'][size=16px],[/size][/font][font='times new roman'][size=16px][i]R[/i][/size][/font][font='times new roman'][size=16px]2[/size][/font][font='times new roman'][size=16px][i]cv[/i][/size][/font][font='times new roman'][size=16px],[/size][/font][font='times new roman'][size=16px]RMSEC[/size][/font][font='times new roman'][size=16px]和[/size][/font][font='times new roman'][size=16px]RMSECV[/size][/font][font='times new roman'][size=16px]分别为[/size][/font][font='times new roman'][size=16px]0.957[/size][/font][font='times new roman'][size=16px],[/size][/font][font='times new roman'][size=16px]0.954[/size][/font][font='times new roman'][size=16px],[/size][/font][font='times new roman'][size=16px]2.3103[/size][/font][font='times new roman'][size=16px]和[/size][/font][font='times new roman'][size=16px]2.3143[/size][/font][font='times new roman'][size=16px]。[/size][/font][font='times new roman'][size=16px]对[/size][/font][font='times new roman'][size=16px][url=https://insevent.instrument.com.cn/t/1p][color=#3333ff]NIR[/color][/url]S[/size][/font][font='times new roman'][size=16px]方法进行方法学考察,结果表明近红外测量具有良好的[/size][/font][font='times new roman'][size=16px]准确度[/size][/font][font='times new roman'][size=16px](RMSEP=2.3629%)[/size][/font][font='times new roman'][size=16px]、精密度[/size][/font][font='times new roman'][size=16px](100%[/size][/font][font='times new roman'][size=16px]含量下的[/size][/font][font='times new roman'][size=16px]SD=4.8%)[/size][/font][font='times new roman'][size=16px]和线性度[/size][/font][font='times new roman'][size=16px](R=0.903)[/size][/font][font='times new roman'][size=16px],[/size][/font][font='times new roman'][size=16px]说明了[url=https://insevent.instrument.com.cn/t/1p][color=#3333ff]近红外光谱[/color][/url]法在线监测[/size][/font][font='times new roman'][size=16px]API[/size][/font][font='times new roman'][size=16px]含量的可行性。[/size][/font][font='times new roman'][size=16px]本研究可作为中试和工业流化床混合过程中微型近红外传感器在线监测的参考,本研究表明[url=https://insevent.instrument.com.cn/t/1p][color=#3333ff]近红外光谱[/color][/url]法有可能取代传统的测量方法,实现流化床混合过程在线监测,并可将[/size][/font][font='times new roman'][size=16px]CQA[/size][/font][font='times new roman'][size=16px]与关键工艺参数相连接,实现固体制剂的智能化生产。[/size][/font][font='times new roman'][size=16px]下一步研究中,将对离线光谱进行模型转移研究,进一步提高模型的精度、预测能力和稳定性,并将离线模型、在线模型、模型转移后得到的模型用于中试生产中[/size][/font][font='times new roman'][size=16px]API[/size][/font][font='times new roman'][size=16px]含量的监测。[/size][/font]
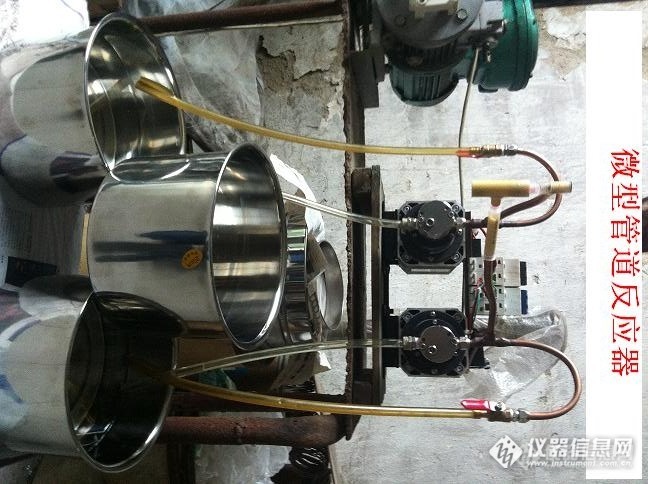
炎热的秋过去了,终于可以静下心来写些东西了,细细想来也许标题应该用:“我的DIY之路”或者是:“乐趣中的财富”,总之就是一点心得,虽然已经过了轻狂的年纪,依旧少许些不那么淡定(哈。。。见谅了)在这个论坛我发表的第一个贴子已经是很多年前的事了,也是第一个动手用家用微波炉制作的“微波反应器”,虽然技术含量不是很高,获得了很多回帖与支持,使我倍感欣慰,后来陆续制作了“旋风分离器”,“半导体制冷反应器”以及没有在论坛上发出的一些制作,多年的实验室DIY知识积累为我打下了扎实的动手能力基础,在加工配件的同时跟着老师傅学会了电焊板金等技能,在此对这些工作在一线的老师傅表示深深的敬意。他们传授的经验是我们无法从书本上获知的。http://ng1.17img.cn/bbsfiles/images/2017/01/201701191656_647634_1866229_3.jpg这是年前做的一个实验室用的微型反应器,虽然有些简陋,但效果非同一般,规模化的设备已经投入了生产,这台也就结束了它的使命被放弃到了仓库里。还是回归正题吧,年前和朋友品茶聊天工程中,说起他们厂的酯化反应收率问题,这个是在15度,滴加放热反应,收率一直在60-70之间徘徊,就开玩笑的说,你这么喜欢折腾和不考虑改善这个工艺提高收率,也许能挣大钱,在钱的诱惑下(哈。。。。),我决定试试。尝试了各种方法,最后发现问题,就是要解决温度梯度和浓度梯度问题。发现问题就能找到解决问题的办法,发现微型管道反应器是最好的,他的主要功能就是解决:温度梯度,浓度梯度,压力梯度,密度梯度问题明天继续写。。。。。

[align=center][font='times new roman'][size=20px][b]流化床混合过程[/b][/size][/font][font='times new roman'][size=20px][b][url=https://insevent.instrument.com.cn/t/1p][color=#3333ff]NIR[/color][/url]S[/b][/size][/font][font='times new roman'][size=20px][b]模型转移及中试应用研究[/b][/size][/font][/align][font='times new roman'][size=16px]离线模型的建立验证了便携式[url=https://insevent.instrument.com.cn/t/1p][color=#3333ff]近红外光谱仪[/color][/url]用于流化床混合过程[/size][/font][font='times new roman'][size=16px]API[/size][/font][font='times new roman'][size=16px]含量监测的可行性。[/size][/font][font='times new roman'][size=16px]对小试流化床进行设备改造,将微型[url=https://insevent.instrument.com.cn/t/1p][color=#3333ff]近红外光谱仪[/color][/url]内嵌到流化床腔室中,在有限的[/size][/font][font='times new roman'][size=16px]API[/size][/font][font='times new roman'][size=16px]消耗情况下建立定量[/size][/font][font='times new roman'][size=16px]PLS[/size][/font][font='times new roman'][size=16px]模型,最后用外部验证集验证了模型的稳定性和预测能力。对比离线模型和在线模型,根据模型参数及验证[/size][/font][font='times new roman'][size=16px]集预测[/size][/font][font='times new roman'][size=16px]结果,离线模型的预测能力及稳健性更高。由于物料的动态特性及其他影响因素的干扰,在线模型精度较低。此外,随着光谱采集时间、环境等的推移,即使同一样品的光谱也会出现漂移、线性或非线性改变等变化,[/size][/font][font='times new roman'][size=16px]故建立[/size][/font][font='times new roman'][size=16px]的校正集模型需要定期进行维护。如果这些变化不通过定期采集新的校正集光谱进行维护,建立的模型会出现不可估量的误差,给生产和检验带来不可估量的损失,且在线模型较离线模型的收集需要消耗更多的物料,模型的定期维护需要更多的经济投入。为了提高在线模型的精[/size][/font][font='times new roman'][size=16px]度,节省成本,减少校正集光谱收集及模型维护带来的经济成本,[/size][/font][font='times new roman'][size=16px]针对流化床混合过程中建立的[/size][/font][font='times new roman'][size=16px]API[/size][/font][font='times new roman'][size=16px]含量[/size][/font][font='times new roman'][size=16px]定量分析模型,采用化学计量学方法对离线光谱与在线光谱间模型传递进行研究,提高了模型的精度和稳定性,[/size][/font][font='times new roman'][size=16px] [/size][/font][font='times new roman'][size=16px][b]仪器和软件[/b][/size][/font][font='times new roman'][size=16px]LGL 002[/size][/font][font='times new roman'][size=16px]实验型流化床([/size][/font][font='times new roman'][size=16px]山东新马制药装备有限公司);[/size][/font][font='times new roman'][size=16px]Micro [url=https://insevent.instrument.com.cn/t/1p][color=#3333ff]NIR[/color][/url] PAT-U [/size][/font][font='times new roman'][size=16px]微型[url=https://insevent.instrument.com.cn/t/1p][color=#3333ff]近红外光谱仪[/color][/url](美国[/size][/font][font='times new roman'][size=16px]Viavi[/size][/font][font='times new roman'][size=16px] Solutions[/size][/font][font='times new roman'][size=16px]公司)[/size][/font][font='times new roman'][size=16px];[/size][/font][font='times new roman'][size=16px]耐高温外接金属探头;[/size][/font][font='times new roman'][size=16px]紫外分光光度计;烘箱;干燥器[/size][/font][font='times new roman'][size=16px];[/size][/font][font='times new roman'][size=16px]Matlab[/size][/font][font='times new roman'][size=16px] 2016b[/size][/font][font='times new roman'][size=16px](美国[/size][/font][font='times new roman'][size=16px]Mathworks[/size][/font][font='times new roman'][size=16px]公司);[/size][/font][font='times new roman'][size=16px]Unscrambler[/size][/font][font='times new roman'][size=16px] X 10.4 ([/size][/font][font='times new roman'][size=16px]挪威[/size][/font][font='times new roman'][size=16px] CAMO [/size][/font][font='times new roman'][size=16px]公司[/size][/font][font='times new roman'][size=16px])[/size][/font][font='times new roman'][size=16px];[/size][/font][font='times new roman'][size=16px]orign85[/size][/font][font='times new roman'][size=16px](美国[/size][/font][font='times new roman'][size=16px]OriginLab[/size][/font][font='times new roman'][size=16px]公司)。[/size][/font][font='times new roman'][size=18px][b]方法[/b][/size][/font][font='times new roman'][size=16px][b]实验设计[/b][/size][/font][font='times new roman'][size=16px]每个批次流化床混合过程中,在线采集的光谱与离线取样采集的光谱并非一一对应,故提出两种不同的模型转移方案[/size][/font][font='times new roman'][size=16px]:[/size][/font][font='times new roman'][size=16px]1[/size][/font][font='times new roman'][size=16px])[/size][/font][font='times new roman'][size=16px]将每个批次在线监测过程采集到的多条在线光谱进行平均,同时将每个批次采集的离线光谱进行平均,将平均后[/size][/font][font='times new roman'][size=16px]的离线光谱与在线光谱一一对应,然后进行模型转移研究[/size][/font][font='times new roman'][size=16px];[/size][/font][font='times new roman'][size=16px]2[/size][/font][font='times new roman'][size=16px])[/size][/font][font='times new roman'][size=16px]将每个批次采集到的离线光谱进行平均后复制,得到与相应的在线光谱相同数目的光谱,然后进行模型转移研究。[/size][/font][font='times new roman'][size=16px][b]光谱采集[/b][/size][/font][font='times new roman'][size=16px]在线原始光谱及离线原始光谱都由[/size][/font][font='times new roman'][size=16px]Micro [url=https://insevent.instrument.com.cn/t/1p][color=#3333ff]NIR[/color][/url] PAT-U [/size][/font][font='times new roman'][size=16px]微型[url=https://insevent.instrument.com.cn/t/1p][color=#3333ff]近红外光谱仪[/color][/url](美国[/size][/font][font='times new roman'][size=16px]Viavi[/size][/font][font='times new roman'][size=16px] Solutions[/size][/font][font='times new roman'][size=16px]公司)漫反射模块采集,波长范围为[/size][/font][font='times new roman'][size=16px]908.1 nm-1676.0 nm[/size][/font][font='times new roman'][size=16px],每张光谱平均扫描[/size][/font][font='times new roman'][size=16px]100[/size][/font][font='times new roman'][size=16px]次。在线[url=https://insevent.instrument.com.cn/t/1p][color=#3333ff]近红外光谱[/color][/url]每[/size][/font][font='times new roman'][size=16px]3[/size][/font][font='times new roman'][size=16px] [/size][/font][font='times new roman'][size=16px]s[/size][/font][font='times new roman'][size=16px]自动采集一次,积分时间为[/size][/font][font='times new roman'][size=16px]8.8[/size][/font][font='times new roman'][size=16px] [/size][/font][font='times new roman'][size=16px]ms[/size][/font][font='times new roman'][size=16px],[/size][/font][font='times new roman'][size=16px]每个批次约采集[/size][/font][font='times new roman'][size=16px]40[/size][/font][font='times new roman'][size=16px]张光谱。离线[url=https://insevent.instrument.com.cn/t/1p][color=#3333ff]近红外光谱[/color][/url]手动采集,积分时间为[/size][/font][font='times new roman'][size=16px]8.2[/size][/font][font='times new roman'][size=16px] [/size][/font][font='times new roman'][size=16px]ms[/size][/font][font='times new roman'][size=16px].[/size][/font][font='times new roman'][size=16px] [/size][/font][font='times new roman'][size=16px]每个样品采集五张光谱。[/size][/font][font='times new roman'][size=16px][b]一级数据的测定[/b][/size][/font][font='times new roman'][size=16px]水分含量的测定采用药典规定的干燥失重法([/size][/font][font='times new roman'][size=16px]LOD[/size][/font][font='times new roman'][size=16px]),在烘箱中完成。[/size][/font][font='times new roman'][size=16px]API[/size][/font][font='times new roman'][size=16px]含量的测定[/size][/font][font='times new roman'][size=16px]用[/size][/font][font='times new roman'][size=16px]UV[/size][/font][font='times new roman'][size=16px]法[/size][/font][font='times new roman'][size=16px]。[/size][/font][font='times new roman'][size=16px]采用化学计量学方法对离线光谱和在线光谱间模型传递进行研究,提高了模型精度,节省了校正集收集及模型维护成本,实现了由实验室到工厂实际应用的理论和实践研究,研究内容主要包括:[/size][/font][font='宋体'][size=16px]①[/size][/font][font='times new roman'][size=16px]流化床混合过程中,标准离线光谱[/size][/font][font='times new roman'][size=16px]([/size][/font][font='times new roman'][size=16px]Xstatic[/size][/font][font='times new roman'][size=16px])[/size][/font][font='times new roman'][size=16px]的收集和标准在线光谱[/size][/font][font='times new roman'][size=16px]([/size][/font][font='times new roman'][size=16px]Xdynamic[/size][/font][font='times new roman'][size=16px])[/size][/font][font='times new roman'][size=16px]的收集。[/size][/font][font='宋体'][size=16px]②[/size][/font][font='times new roman'][size=16px]通过标准离线光谱[/size][/font][font='times new roman'][size=16px]([/size][/font][font='times new roman'][size=16px]Xstatic[/size][/font][font='times new roman'][size=16px])[/size][/font][font='times new roman'][size=16px]和标准在线光谱[/size][/font][font='times new roman'][size=16px]([/size][/font][font='times new roman'][size=16px]Xdynamic[/size][/font][font='times new roman'][size=16px])[/size][/font][font='times new roman'][size=16px]建立转换矩阵[/size][/font][font='times new roman'][size=16px][b]F[/b][/size][/font][font='times new roman'][size=16px]。[/size][/font][font='宋体'][size=16px]③[/size][/font][font='times new roman'][size=16px]将采集到的校正集样品离线光谱[/size][/font][font='times new roman'][size=16px]X[/size][/font][font='times new roman'][size=16px]static[/size][/font][font='times new roman'][size=16px]([/size][/font][font='times new roman'][size=16px]cal[/size][/font][font='times new roman'][size=16px])[/size][/font][font='times new roman'][size=16px]通过转换矩阵得到新的校正集建模光谱[/size][/font][font='times new roman'][size=16px]X[/size][/font][font='times new roman'][size=16px]static[/size][/font][font='times new roman'][size=16px](fit)=[/size][/font][font='times new roman'][size=16px]Xstatic[/size][/font][font='times new roman'][size=16px]([/size][/font][font='times new roman'][size=16px]cal[/size][/font][font='times new roman'][size=16px]) [/size][/font][font='times new roman'][size=16px][b]F[/b][/size][/font][font='times new roman'][size=16px].[/size][/font][font='宋体'][size=16px]④[/size][/font][font='times new roman'][size=16px]将得到的校正集光谱矩阵[/size][/font][font='times new roman'][size=16px]X[/size][/font][font='times new roman'][size=16px]static[/size][/font][font='times new roman'][size=16px](fit)[/size][/font][font='times new roman'][size=16px]用于建立校正集模型,用于未知样品的预测。[/size][/font][font='宋体'][size=16px]⑤[/size][/font][font='times new roman'][size=16px]模型传递后与原在线模型及离线模型的比较。[/size][/font][font='宋体'][size=16px]⑥[/size][/font][font='times new roman'][size=16px]将模型转移后的模型用于中试流化床混合过程在线监测并对测量结果进行评价。[/size][/font][font='times new roman'][size=16px][b]模型的建立[/b][/size][/font][font='times new roman'][size=16px]首先将静态标准光谱与动态标准光谱[/size][/font][font='times new roman'][size=16px]用提出[/size][/font][font='times new roman'][size=16px]的两种方案进行模型转移研究,[/size][/font][font='times new roman'][size=16px]接着将校正集光谱结合模型转移算出的转置矩阵[/size][/font][font='times new roman'][size=16px][b]F[/b][/size][/font][font='times new roman'][size=16px]得出新的校正集光谱矩阵,将模型转移后得到的新光谱矩阵用于建立[/size][/font][font='times new roman'][size=16px]PLS[/size][/font][font='times new roman'][size=16px]定量分析模型。为了进一步提高模型的预测能力,对[/size][/font][font='times new roman'][size=16px]新的[/size][/font][font='times new roman'][size=16px]校正集光谱进行预处理和波段选择,最后,[/size][/font][font='times new roman'][size=16px]对校正集模型进行评价。[/size][/font][font='times new roman'][size=16px]此外,将优化后的模型用于中试生产在线混合过程监测,来验证模型的稳健性以及在小试实验型流化床上离线采集校正集光谱的适宜性和模型转移后建立的新模型的稳健性,以便随后应用于生产型流化床混合过程中。[/size][/font][font='times new roman'][size=18px][b]实验结果[/b][/size][/font][font='times new roman'][size=16px]表为经不同波段选择方法优化后得到的离线模型、在线模型及模型转移后的模型结果,图为相应的模型图。结合表和图得,经[/size][/font][font='times new roman'][size=16px]UVE[/size][/font][font='times new roman'][size=16px]波段选择方法优化后的离线模型结果最好,经[/size][/font][font='times new roman'][size=16px]RATC[/size][/font][font='times new roman'][size=16px]波段选择方法优化后的在线模型结果最好。模型转移后的模型经[/size][/font][font='times new roman'][size=16px]RATC[/size][/font][font='times new roman'][size=16px]优化后的结果较在线模型预测能力有所提高,[/size][/font][font='times new roman'][size=16px][i]R[/i][/size][/font][font='times new roman'][size=16px][i]2[/i][/size][/font][font='times new roman'][size=16px][i]c[/i][/size][/font][font='times new roman'][size=16px],[/size][/font][font='times new roman'][size=16px] [/size][/font][font='times new roman'][size=16px][i]R[/i][/size][/font][font='times new roman'][size=16px][i]2[/i][/size][/font][font='times new roman'][size=16px][i]cv[/i][/size][/font][font='times new roman'][size=16px], RMSEC[/size][/font][font='times new roman'][size=16px],[/size][/font][font='times new roman'][size=16px] RMSECV[/size][/font][font='times new roman'][size=16px]分别为[/size][/font][font='times new roman'][size=16px]0.970[/size][/font][font='times new roman'][size=16px],[/size][/font][font='times new roman'][size=16px]0.960[/size][/font][font='times new roman'][size=16px],[/size][/font][font='times new roman'][size=16px]1.9053[/size][/font][font='times new roman'][size=16px],[/size][/font][font='times new roman'][size=16px]2.1918[/size][/font][font='times new roman'][size=16px],[/size][/font][font='times new roman'][size=16px]达到了实验预期的目的。这可能是由于模型转移后消除或者减轻了基线漂移、随机噪声等对光谱的干扰从而提高了光谱的质量。[/size][/font][align=center][font='times new roman']表[/font][font='times new roman'] [/font][font='times new roman']离线模型、在线模型及模型转移后的模型结果比较[/font][/align][table][tr][td=2,2][align=center][font='times new roman']模型参数[/font][/align][/td][td=5,1][align=center][font='times new roman'][color=#000000]波段选择方法[/color][/font][/align][/td][/tr][tr][td][align=center][font='times new roman'][color=#000000]raw[/color][/font][/align][/td][td][align=center][font='times new roman'][color=#000000]CC[/color][/font][/align][/td][td][align=center][font='times new roman'][color=#000000]VIP[/color][/font][/align][/td][td][align=center][font='times new roman'][color=#000000]RATC[/color][/font][/align][/td][td][align=center][font='times new roman'][color=#000000]UVE[/color][/font][/align][/td][/tr][tr][td=1,4][align=center][font='times new roman']离线模型[/font][/align][/td][td][align=center][font='times new roman'][color=#000000]R[/color][/font][font='times new roman'][size=13px][color=#000000]2[/color][/size][/font][font='times new roman'][size=13px][color=#000000][i]c[/i][/color][/size][/font][/align][/td][td][align=center][font='times new roman'][color=#000000]0.971[/color][/font][/align][/td][td][align=center][font='times new roman'][color=#000000]0.98[/color][/font][/align][/td][td][align=center][font='times new roman'][color=#000000]0.969[/color][/font][/align][/td][td][align=center][font='times new roman'][color=#000000]0.967[/color][/font][/align][/td][td][align=center][font='times new roman'][color=#000000]0.977[/color][/font][/align][/td][/tr][tr][td][align=center][font='times new roman'][color=#000000]R[/color][/font][font='times new roman'][size=13px][color=#000000]2[/color][/size][/font][font='times new roman'][size=13px][color=#000000][i]cv[/i][/color][/size][/font][/align][/td][td][align=center][font='times new roman'][color=#000000]0.961[/color][/font][/align][/td][td][align=center][font='times new roman'][color=#000000]0.972[/color][/font][/align][/td][td][align=center][font='times new roman'][color=#000000]0.952[/color][/font][/align][/td][td][align=center][font='times new roman'][color=#000000]0.954[/color][/font][/align][/td][td][align=center][font='times new roman'][color=#000000]0.973[/color][/font][/align][/td][/tr][tr][td][align=center][font='times new roman'][color=#000000]RMSEC[/color][/font][/align][/td][td][align=center][font='times new roman'][color=#000000]1.8904[/color][/font][/align][/td][td][align=center][font='times new roman'][color=#000000]1.5631[/color][/font][/align][/td][td][align=center][font='times new roman'][color=#000000]2.0328[/color][/font][/align][/td][td][align=center][font='times new roman'][color=#000000]2.0398[/color][/font][/align][/td][td][align=center][font='times new roman'][color=#000000]1.6776[/color][/font][/align][/td][/tr][tr][td][align=center][font='times new roman'][color=#000000]RMSECV[/color][/font][/align][/td][td][align=center][font='times new roman'][color=#000000]2.2385[/color][/font][/align][/td][td][align=center][font='times new roman'][color=#000000]1.8712[/color][/font][/align][/td][td][align=center][font='times new roman'][color=#000000]2.1722[/color][/font][/align][/td][td][align=center][font='times new roman'][color=#000000]2.1996[/color][/font][/align][/td][td][align=center][font='times new roman'][color=#000000]1.8588[/color][/font][/align][/td][/tr][tr][td=1,4][align=center][font='times new roman']在线模型[/font][/align][/td][td][align=center][font='times new roman'][color=#000000]R[/color][/font][font='times new roman'][size=13px][color=#000000]2[/color][/size][/font][font='times new roman'][size=13px][color=#000000][i]c[/i][/color][/size][/font][/align][/td][td][align=center][font='times new roman'][color=#000000]0.962[/color][/font][/align][/td][td][align=center][font='times new roman'][color=#000000]0.956[/color][/font][/align][/td][td][align=center][font='times new roman'][color=#000000]0.94[/color][/font][/align][/td][td][align=center][font='times new roman'][color=#000000]0.957[/color][/font][/align][/td][td][align=center][font='times new roman'][color=#000000]0.963[/color][/font][/align][/td][/tr][tr][td][align=center][font='times new roman'][color=#000000]R[/color][/font][font='times new roman'][size=13px][color=#000000]2[/color][/size][/font][font='times new roman'][size=13px][color=#000000][i]cv[/i][/color][/size][/font][/align][/td][td][align=center][font='times new roman'][color=#000000]0.961[/color][/font][/align][/td][td][align=center][font='times new roman'][color=#000000]0.954[/color][/font][/align][/td][td][align=center][font='times new roman'][color=#000000]0.939[/color][/font][/align][/td][td][align=center][font='times new roman'][color=#000000]0.954[/color][/font][/align][/td][td][align=center][font='times new roman'][color=#000000]0.961[/color][/font][/align][/td][/tr][tr][td][align=center][font='times new roman'][color=#000000]RMSEC[/color][/font][/align][/td][td][align=center][font='times new roman'][color=#000000]2.5356[/color][/font][/align][/td][td][align=center][font='times new roman'][color=#000000]2.3997[/color][/font][/align][/td][td][align=center][font='times new roman'][color=#000000]2.7244[/color][/font][/align][/td][td][align=center][font='times new roman'][color=#000000]2.3103[/color][/font][/align][/td][td][align=center][font='times new roman'][color=#000000]2.4073[/color][/font][/align][/td][/tr][tr][td][align=center][font='times new roman'][color=#000000]RMSECV[/color][/font][/align][/td][td][align=center][font='times new roman'][color=#000000]2.5412[/color][/font][/align][/td][td][align=center][font='times new roman'][color=#000000]2.4103[/color][/font][/align][/td][td][align=center][font='times new roman'][color=#000000]2.7286[/color][/font][/align][/td][td][align=center][font='times new roman'][color=#000000]2.3143[/color][/font][/align][/td][td][align=center][font='times new roman'][color=#000000]2.4189[/color][/font][/align][/td][/tr][tr][td=1,4][align=center][font='times new roman']模型转移[/font][/align][/td][td][align=center][font='times new roman'][color=#000000]R[/color][/font][font='times new roman'][size=13px][color=#000000]2[/color][/size][/font][font='times new roman'][size=13px][color=#000000][i]c[/i][/color][/size][/font][/align][/td][td][align=center][font='times new roman'][color=#000000]0.96[/color][/font][/align][/td][td][align=center][font='times new roman'][color=#000000]0.965[/color][/font][/align][/td][td][align=center][font='times new roman'][color=#000000]0.96[/color][/font][/align][/td][td][align=center][font='times new roman'][color=#000000]0.[/color][/font][font='times new roman'][color=#000000]970[/color][/font][/align][/td][td][align=center][font='times new roman'][color=#000000]0.96[/color][/font][/align][/td][/tr][tr][td][align=center][font='times new roman'][color=#000000]R[/color][/font][font='times new roman'][size=13px][color=#000000]2[/color][/size][/font][font='times new roman'][size=13px][color=#000000][i]cv[/i][/color][/size][/font][/align][/td][td][align=center][font='times new roman'][color=#000000]0.95[/color][/font][/align][/td][td][align=center][font='times new roman'][color=#000000]0.959[/color][/font][/align][/td][td][align=center][font='times new roman'][color=#000000]0.952[/color][/font][/align][/td][td][align=center][font='times new roman'][color=#000000]0.[/color][/font][font='times new roman'][color=#000000]960[/color][/font][/align][/td][td][align=center][font='times new roman'][color=#000000]0.954[/color][/font][/align][/td][/tr][tr][td][align=center][font='times new roman'][color=#000000]RMSEC[/color][/font][/align][/td][td][align=center][font='times new roman'][color=#000000]2.2368[/color][/font][/align][/td][td][align=center][font='times new roman'][color=#000000]2.0946[/color][/font][/align][/td][td][align=center][font='times new roman'][color=#000000]2.246[/color][/font][/align][/td][td][align=center][font='times new roman'][color=#000000]1.9053[/color][/font][/align][/td][td][align=center][font='times new roman'][color=#000000]2.2329[/color][/font][/align][/td][/tr][tr][td][align=center][font='times new roman'][color=#000000]RMSECV[/color][/font][/align][/td][td][align=center][font='times new roman'][color=#000000]2.5009[/color][/font][/align][/td][td][align=center][font='times new roman'][color=#000000]2.3404[/color][/font][/align][/td][td][align=center][font='times new roman'][color=#000000]2.4808[/color][/font][/align][/td][td][align=center][font='times new roman'][color=#000000]2.[/color][/font][font='times new roman'][color=#000000]1918[/color][/font][/align][/td][td][align=center][font='times new roman'][color=#000000]2.4188[/color][/font][/align][/td][/tr][/table][img]https://ng1.17img.cn/bbsfiles/images/2020/09/202009170826073350_8509_3890113_3.png[/img][font='times new roman'][size=16px]本研究中对流化床混合过程离线光谱与在线光谱模型转移进行研究,经过模型转移后的结果对比,发现[/size][/font][font='times new roman'][size=16px]PRS[/size][/font][font='times new roman'][size=16px]模型转移后,模型准确性有所提高。为模型转移方法的应用体系和技术突破提供了参考价值,达到了预期的结果。对比预处理方法后,选择[/size][/font][font='times new roman'][size=16px]FD+SG3+SNV+meancenter[/size][/font][font='times new roman'][size=16px]为最优的预处理方法,模型的[/size][/font][font='times new roman'][size=16px][i]R[/i][/size][/font][font='times new roman'][size=16px]2[/size][/font][font='times new roman'][size=16px][i]c[/i][/size][/font][font='times new roman'][size=16px],[/size][/font][font='times new roman'][size=16px][i]R[/i][/size][/font][font='times new roman'][size=16px]2[/size][/font][font='times new roman'][size=16px][i]cv[/i][/size][/font][font='times new roman'][size=16px],[/size][/font][font='times new roman'][size=16px]RMSEC[/size][/font][font='times new roman'][size=16px]和[/size][/font][font='times new roman'][size=16px]RMSECV[/size][/font][font='times new roman'][size=16px]分别为[/size][/font][font='times new roman'][size=16px]0.960[/size][/font][font='times new roman'][size=16px],[/size][/font][font='times new roman'][size=16px]0.950[/size][/font][font='times new roman'][size=16px],[/size][/font][font='times new roman'][size=16px]2.2368[/size][/font][font='times new roman'][size=16px]和[/size][/font][font='times new roman'][size=16px]2.5009[/size][/font][font='times new roman'][size=16px]。[/size][/font][font='times new roman'][size=16px]将模型转移后建立的模型用于中试混合在线监测,[/size][/font][font='times new roman'][size=16px]API[/size][/font][font='times new roman'][size=16px]含量的近红外实时监测值和真实值整体拟合较好。[/size][/font]
[b][url=http://www.f-lab.cn/pcr/micropcr.html]微型PCR仪PCR-200[/url][/b]是专业为[b]聚合酶链式反应[/b]Ploymerase Chain Reaction, PCR而设计的[b]微量PCR仪[/b],非常适合作为微量热循环仪器使用。[b]微型PCR仪[/b]PCR-200用于分子学、医学、食品工业、司法科学、生物技术、环境科学、微生物学、临床诊断、流行病学、遗传学、基因芯片、基因检测、基因克隆、基因表达等领域以聚合酶链式反应(Ploymerase Chain Reaction, PCR)为特征的、以检测DNA/RNA为目的的各种病原体检测及基因分析。[b][b]微型PCR仪[/b]PCR-200特点[/b]结构紧凑,尺寸较小[img=微型PCR仪]http://www.f-lab.cn/Upload/PCR-200.jpg[/img]具有指导性的界面方便用户使用盖子是耐高温材料制造,适合各种类型的试管内存功能两种工作模式:PCR控制或计算机软件控制[b][b]微型PCR仪[/b]PCR-200参数[/b]容积:25x0.2mL(A), 9x0.5mL(B),16x0.2ml+9x0.5ml(C)温度范围:0-99℃最大加热速率:=2℃/s均匀性:=2℃/s热盖温度:105℃可存储命令数:3最大循环数:99显示:12864LCD尺寸:160x140x120mm重量:2.2kg更多PCR仪官网:[url]http://www.f-lab.cn/pcr.html[/url]
1 引言 微型光谱仪具体模块化和高速采集的特点,在系统集成和现场检测的场合得到了广泛的应用。结合光源、光纤、测量附件,可以搭配成各种光学测量系统。 光谱仪器是应用光学技术、电子技术及计算机技术对物质的成分及结构等进行分析和测量的基本设备,广泛应用于环境监测、工业控制、化学分析、食品品质检测、材料分析、临床检验、航空航天遥感及科学教育等领域。由于传统的光谱仪存在着结构复杂、使用环境受限、不便携带及价格昂贵等不足,不能满足现场检测和实时监控的需求。因此,微型光纤光谱仪成为光谱仪器发展的一个重要的研究方向。近年来,由于光纤技术、光栅技术及阵列式探测器技术的发展和成熟,使得光谱检测系统形成了光源、采样单元及摄谱单元相分离的结构形式,整个系统结构更具模块化,使用更加方便灵活,从而使微型光纤光谱仪成为现场检测和实时监控的首选仪器。 2 微型光谱仪结构 传统的光谱仪光学系统结构复杂,需通过旋转光栅对整个光谱进行扫描,测量速度慢,并且对某些样品还需经过特定的预处理,并要放在仪器的固定样品室内进行测量。与此相比,微型光纤光谱仪有很多优点,如:速度快、价格低、体积小、重量轻及全谱获取,而且通过光纤传导可以脱离样品室测量,适用于在线实时检测。 光谱仪微型化设计的实现得益于摄谱结构的优化。微型光纤光谱仪使用非对称交叉式Czerny-Turner分光结构,此光学结构的设计是在Czerny- Turner结构基础上进行光路的改进,使光谱仪内部构件布局更紧凑,可进一步小型化。摄谱结构光学平台的优化设计使微型光纤光谱仪内部无移动部件,光学元件都采用反射形式,可在一定程度上减少像差,并使工作光谱范围不受材料影响。微型光谱仪的固定化光学平台适合于震动及窄空间等复杂的工作环境。 3 微型光谱仪特点 光纤传导技术:光纤技术的发展,使待测物脱离了固定样品池的限制,采样方式变得更加灵活,适合于远距离样品品质监控。由于光纤对光信号的传输作用,使得光谱仪可以远离外界环境的干扰,保证光谱仪的长期可靠运行。 CCD阵列探测器技术:将经光栅分光后的作用光在探测器上同时瞬间采集,而不必移动光栅,因此样品光谱采集速度及快,并通过计算机实时输出。 光栅技术:全息光栅具有较小的杂散光,而机械刻划光栅具有更高的反射率和灵敏度。 计算机技术:电子计算技术的发展极大地提高了光谱仪的智能控制和处理能力。 4 微型光谱仪应用 随着微型光谱仪应用测量系统的不断拓展,其快速高效分析及便携式实时应用的优势逐渐显现出来,光谱分析技术正逐步从实验室分析走向现场实时检测。依据现阶段实际应用现状,微型光纤光谱仪在以下领域得到广泛的应用。 透射吸收测量:透射吸收测量用于测定液体或气体中介质对作用光的吸收,依据比耳定律,吸光度正比于摩尔吸收率、光程和样品介质浓度。 反射测量:反射测量方式分为镜面反射和漫反射测量,在实际测量中,可以采用不同的参考白板和测量角度来进行区分。反射测量用于测定样品的化学成分及表面颜色相关信息。 发光二极管(LED)测量:LED测量系统用于LED光源的绝对光谱强度及颜色指标测量。 激光测量:根据激光光谱的特征,检测系统配置高分辨率微型光纤光谱仪,同时可用积分球或余弦校正器来衰减入射光,以避免CCD探测器的饱和。 荧光测量:荧光测量因其光谱信号特别弱,因此需要一个高灵敏的探测器及一个高效率的滤光片,将样品激发出的微弱信号光和高强度的激发光区别开来。 氧含量测量:氧含量是通过光纤探头尖端荧光团的荧光强度的衰减来进行测量,应用荧光淬灭原理可以测量溶解氧或气态氧的分压,从而探测出环境的氧含量。 拉曼光谱测量:拉曼光谱与红外吸收光谱同为研究物质的分子振动能级从而分析物质的组成,但相对于红外吸收光谱,拉曼光谱的谱线较为简单且具有独特性,而且被测物不需进行前处理,因此在判断物质组成成分时有明显的优势。拉曼光谱测量系统特别适用于反应过程监控、产品识别、遥感及介质中高散射粒子的判定。 激光诱导击穿光谱(LIBS)测量:LIBS是一种用于固体、液体及气体中进行实时、定性及半定量的光谱元素分析技术,其工作原理是高强度的脉冲激光聚焦在样品表面,脉宽为10ns的激光脉冲蒸发样品产生等离子体,随着等离子体的冷却,处于激发态的原子发射出元素的特征光谱,这个光谱被光纤探头收集并传送到光谱仪,通过光谱分析软件中预存的样品特征光谱进行比对分析。 5 结论 微型光谱仪具有系统模块化和搭建灵活性的优势,因此在实际生产研究中,仅需配一套光谱仪,应用不同的测试附件就可以对各种不同的样品进行实时检测。同时,微型光纤光谱仪具有内部结构紧凑、无移动部件、波长范围宽、测量速度快、价格低的特点,在工业在线监控及便携式检测系统开发等领域提供了广阔的应用发展空间。(选自网络)
[font='times new roman'][size=16px][b]流化床工艺生产中[/b][/size][/font][font='times new roman'][size=16px][b]数据采集[/b][/size][/font][font='times new roman'][size=16px][b]实验方案设计[/b][/size][/font][size=14px]本实验所用的是山东新马制药装备有限公司生产的[/size][size=14px]LGL002[/size][size=14px]实验型流化床。物料的用量要根据底锅的大小和喷枪的位置决定。最少物料量要使得物料在底锅内填充的高度高于近红外探头孔的高度;最大物料量要保证物料在流化的过程中,大部分物料被进口空气吹起来的高度不得超过喷枪,否则会使得大部分物料喷不到粘合剂。经过设计,每批次制粒的总重量为[/size][size=14px]1500g[/size][size=14px]。其中,对乙酰氨基[/size][size=14px]酚[/size][size=14px]75g[/size][size=14px],乳糖[/size][size=14px]495g[/size][size=14px],淀粉[/size][size=14px]375g[/size][size=14px],微晶纤维素[/size][size=14px]555g[/size][size=14px],配制浓度为[/size][size=14px]3%[/size][size=14px]的羟丙基甲基纤维素作为制[/size][size=14px]粒过程[/size][size=14px]中的粘合剂。[/size][size=14px]为了找到制[/size][size=14px]粒过程[/size][size=14px]中流化床的工艺参数与颗粒水分含量的关联关系,首先需要通过实验的方法来确定制[/size][size=14px]粒过程[/size][size=14px]中工艺参数的可行区间。进风量的大小主要取决于物料的实际状态,进风的最小量要使得物料处于良好的流化状态,进风的最大量要根据吹起物料的高度,即还是要满足不得超过喷嘴高度的原则。最终获得风机开启比例为[/size][size=14px]20%~30%[/size][size=14px],风量的大小范围为[/size][size=14px]30m[/size][font='times new roman'][size=14px]3[/size][/font][size=14px]/h~60m[/size][font='times new roman'][size=14px]3[/size][/font][size=14px]/h[/size][size=14px]。雾化压力与蠕动泵流量大小会影响喷出的粘合剂,合适大小的雾化压力和蠕动泵蠕动泵流量可以保证喷嘴喷出的粘合剂呈雾状。物料温度主要与进风温度、蠕动泵流量有关,物料温度的大小可以从侧面反应物料中水分含量的多少,物料的温度越高,水分在温度作用下蒸发的就越快,使物料的含水量就较低。以物料温度最高[/size][size=14px]40[/size][size=14px]℃[/size][size=14px]为标准,调整蠕动泵流量和进风温度,得到蠕动泵流量和进风温度的设计区间。[/size][size=14px]在制粒前,首先对流化床进行预热处理[/size][size=14px]15[/size][size=14px]分钟,蒸干流化[/size][size=14px]床内部[/size][size=14px]残留的水分。放入配制好的物料进行混合[/size][size=14px]5[/size][size=14px]分钟,继续加热至物料温度达到[/size][size=14px]40[/size][size=14px]℃[/size][size=14px],打开蠕动[/size][size=14px]泵开始[/size][size=14px]喷入粘合剂。对蠕动泵流量和进风温度进行设定,得到失败批次中工艺参数的极限值。蠕动泵流量和进风温度的参数区间设计过程如下图所示。[/size]最终设定蠕动泵流量的参数设计区间为3.75~14.25ml/min,进风温度的参数设计区间在50℃~70℃。流化床所有可以操作的工艺参数可操作范围如下表所示。[align=center][font='times new roman'][size=16px]工艺参数操作空间[/size][/font][/align][table][tr][td][align=center][/align][/td][td][align=center][size=13px]进风量[/size][size=13px]/[/size][size=13px]m[/size][font='times new roman'][size=13px]3[/size][/font][size=13px][/size][size=13px]h[/size][font='times new roman'][size=13px]-1[/size][/font][/align][/td][td][align=center][size=13px]进风温度[/size][size=13px]/[/size][size=13px]℃[/size][/align][/td][td][align=center][size=13px]蠕动泵流量[/size][size=13px]/ml[/size][size=13px][/size][size=13px]min[/size][font='times new roman'][size=13px]-1[/size][/font][/align][/td][td][align=center][size=13px]雾化压力[/size][size=13px]/bar[/size][/align][/td][/tr][tr][td][align=center][size=13px]最小值[/size][/align][/td][td][align=center][size=13px]30[/size][/align][/td][td][align=center][size=13px]50[/size][/align][/td][td][align=center][size=13px]3.75[/size][/align][/td][td][align=center][size=13px]0.8[/size][/align][/td][/tr][tr][td][align=center][size=13px]最大值[/size][/align][/td][td][align=center][size=13px]60[/size][/align][/td][td][align=center][size=13px]70[/size][/align][/td][td][align=center][size=13px]14.25[/size][/align][/td][td][align=center][size=13px]1.8[/size][/align][/td][/tr][/table][font='times new roman'][size=16px][b]水分数据采集[/b][/size][/font][size=14px]颗粒的实际水分数据需要对颗粒离线测量进行采集,常用的测量方法是干燥失重法。[/size][size=14px]实验仪器为水分含量测试仪([/size][size=14px]xy-102[/size][size=14px])。先称量取样瓶的重量为[/size][size=14px][i]M[/i][/size][size=14px],在制[/size][size=14px]粒过程[/size][size=14px]中通过取样瓶从取样口取出少量样品进行称重得到重量为[/size][size=14px][i]M[/i][/size][font='times new roman'][size=14px][i]1[/i][/size][/font][size=14px],将样品倒入水分含量测试仪中的托盘上进行干燥,直到样品重量不再变化。把干燥后的样品重新倒入之前的取样瓶中进行称重得到重量为[/size][size=14px][i]M[/i][/size][font='times new roman'][size=14px][i]2[/i][/size][/font][size=14px]。计算[/size][size=14px][i]M[/i][/size][font='times new roman'][size=14px][i]1[/i][/size][/font][size=14px]和[/size][size=14px][i]M[/i][/size][font='times new roman'][size=14px][i]2[/i][/size][/font][size=14px]的之间的差值,求出样品中的水分含量。水分含量计算公式如下:[/size][align=right][size=14px] [/size][size=14px] [/size] (1)[/align]实验中使用的水分含量测试仪器如下图所示。[align=center][font='times new roman'][size=16px]图[/size][/font][font='times new roman'][size=16px] [/size][/font][font='times new roman'][size=16px]颗粒水分含量测试仪[/size][/font][/align][size=14px]制[/size][size=14px]粒过程[/size][size=14px]中每隔[/size][size=14px]4[/size][size=14px]分钟去取一次样品,每批次的制[/size][size=14px]粒时间[/size][size=14px]为[/size][size=14px]60[/size][size=14px]分钟,如此每个批次采集[/size][size=14px]15[/size][size=14px]个样品,进行了六批实验总共取得了[/size][size=14px]90[/size][size=14px]个样品的重量数据。用式([/size][size=14px]2-1[/size][size=14px])对每个样品进行水分含量的计算。得到[/size][size=14px]90[/size][size=14px]个样品的含水量如下表所示。[/size][align=center][font='times new roman'][size=16px]表[/size][/font][font='times new roman'][size=16px] [/size][/font][font='times new roman'][size=16px]样品水分含量[/size][/font][font='times new roman'][size=16px]数据[/size][/font][/align][table][tr][td][align=center][font='宋体'][size=13px]序号[/size][/font][/align][/td][td][align=center][font='宋体'][size=13px][color=#000000]瓶重[/color][/size][/font][font='宋体'][size=13px][color=#000000]/[/color][/size][/font][size=13px][color=#000000][i]M[/i][/color][/size][size=13px][color=#000000]g[/color][/size][font='times new roman'][size=13px][color=#000000]-1[/color][/size][/font][/align][/td][td][align=center][font='宋体'][size=13px]样品重[/size][/font][font='宋体'][size=13px]/[/size][/font][size=13px][color=#000000][i]M[/i][/color][/size][font='times new roman'][size=13px][color=#000000][i]1[/i][/color][/size][/font][size=13px][color=#000000]g[/color][/size][font='times new roman'][size=13px][color=#000000]-1[/color][/size][/font][/align][/td][td][align=center][font='宋体'][size=13px]干燥后重量[/size][/font][font='宋体'][size=13px]/[/size][/font][size=13px][color=#000000][i]M[/i][/color][/size][font='times new roman'][size=13px][color=#000000][i]2[/i][/color][/size][/font][size=13px][color=#000000]g[/color][/size][font='times new roman'][size=13px][color=#000000]-1[/color][/size][/font][/align][/td][td][align=center][font='宋体'][size=13px]水分[/size][/font][font='宋体'][size=13px][color=#000000]/[/color][/size][/font][size=13px][color=#000000]g[/color][/size][/align][/td][td][align=center][font='宋体'][size=13px][color=#000000]含水率/[/color][/size][/font][size=13px][color=#000000]%[/color][/size][/align][/td][/tr][tr][td][align=center][size=13px]1[/size][/align][/td][td][align=center][size=13px]18.9363[/size][/align][/td][td][align=center][size=13px]21.1395[/size][/align][/td][td][align=center][size=13px]21.0396[/size][/align][/td][td][align=center][size=13px]0.0999[/size][/align][/td][td][align=center][size=13px]4.53[/size][/align][/td][/tr][tr][td][align=center][size=13px]2[/size][/align][/td][td][align=center][size=13px]18.9028[/size][/align][/td][td][align=center][size=13px]21.193[/size][/align][/td][td][align=center][size=13px]21.1154[/size][/align][/td][td][align=center][size=13px]0.0776[/size][/align][/td][td][align=center][size=13px]3.39[/size][/align][/td][/tr][tr][td][align=center][size=13px]3[/size][/align][/td][td][align=center][size=13px]17.9725[/size][/align][/td][td][align=center][size=13px]20.1945[/size][/align][/td][td][align=center][size=13px]20.1151[/size][/align][/td][td][align=center][size=13px]0.0794[/size][/align][/td][td][align=center][size=13px]3.57[/size][/align][/td][/tr][tr][td][align=center][size=13px]4[/size][/align][/td][td][align=center][size=13px]19.5796[/size][/align][/td][td][align=center][size=13px]21.5691[/size][/align][/td][td][align=center][size=13px]21.4839[/size][/align][/td][td][align=center][size=13px]0.0852[/size][/align][/td][td][align=center][size=13px]4.28[/size][/align][/td][/tr][tr][td][align=center][size=13px]…[/size][/align][/td][td][align=center][size=13px]…[/size][/align][/td][td][align=center][size=13px]…[/size][/align][/td][td][align=center][size=13px]…[/size][/align][/td][td][align=center][size=13px]…[/size][/align][/td][td][align=center][size=13px]…[/size][/align][/td][/tr][tr][td][align=center][size=13px]88[/size][/align][/td][td][align=center][size=13px]19.8203[/size][/align][/td][td][align=center][size=13px]21.9924[/size][/align][/td][td][align=center][size=13px]21.8896[/size][/align][/td][td][align=center][size=13px]0.1028[/size][/align][/td][td][align=center][size=13px]4.73[/size][/align][/td][/tr][tr][td][align=center][size=13px]89[/size][/align][/td][td][align=center][size=13px]17.6107[/size][/align][/td][td][align=center][size=13px]19.84[/size][/align][/td][td][align=center][size=13px]19.7914[/size][/align][/td][td][align=center][size=13px]0.0486[/size][/align][/td][td][align=center][size=13px]2.18[/size][/align][/td][/tr][tr][td][align=center][size=13px]90[/size][/align][/td][td][align=center][size=13px]16.5792[/size][/align][/td][td][align=center][size=13px]18.6692[/size][/align][/td][td][align=center][size=13px]18.6366[/size][/align][/td][td][align=center][size=13px]0.0326[/size][/align][/td][td][align=center][size=13px]1.56[/size][/align][/td][/tr][/table][font='times new roman'][size=16px][b]光谱数据采集[/b][/size][/font][url=https://insevent.instrument.com.cn/t/1p][color=#3333ff]近红外光谱[/color][/url]是由于分子通过能量跃迁的方式产生的,对含H基团的N-H、C-H、O-H等化学键有很强的吸收峰[font='times new roman'][size=16px][51][/size][/font]。[url=https://insevent.instrument.com.cn/t/1p][color=#3333ff]近红外光谱[/color][/url]对含有H元素的光谱中心带近似位置见下表。[align=center][font='times new roman'][size=16px]表[/size][/font][font='times new roman'][size=16px] [/size][/font][font='times new roman'][size=16px]含[/size][/font][font='times new roman'][size=16px]H[/size][/font][font='times new roman'][size=16px]元素[/size][/font][font='times new roman'][size=16px]的[url=https://insevent.instrument.com.cn/t/1p][color=#3333ff]近红外光谱[/color][/url]中心带近似位置[/size][/font][font='times new roman'][size=16px](nm)[/size][/font][/align][table][tr][td][align=center][size=13px]振动类型[/size][/align][/td][td][align=center][size=13px]N-H[/size][/align][/td][td][align=center][size=13px]C-H[/size][/align][/td][td][align=center][size=13px]O-H[/size][/align][/td][td][align=center][size=13px]H[/size][font='times new roman'][size=13px]2[/size][/font][size=13px]O[/size][/align][/td][/tr][tr][td][align=center][size=13px]伸缩基频[/size][/align][/td][td][align=center][size=13px]3000[/size][/align][/td][td][align=center][size=13px]3[/size][size=13px]300[/size][/align][/td][td][align=center][size=13px]2[/size][size=13px]700[/size][/align][/td][td][align=center][size=13px]2[/size][size=13px]700[/size][/align][/td][/tr][tr][td][align=center][size=13px]剪式弯曲[/size][/align][/td][td][align=center][size=13px]6452[/size][/align][/td][td][align=center][size=13px]6[/size][size=13px]700[/size][/align][/td][td][align=center][size=13px]6[/size][size=13px]250[/size][/align][/td][td][align=center][size=13px]6[/size][size=13px]250[/size][/align][/td][/tr][tr][td][align=center][size=13px]合频[/size][/align][/td][td][align=center][size=13px]2200[/size][/align][/td][td][align=center][size=13px]2[/size][size=13px]300[/size][/align][/td][td][align=center][size=13px]2[/size][size=13px]000[/size][/align][/td][td][align=center][size=13px]1[/size][size=13px]940[/size][/align][/td][/tr][tr][td][align=center][size=13px]二级倍频[/size][/align][/td][td][align=center][size=13px]1540[/size][/align][/td][td][align=center][size=13px]1[/size][size=13px]745[/size][/align][/td][td][align=center][size=13px]1[/size][size=13px]450[/size][/align][/td][td][align=center][size=13px]1[/size][size=13px]440[/size][/align][/td][/tr][tr][td][align=center][size=13px]三级倍频[/size][/align][/td][td][align=center][size=13px]1040[/size][/align][/td][td][align=center][size=13px]1[/size][size=13px]170[/size][/align][/td][td][align=center][size=13px]9[/size][size=13px]50[/size][/align][/td][td][align=center][size=13px]9[/size][size=13px]60[/size][/align][/td][/tr][tr][td][align=center][size=13px]四级倍频[/size][/align][/td][td][align=center][size=13px]800[/size][/align][/td][td][align=center][size=13px]9[/size][size=13px]00[/size][/align][/td][td][align=center][size=13px]7[/size][size=13px]40[/size][/align][/td][td][align=center][size=13px]7[/size][size=13px]50[/size][/align][/td][/tr][tr][td][align=center][size=13px]五级倍频[/size][/align][/td][td][align=center][size=13px]—[/size][/align][/td][td][align=center][size=13px]7[/size][size=13px]50[/size][/align][/td][td][align=center][size=13px]—[/size][/align][/td][td][align=center][size=13px]—[/size][/align][/td][/tr][/table][size=14px]水是由[/size][size=14px]H[/size][size=14px]和[/size][size=14px]O[/size][size=14px]元素组成的,因此,利用近红外光可以较为准确地预测出含有[/size][size=14px]O-H[/size][size=14px]化学键的水分含量。在每次取样的时候用近红外探头对样品进行扫描来取得每个样品的原始光谱。光谱采集软件用的是[/size][size=14px]MicroNIR[/size][size=14px]™ Pro v2.5.1[/size][size=14px]软件,首先对空气进行采谱,然后用聚四氟乙烯制成的白板挡住探头采集背景光谱进行校准,最后将探头伸入流化床腔体中对样品进行采谱。通过探头采集到的[url=https://insevent.instrument.com.cn/t/1p][color=#3333ff]近红外光谱[/color][/url]共有[/size][size=14px]125[/size][size=14px]个波段,波长的范围在[/size][size=14px]908.1nm~1676.0nm[/size][size=14px]之间。图为通过采样得到的[url=https://insevent.instrument.com.cn/t/1p][color=#3333ff]近红外光谱[/color][/url]。[/size][align=center][font='times new roman'][size=16px]图[/size][/font][font='times new roman'][size=16px] [/size][/font][font='times new roman'][size=16px][url=https://insevent.instrument.com.cn/t/1p][color=#3333ff]近红外光谱[/color][/url]图[/size][/font][/align][size=14px]从图中可以看出,在[/size][size=14px]1400nm~1650nm[/size][size=14px]波段之间[url=https://insevent.instrument.com.cn/t/1p][color=#3333ff]近红外光谱[/color][/url]的吸收度比较高,并且在不同水分含量间变化比较明显。[/size][font='times new roman'][size=16px][b]工艺参数数据采集[/b][/size][/font][size=14px]制[/size][size=14px]粒过程[/size][size=14px]中的工艺参数主要包括物料温度、进风温度、排风温度、蠕动泵流量、雾化压力和进风量。为了探究流化床工艺参数和颗粒水分含量间的关系模型,必须对制[/size][size=14px]粒过程[/size][size=14px]中的工艺参数进行实时采集。各种传感器对工艺参数数据进行采集并进行数字化,通过串口的方式将参数[/size][size=14px]数[/size][size=14px]据传到流化床的操作屏幕上,并以时间戳的形式将参数数据保存在用于记录生产过程的[/size][size=14px]U[/size][size=14px]盘中。工艺参数数显屏幕如下图所示。[/size][align=center][img]https://ng1.17img.cn/bbsfiles/images/2020/09/202009031751133116_6034_3890113_3.jpeg[/img][/align][font='times new roman'][size=16px][b]小[/b][/size][/font][font='times new roman'][size=16px][b]结[/b][/size][/font][size=14px]本文[/size][size=14px]对流化床制粒过程中的数据采集进行了研究,主要结论如下:[/size][size=14px]([/size][size=14px]1[/size][size=14px])为了能获取流化床制粒过程中颗粒的水分含量和工艺参数数据,建立了流化床制粒过程数据采集平台。[/size][size=14px]([/size][size=14px]2[/size][size=14px])设计了制[/size][size=14px]粒过程[/size][size=14px]的试验方案,进行了[/size][size=14px]6[/size][size=14px]个批次的实验,利用干燥失重法采集到了[/size][size=14px]90[/size][size=14px]个颗粒水分数据。对这[/size][size=14px]90[/size][size=14px]个样品进行近红外采谱,为建立水分预测模型奠定了数据基础。[/size]
麦克默瑞提克(上海)仪器有限公司提供孔径分析仪,孔径测定仪,纳米粒度仪,粒度仪,粒度粒形分析,Zeta电位,微型反应器,磁性分析产品简介磁性分析仪(MA - 1040)用来检测各种材料中的微量铁,包含用于电线绝缘用塑料光纤的原料高纯度玻璃的检测。它也可用于检测食品、宝石、电池材料、耐火材料、药品以及许多其他材料中的微量金属铁的含量。能够检测出含量极低的铁的含量对原料是否能加工成成品是非常重要的。技术特点· 极高的灵敏度,可最低检测到0.00001%的含磁量· 占地面积小,使用方便· 被美国ANSI(American National Standards Institute)引用· 分辨率达亚ppm级 产品应用磁性分析仪(MA - 1040)用来检测各种材料中的微量铁,包含用于电线绝缘用塑料光纤的原料高纯度玻璃的检测。它也可用于检测食品、宝石、电池材料、耐火材料、药品以及许多其他材料中的微量金属铁的含量。


 我要推广仪器
 下载APP
下载APP